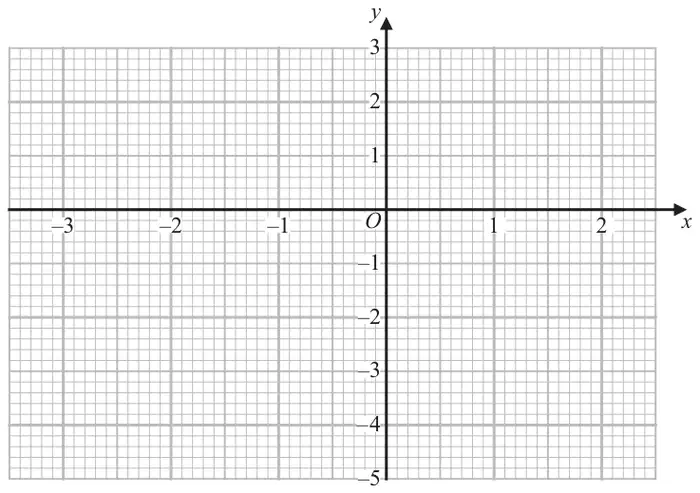
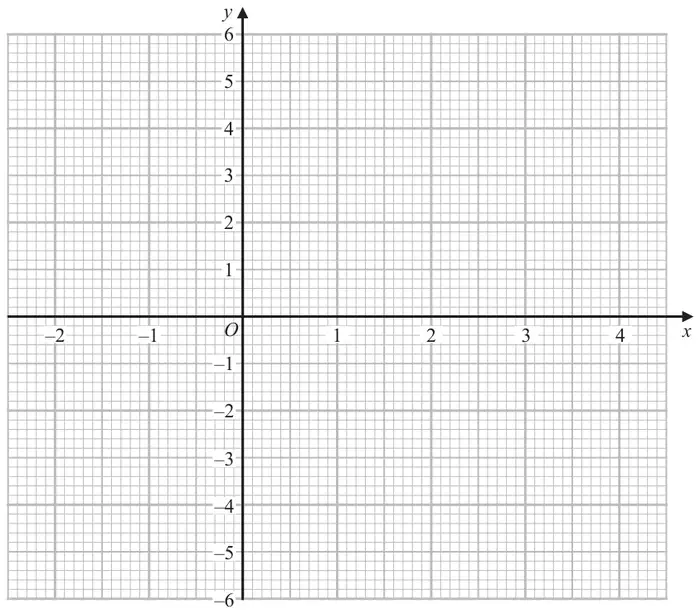
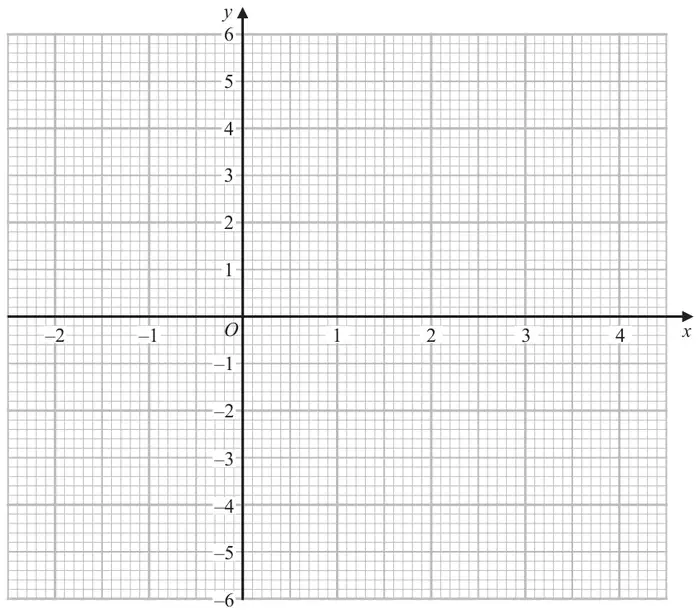
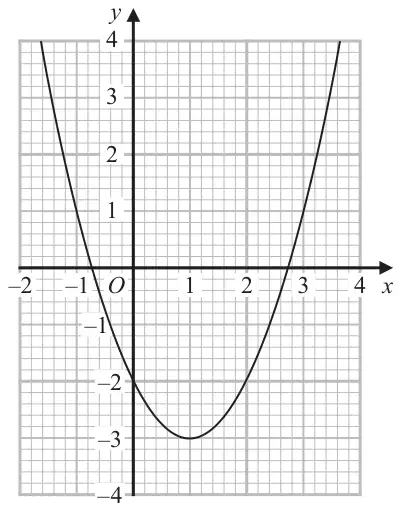
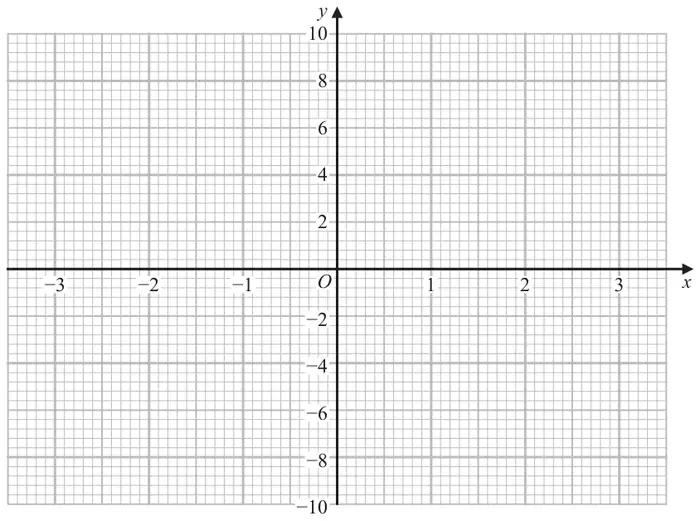
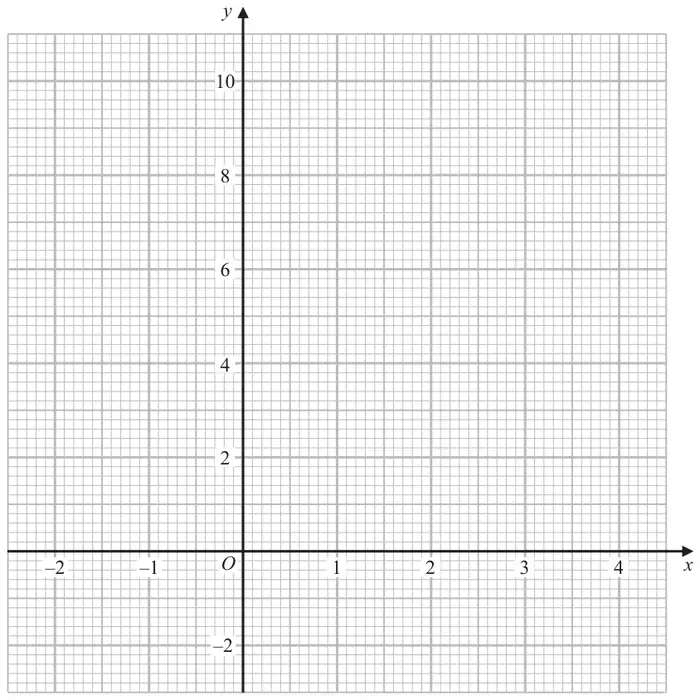
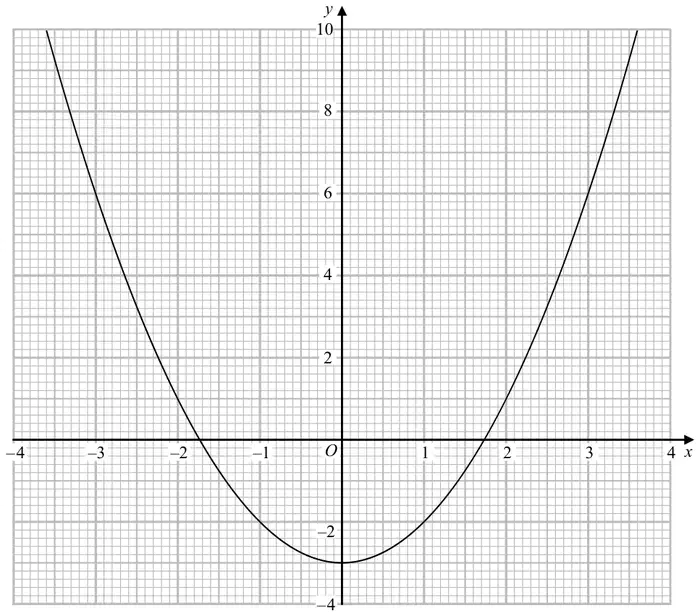
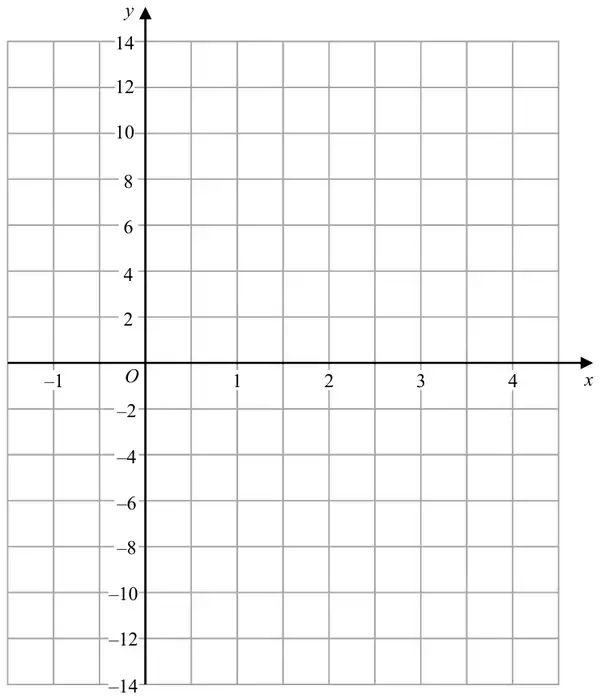
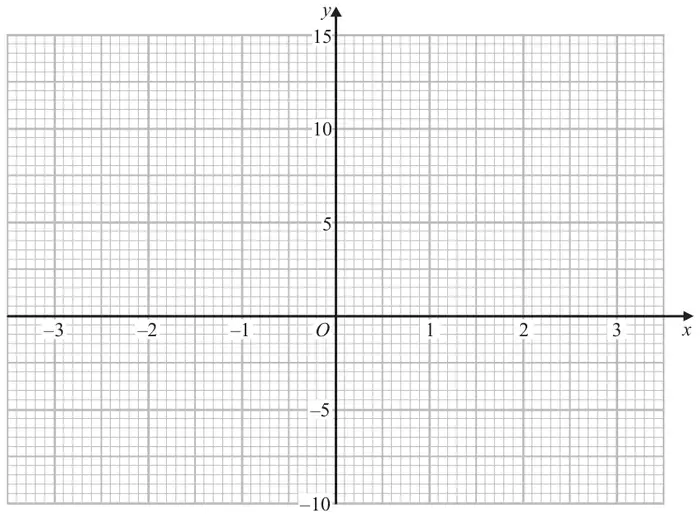
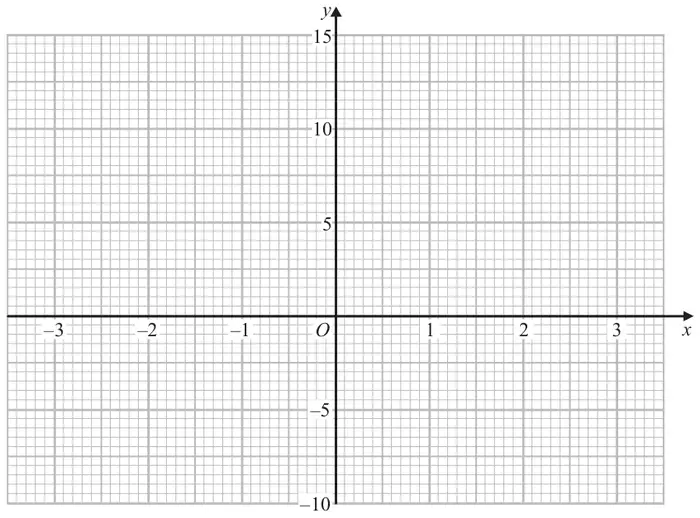
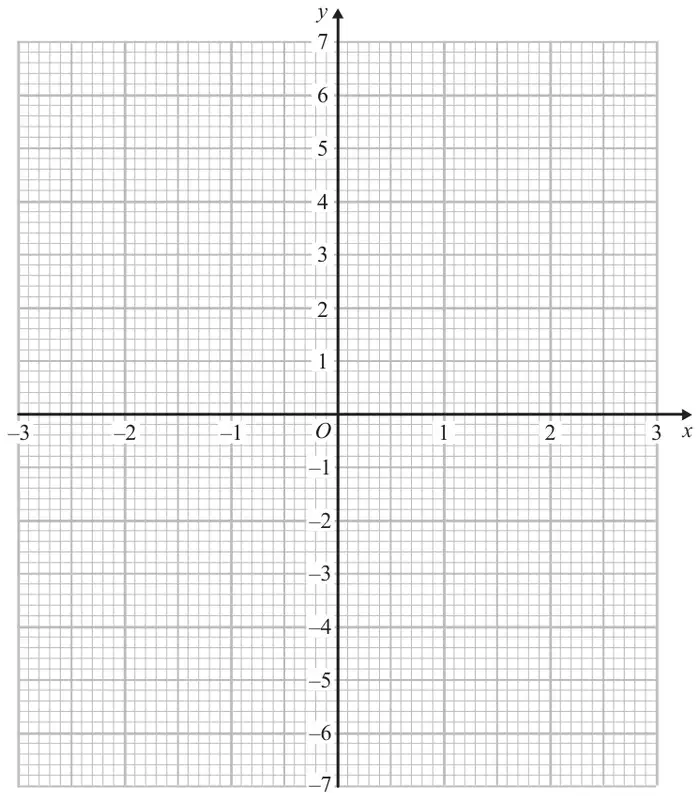
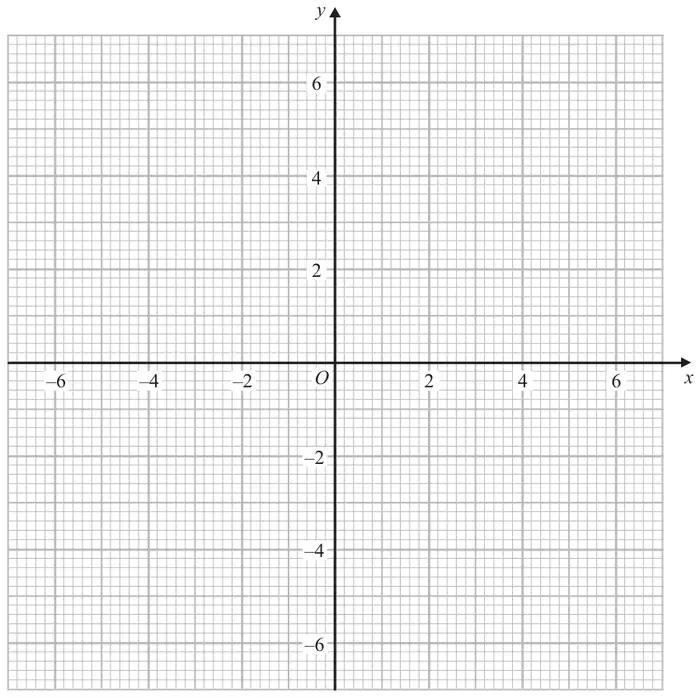
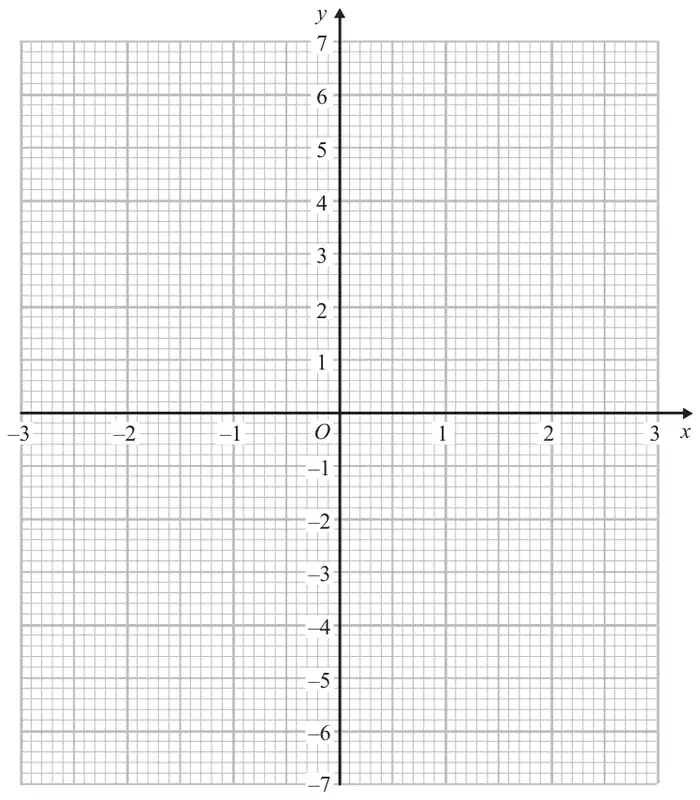
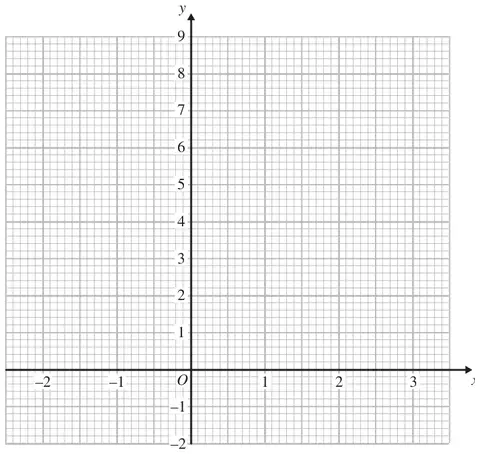
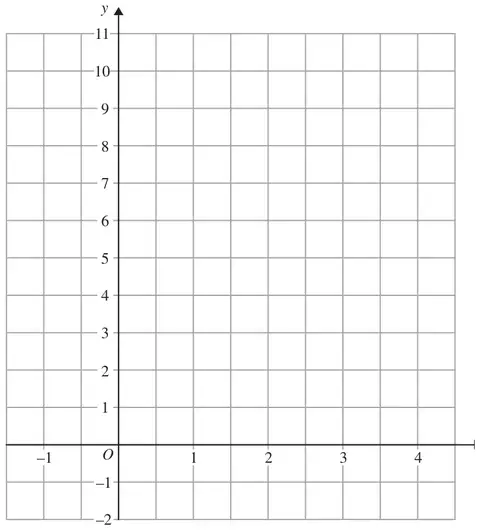
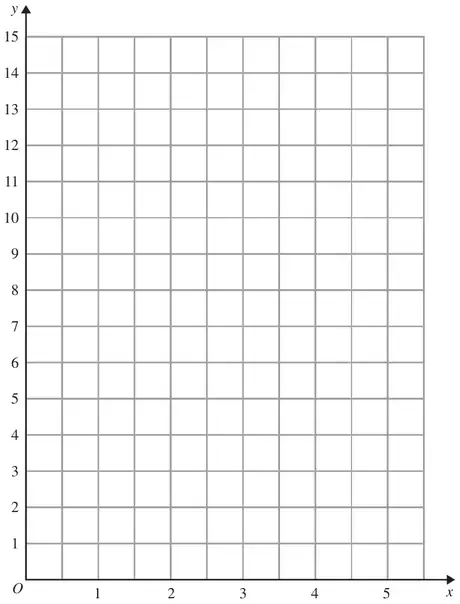
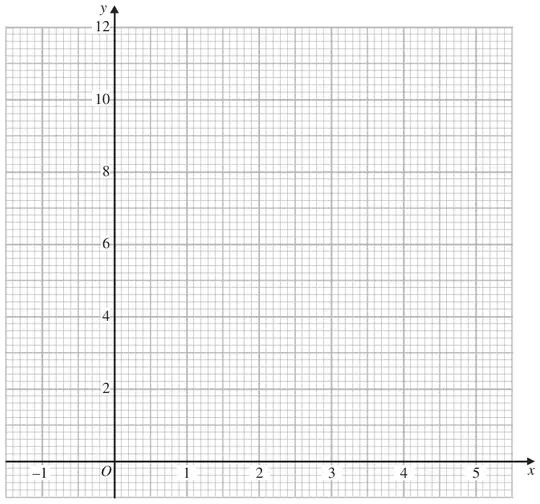
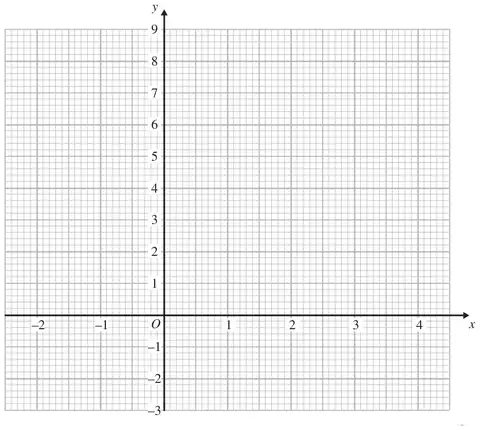
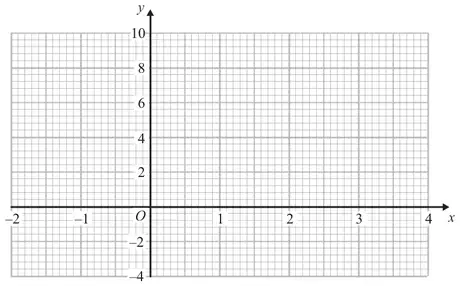
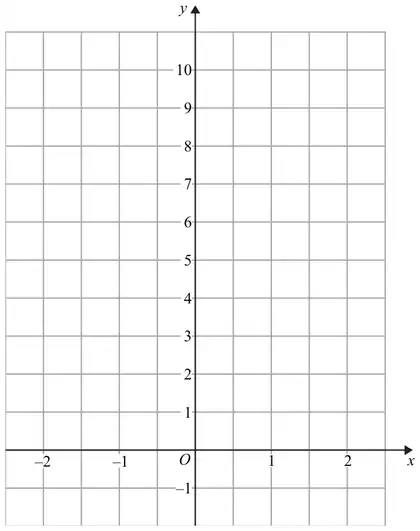
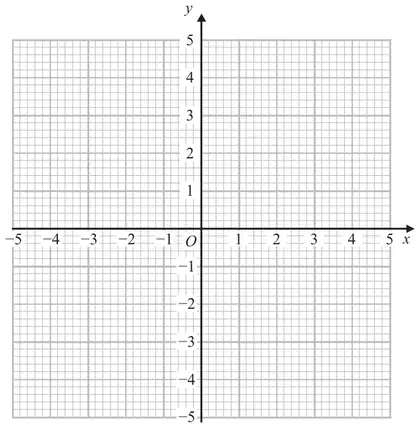
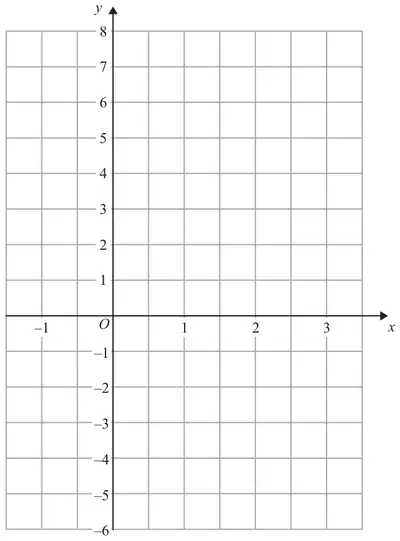
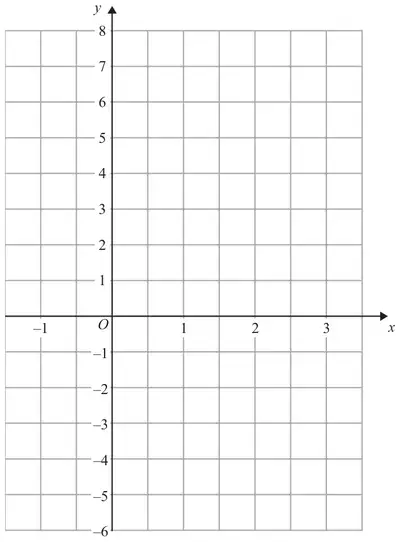
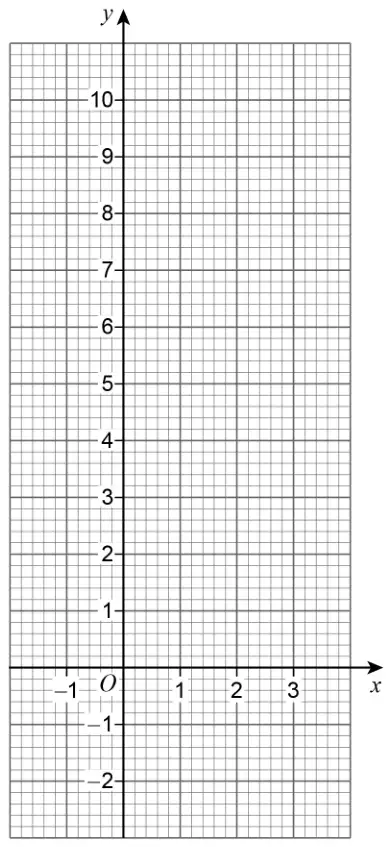
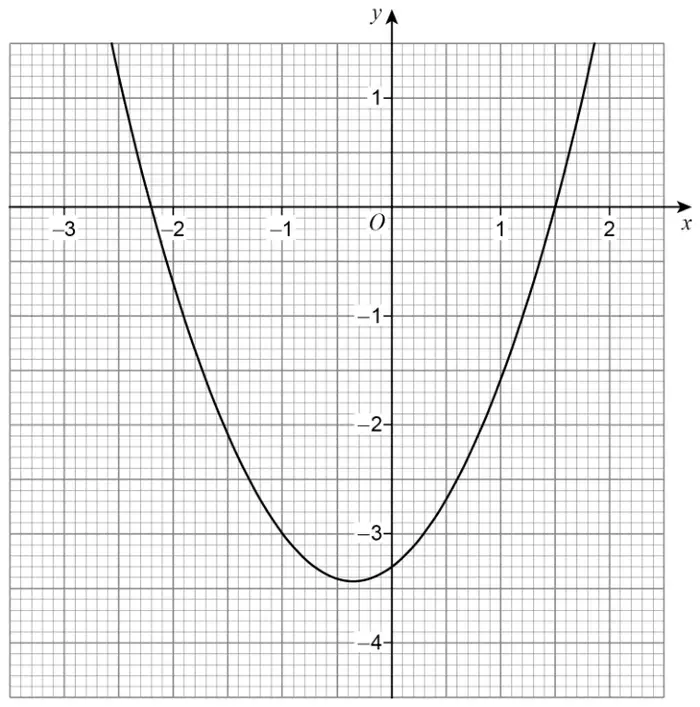
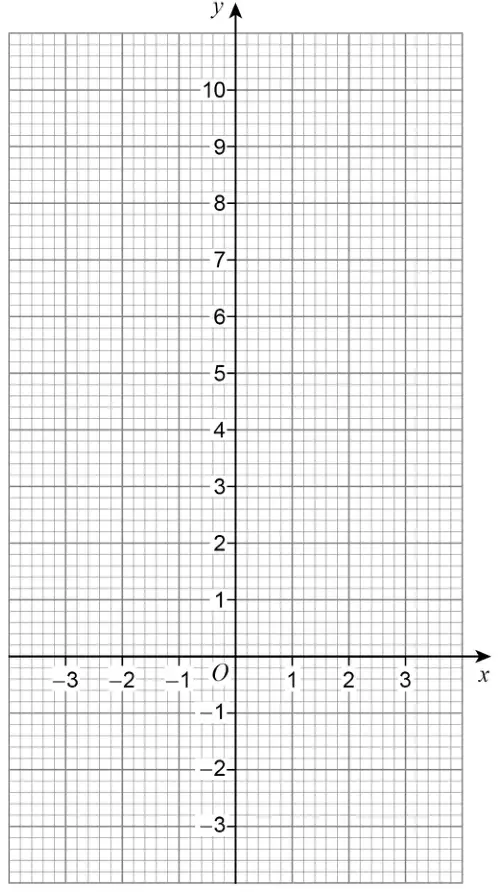
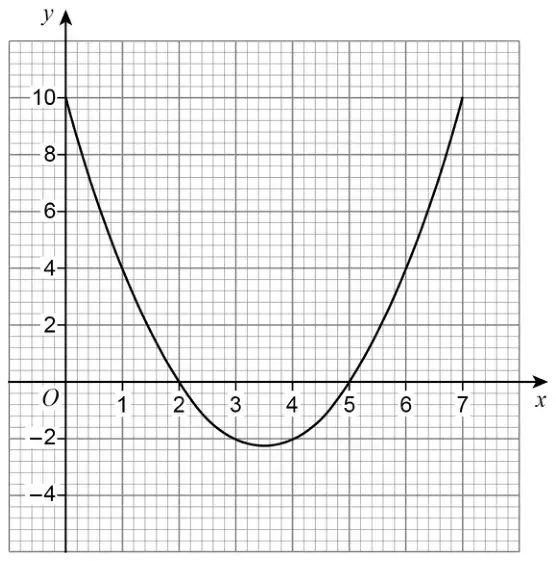
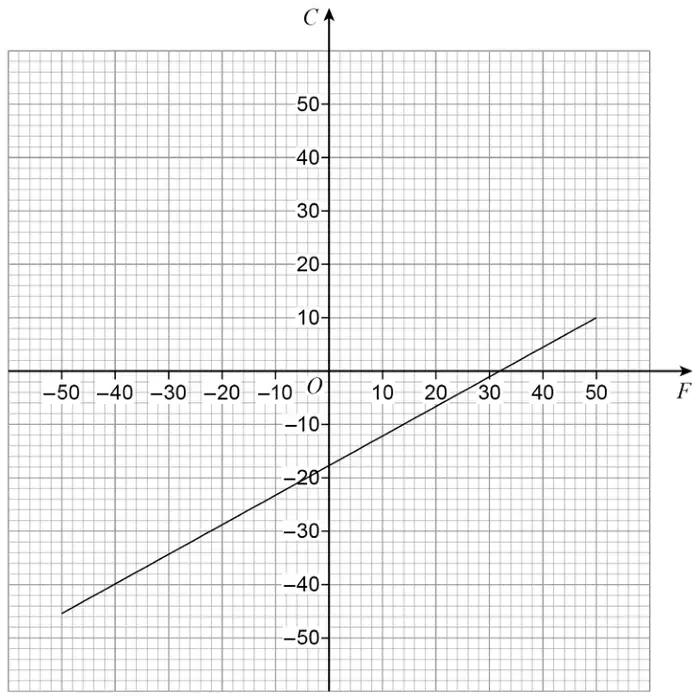
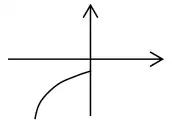
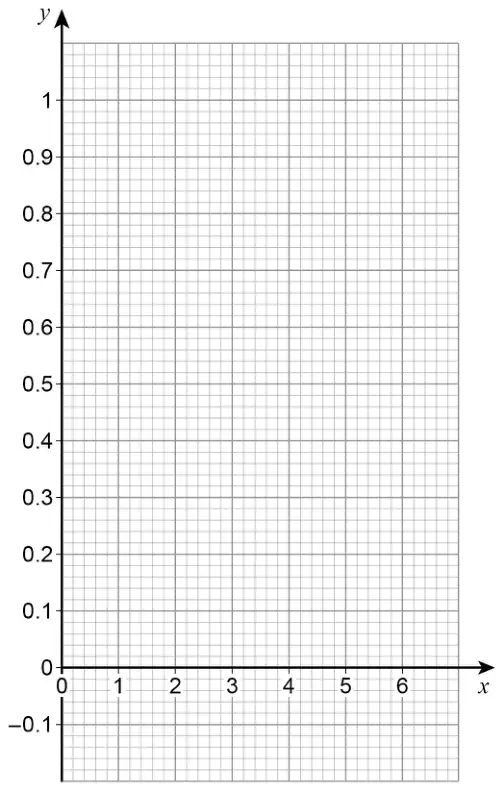
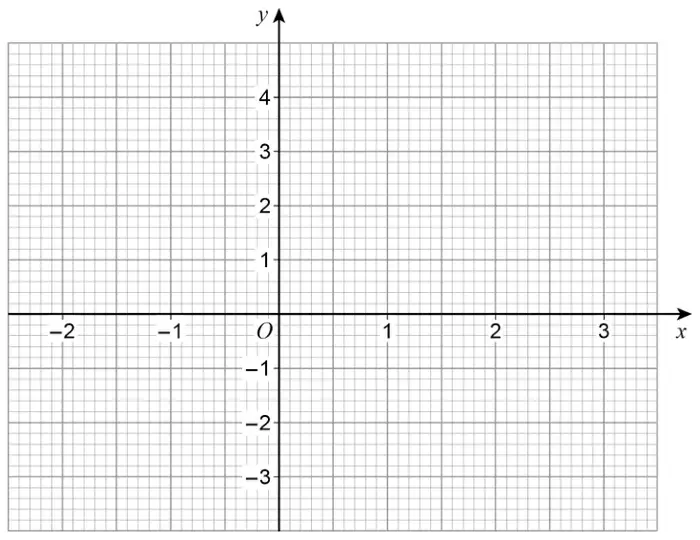
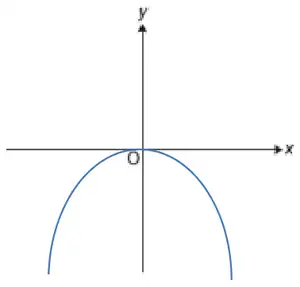
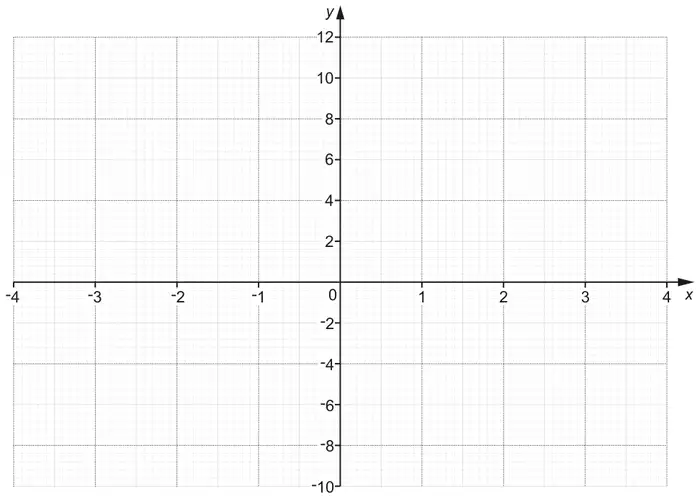
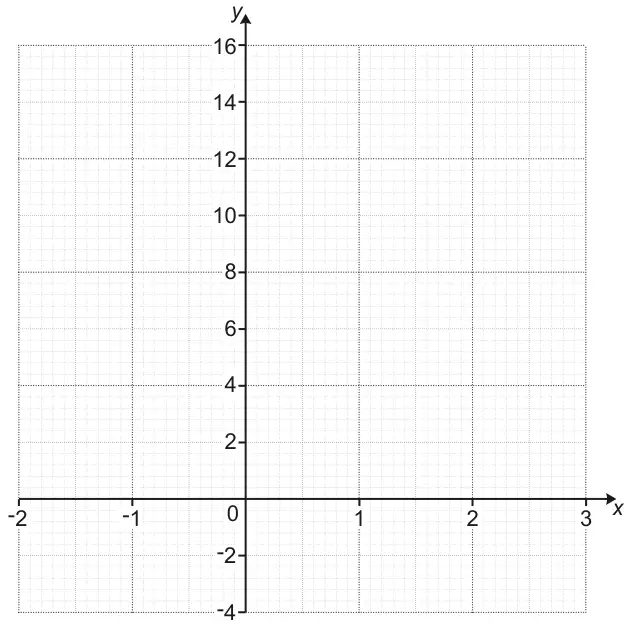
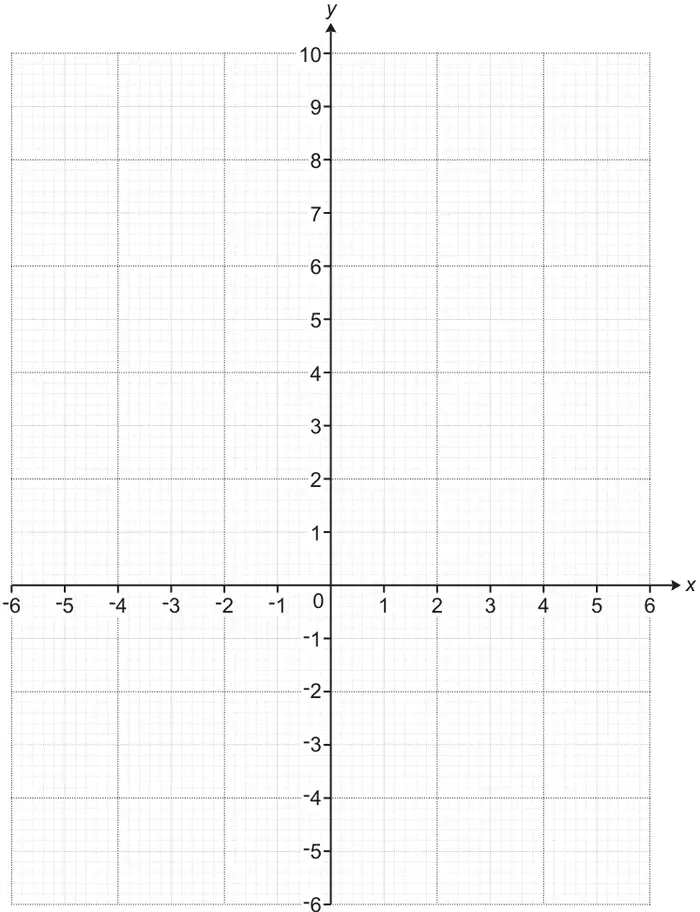
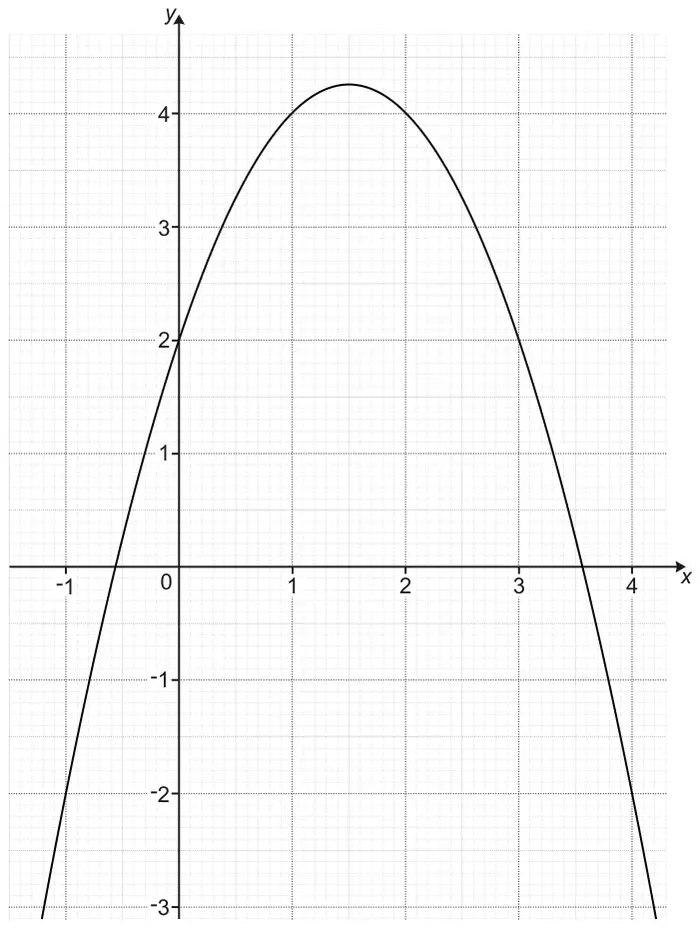
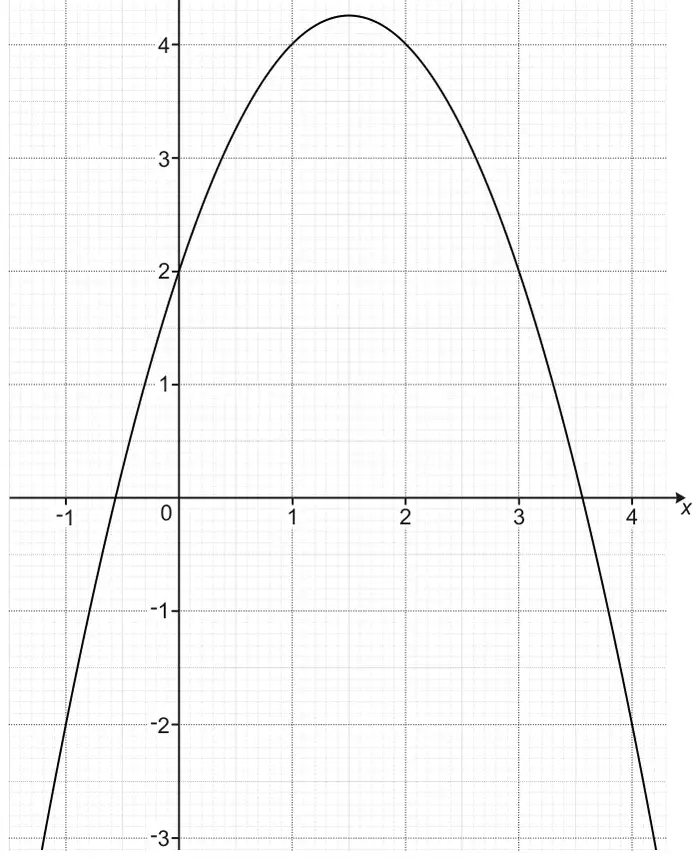
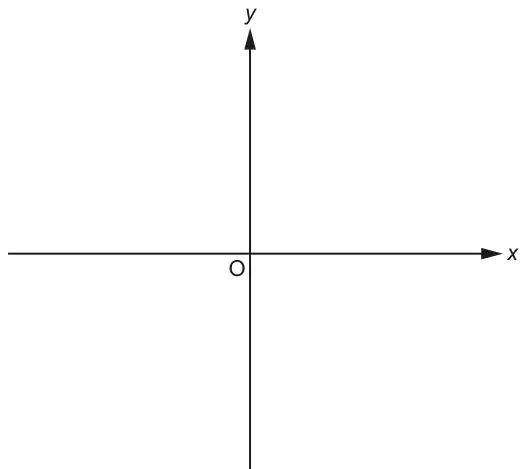
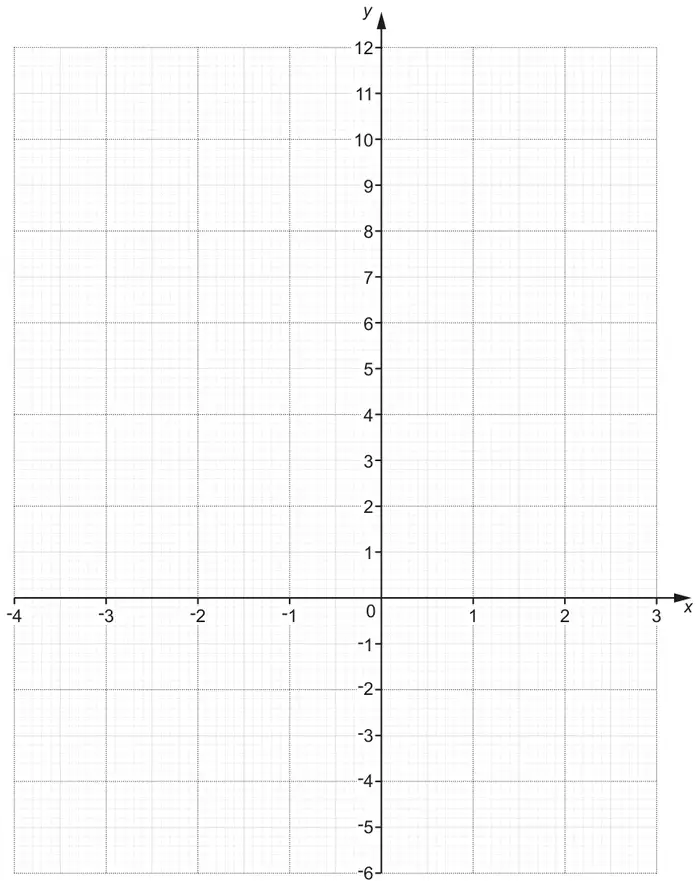
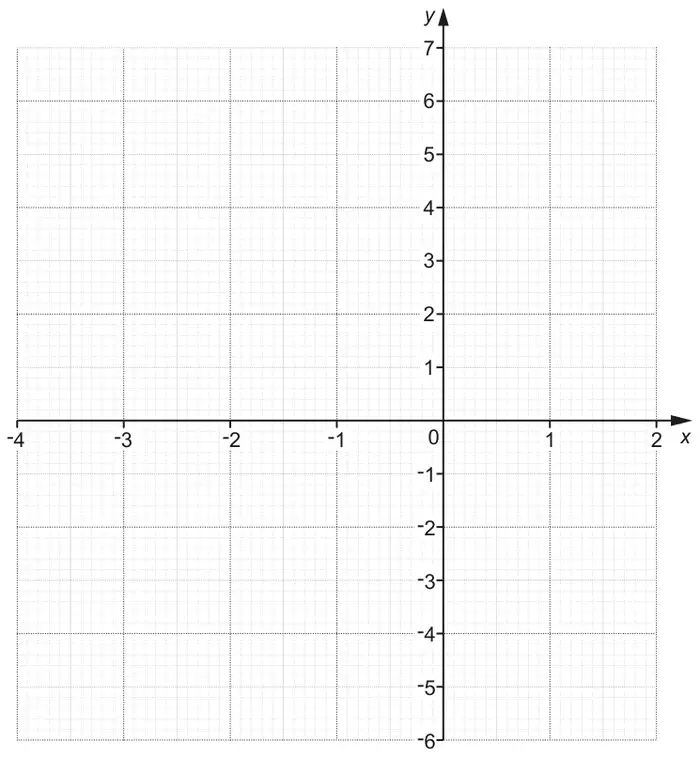
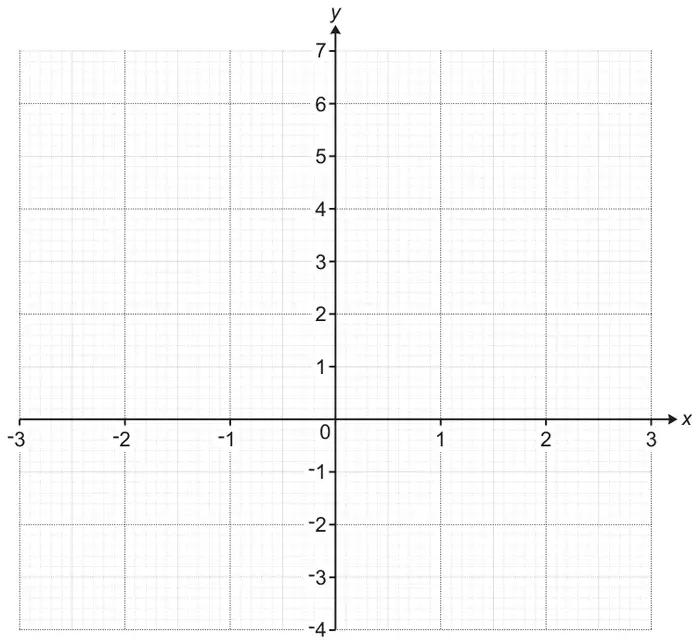
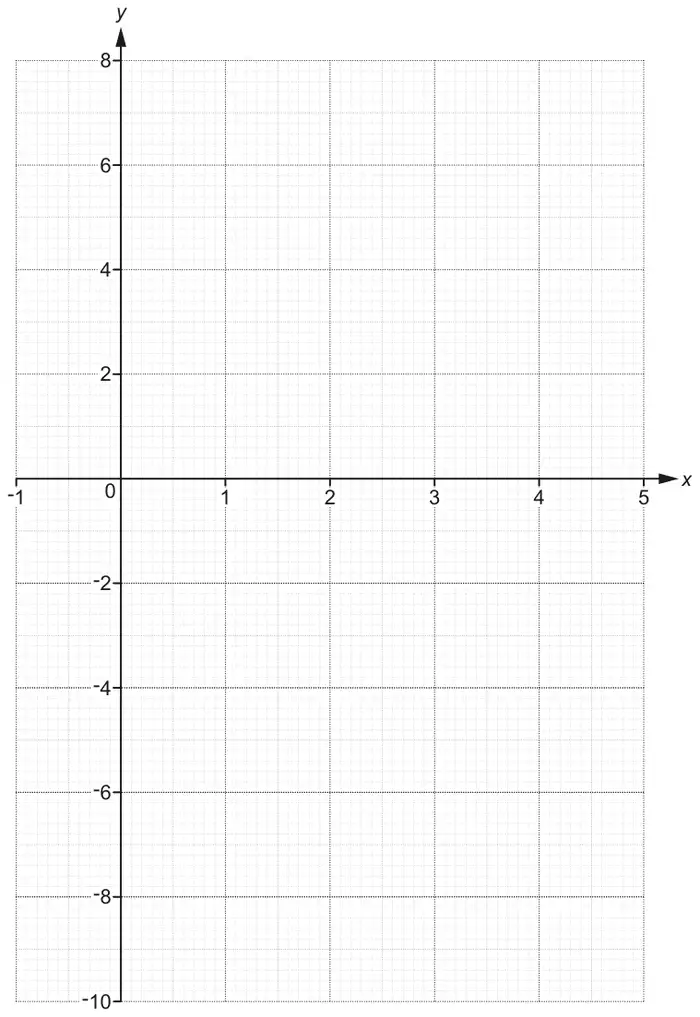
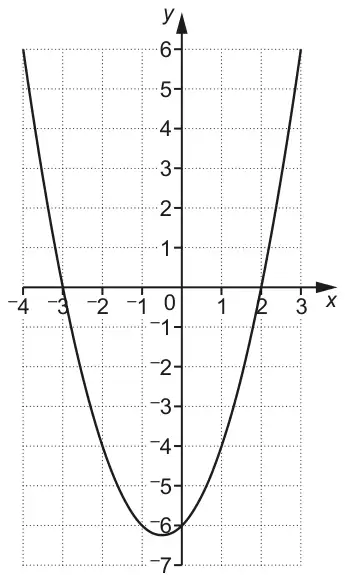
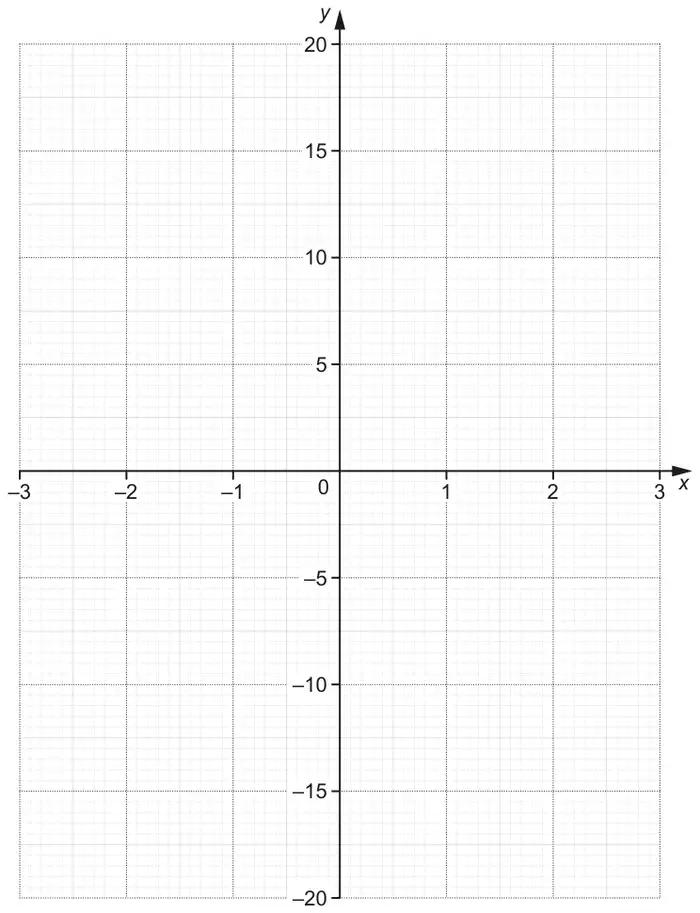
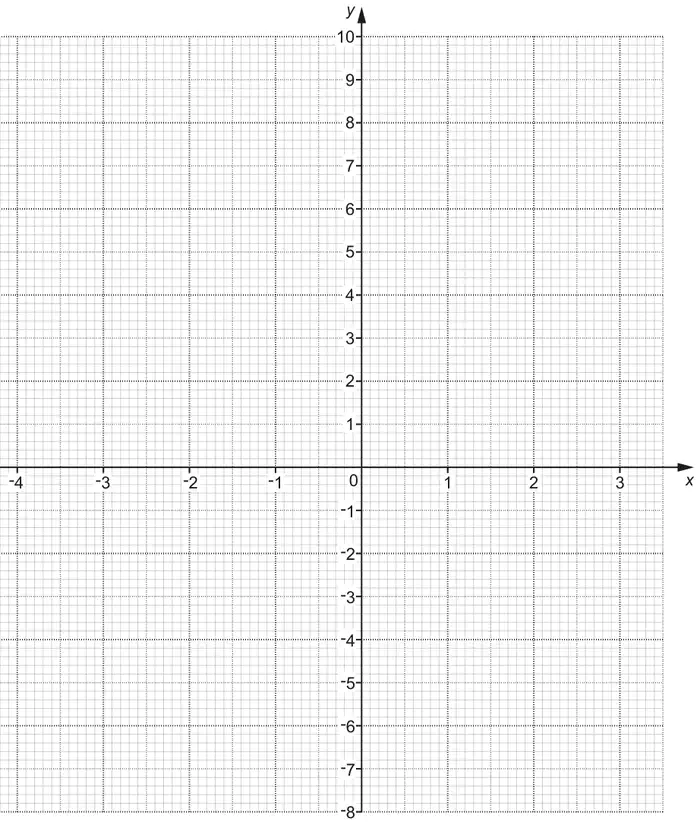
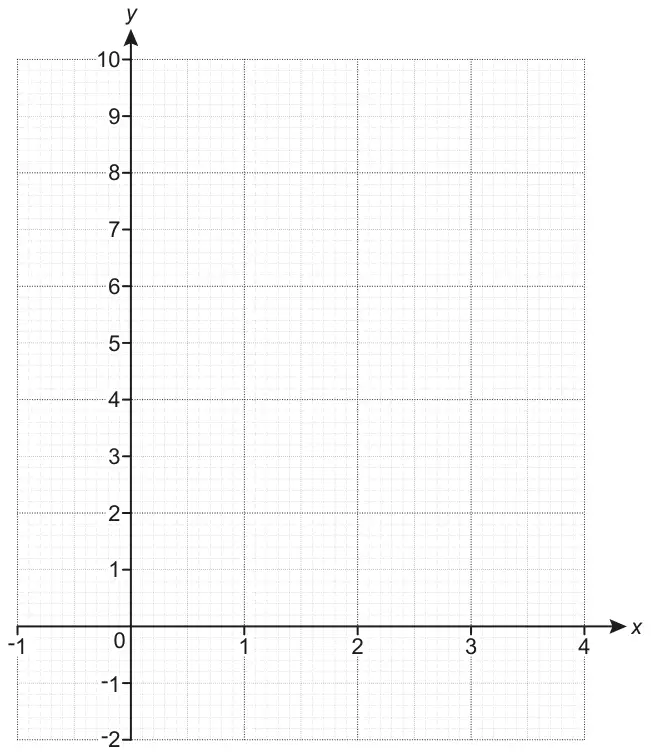
(a) Complete the table of values for \(y = x^2 + x - 4\)
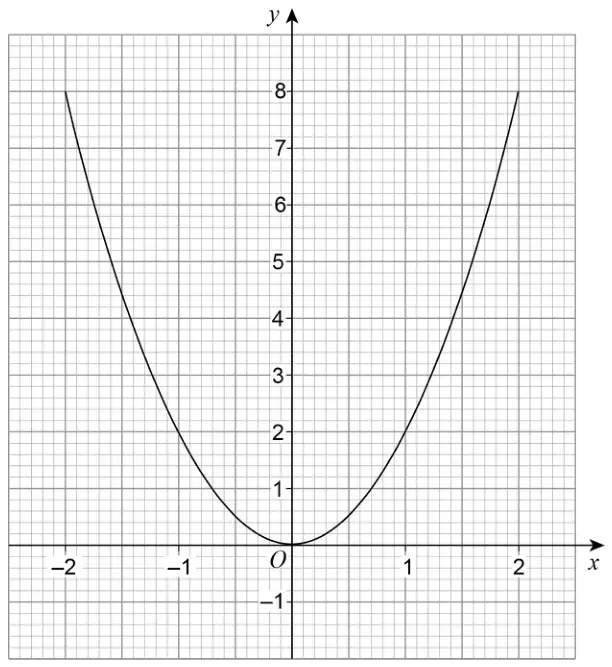
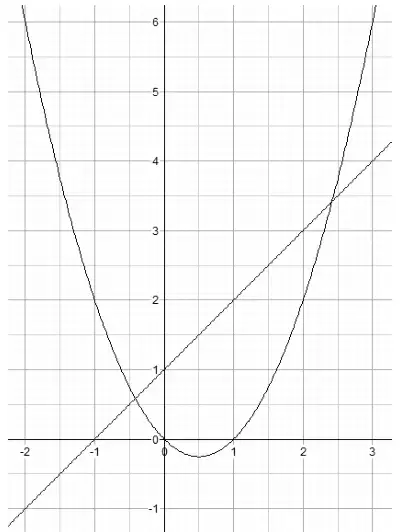
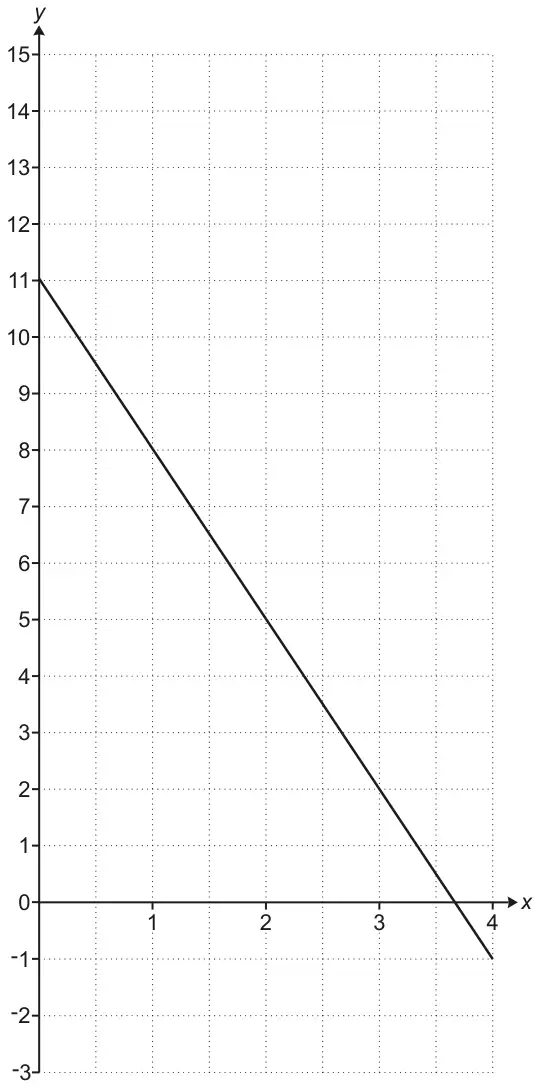
\(x\)
−3
−2
−1
0
1
2
\(y\)
2
−4
(2)
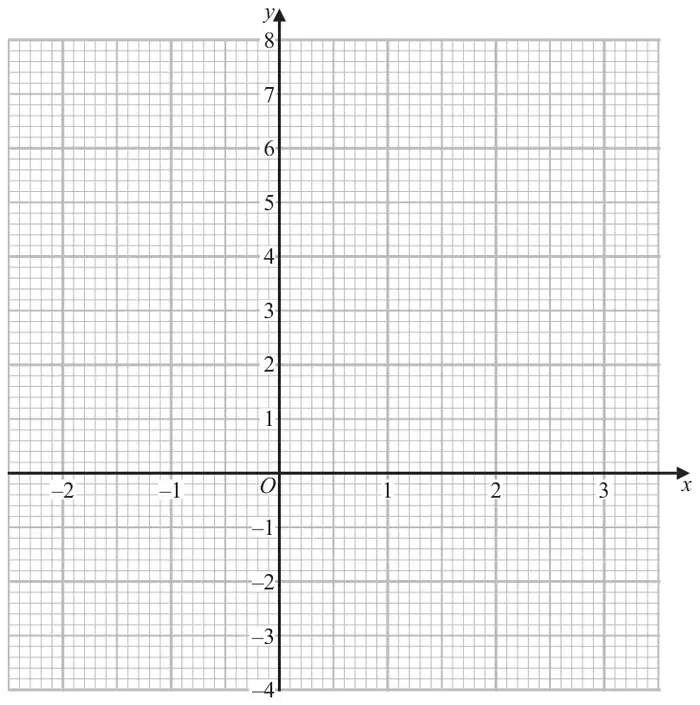
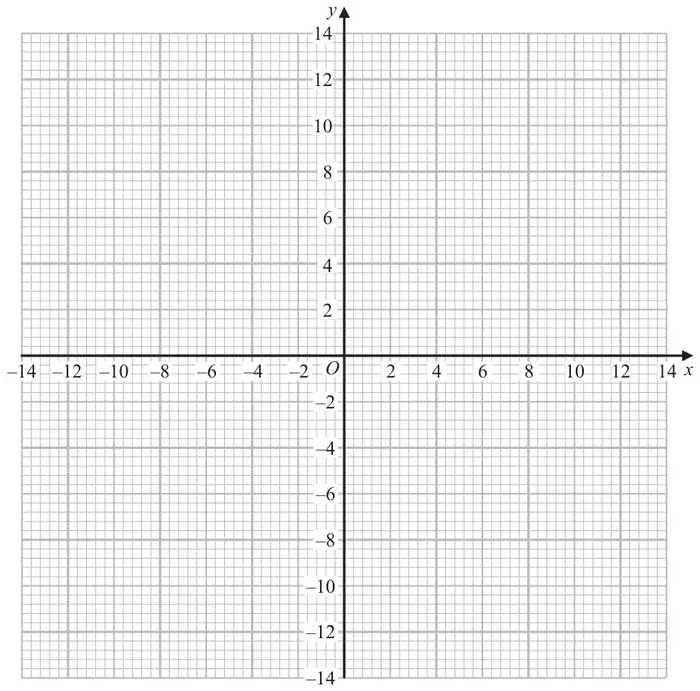
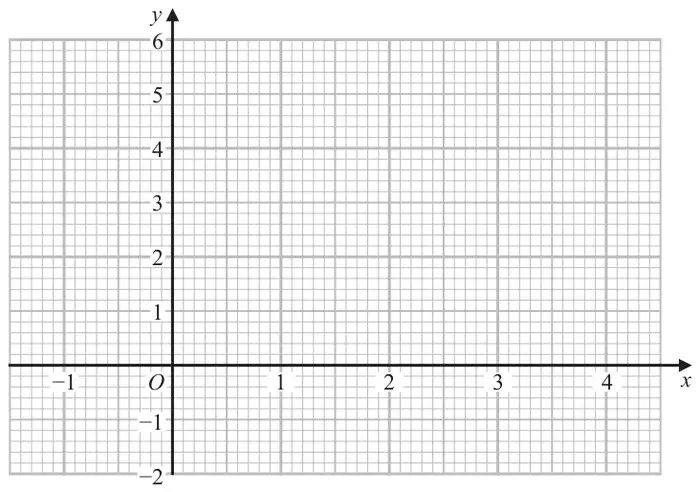
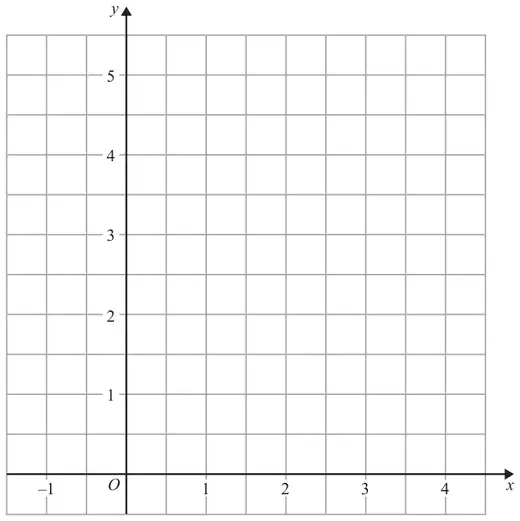
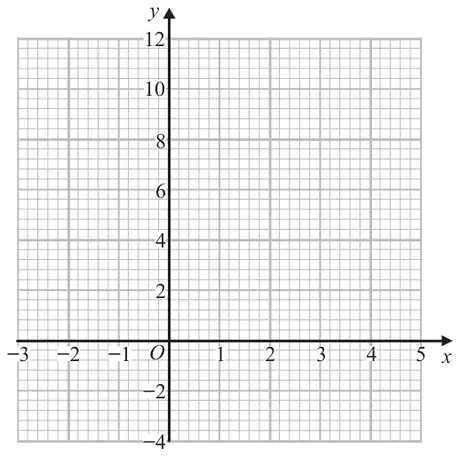
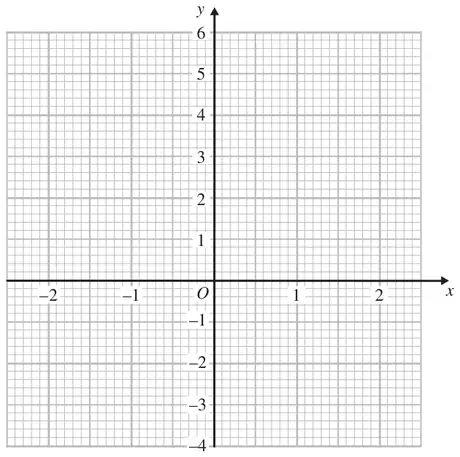
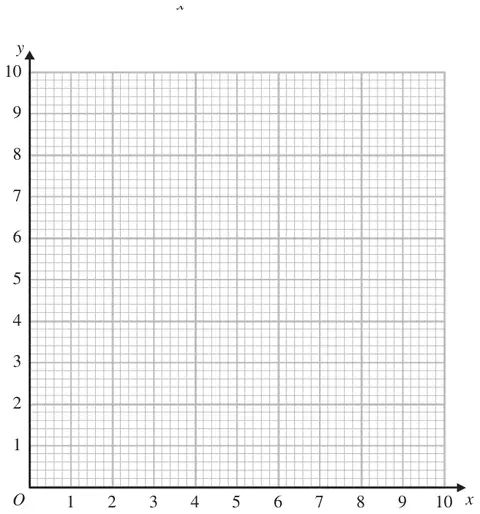
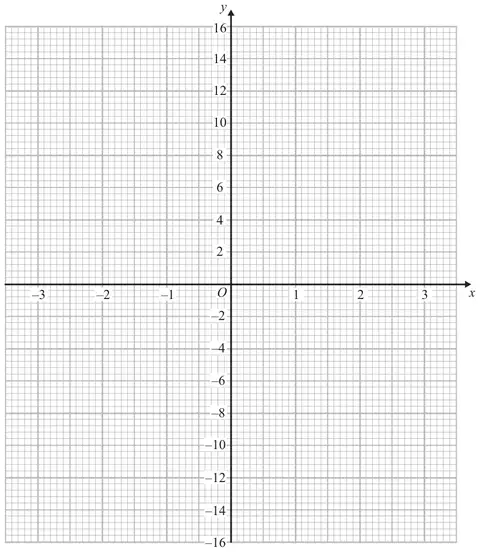
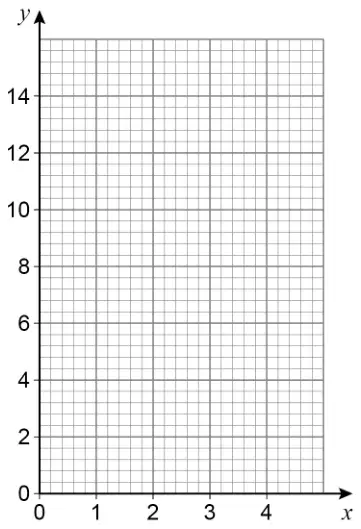
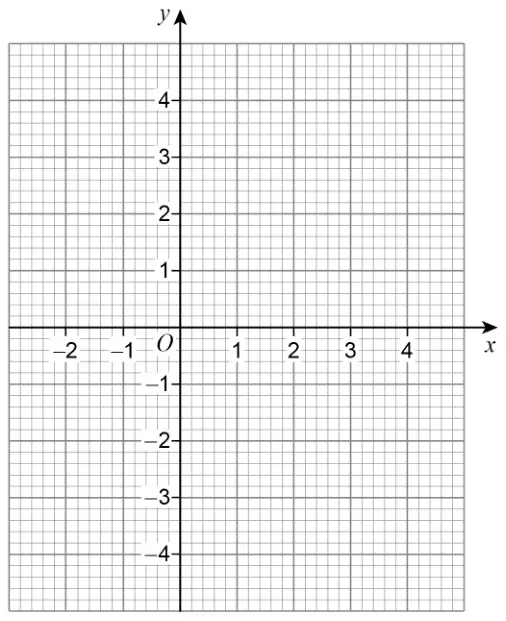
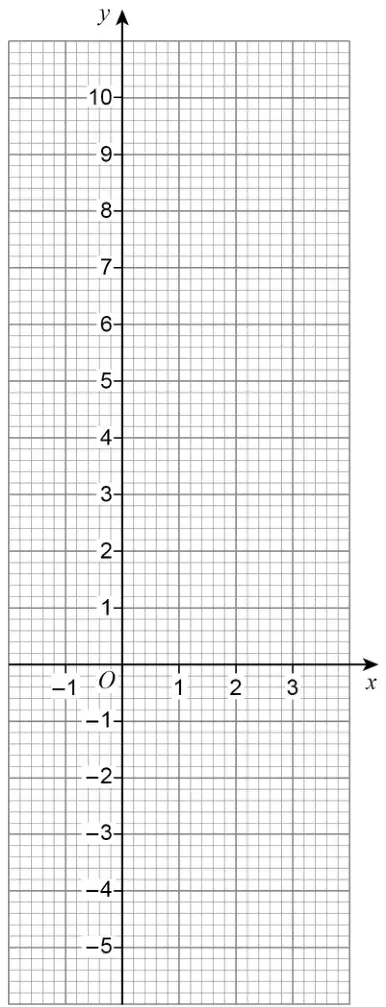
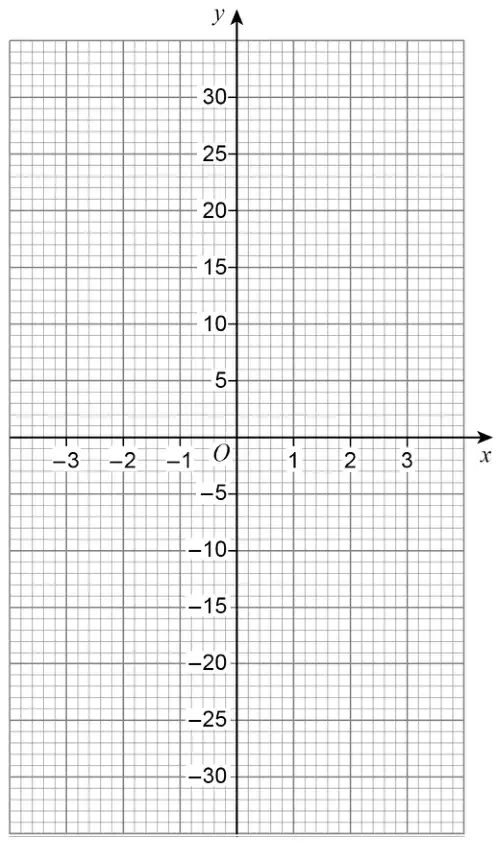
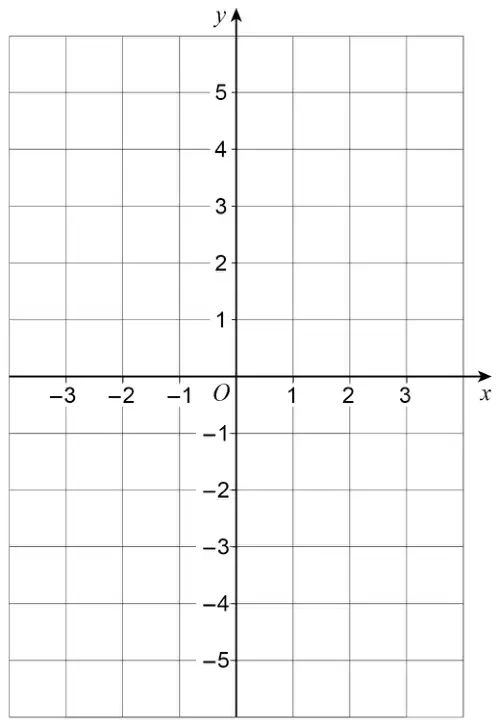
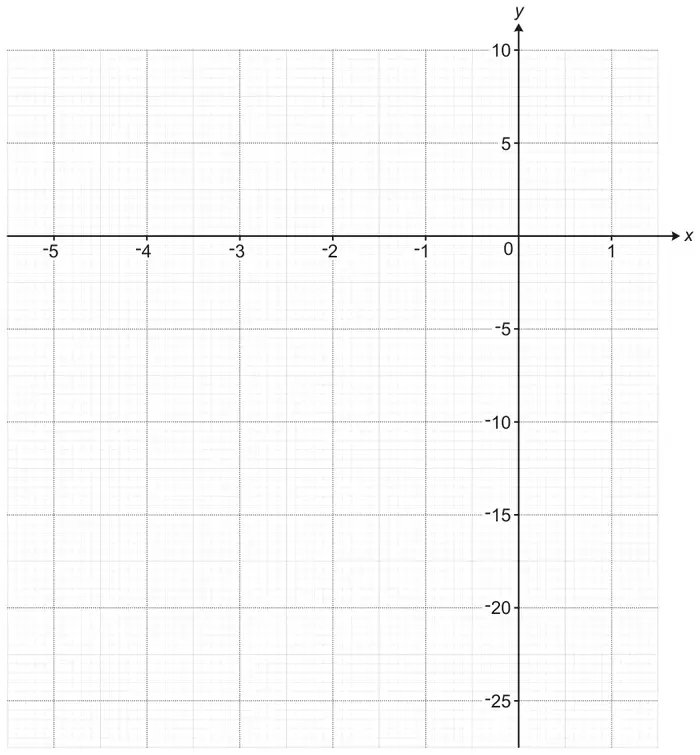
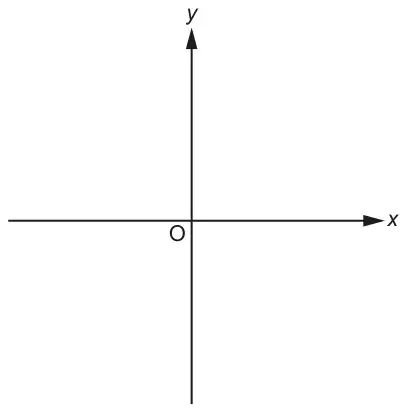
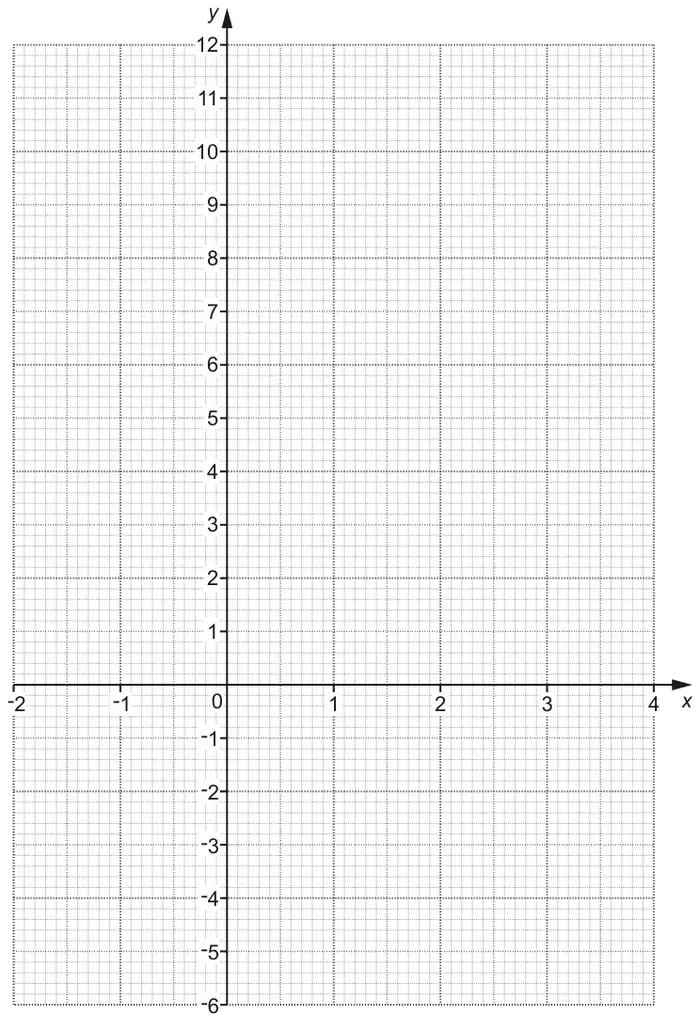
(b) On the grid, draw the graph of \(y = x^2 + x - 4\) for values of \(x\) from \(-3\) to 2(2)
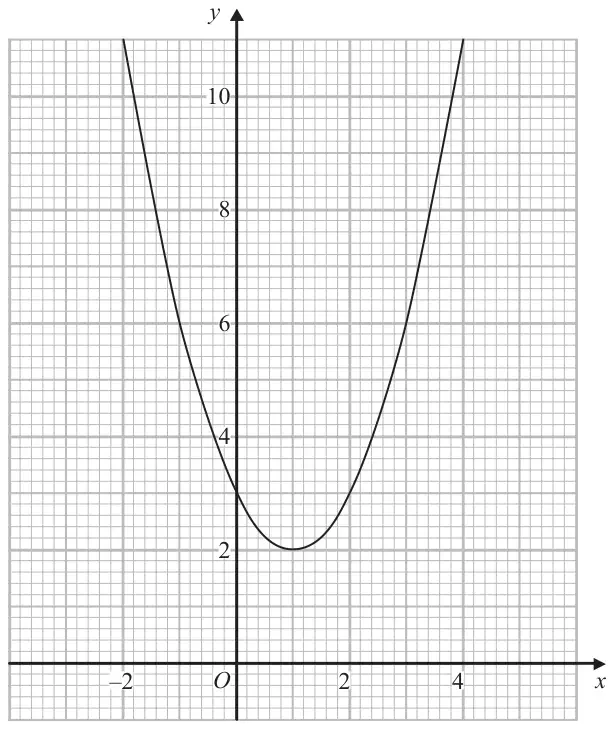
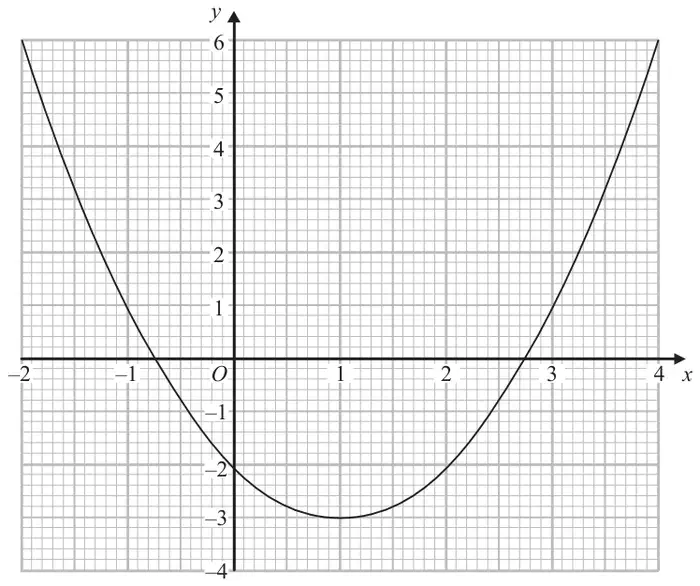
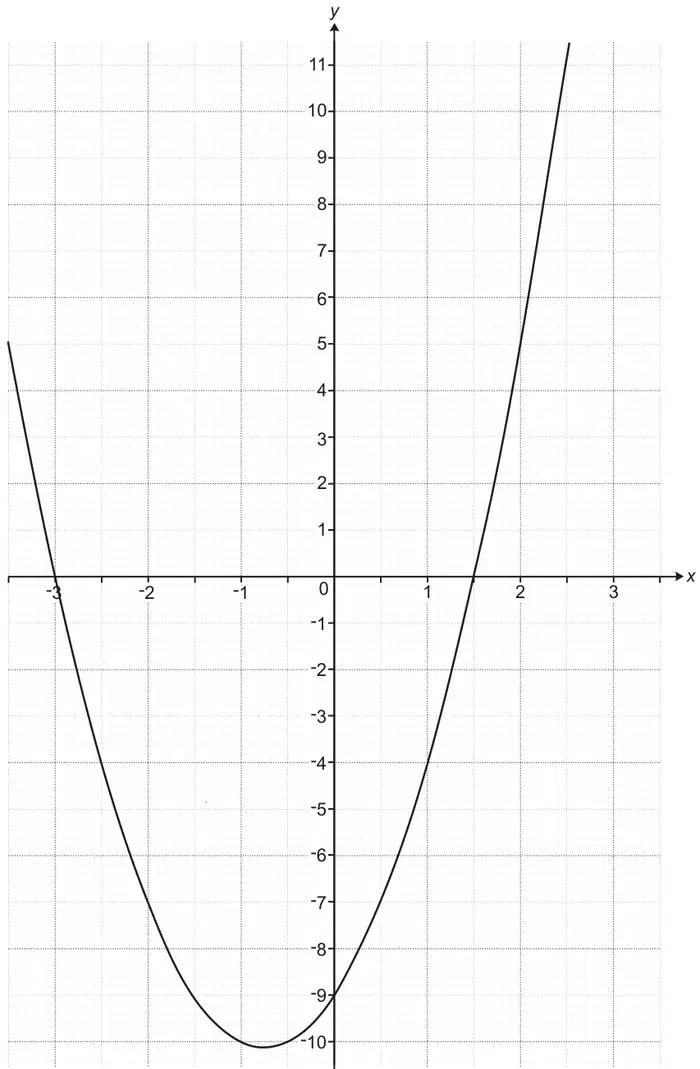
(c) Write down the coordinates of the turning point of the graph of \(y = x^2 + x - 4\) (1)
Mark scheme (a)
Answer
Mark
Mark scheme
\((2), -2, (-4), -4, -2, 2\)
B2
for all 4 values correct
(B1
for 2 or 3 correct values)
Mark scheme (b)
Answer
Mark
Mark scheme
Graph drawn
B2
for a fully correct graph
(B1
ft (dep on B1 in (a)) for plotting at least 5 of the points from their table correctly)
Additional guidance
Accept a freehand curve drawn that is not made of line segments Curve must not have a horizontal segment between \((-1, -4)\) and \((0, -4)\) Ignore anything drawn outside the required range
Mark scheme (c)
Answer
Mark
Mark scheme
\(-0.5, -4.25\)
B1
ft their graph with a single turning point or for \(x\) coordinate \(= -0.5\) and \(y\) coordinate \(= -4.25\) oe
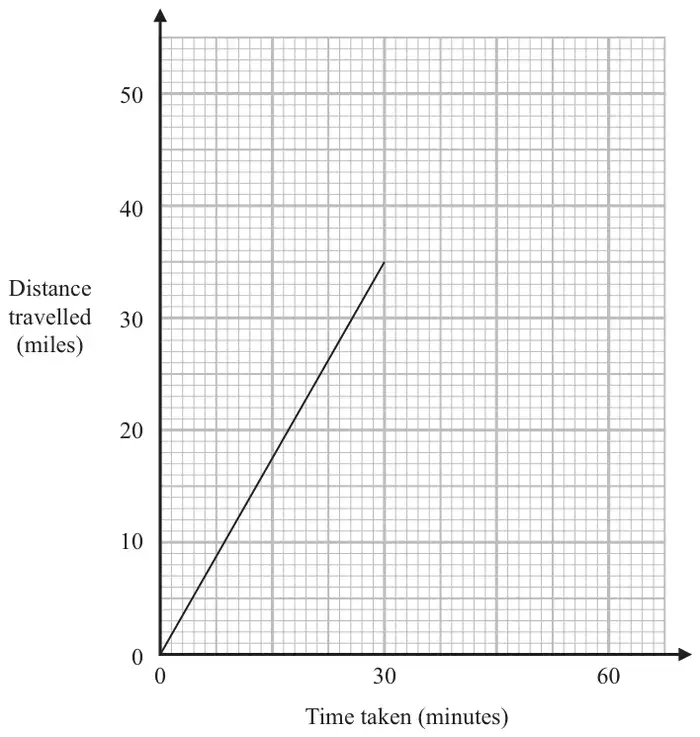
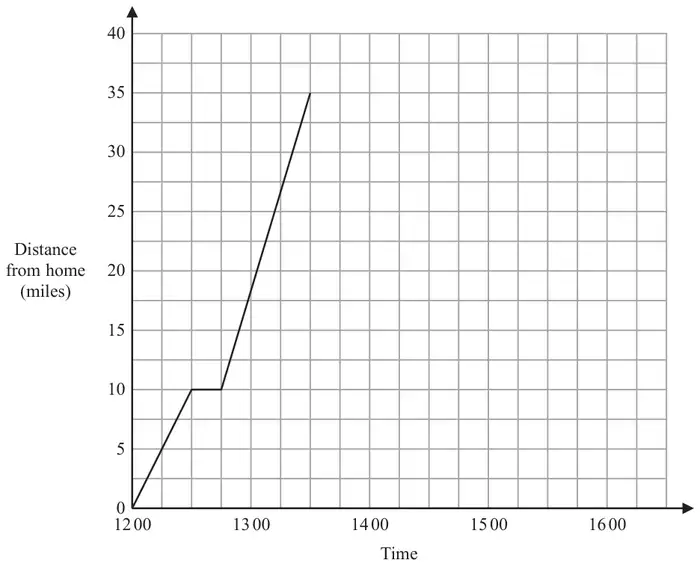
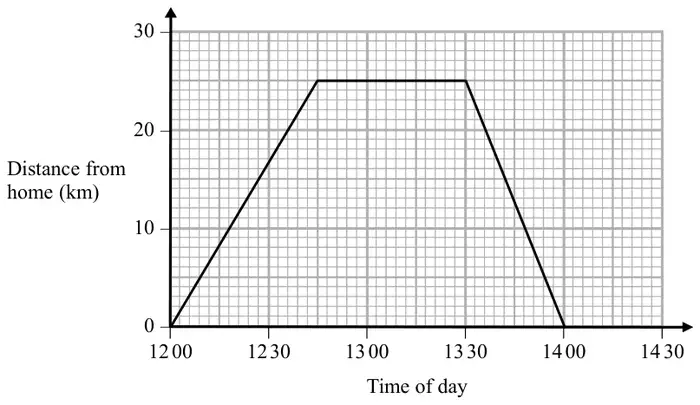
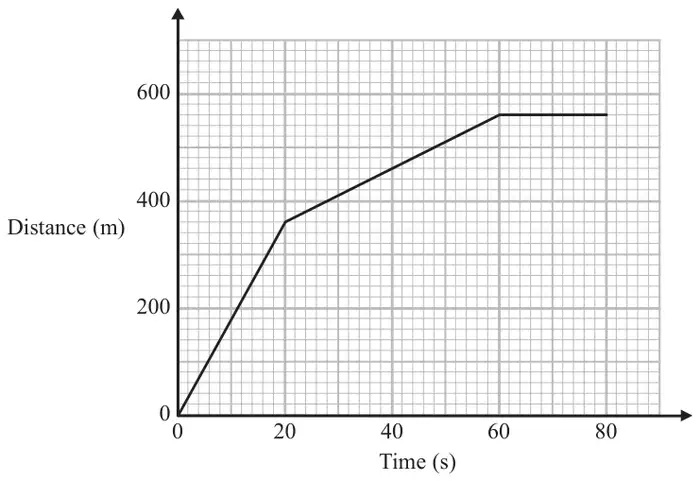
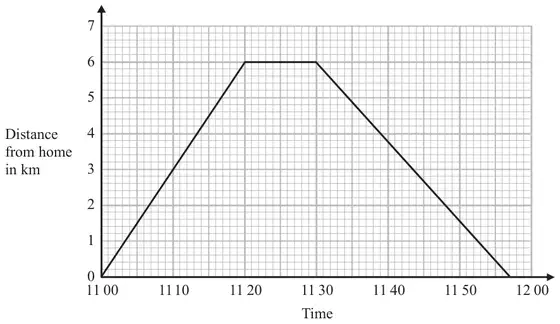
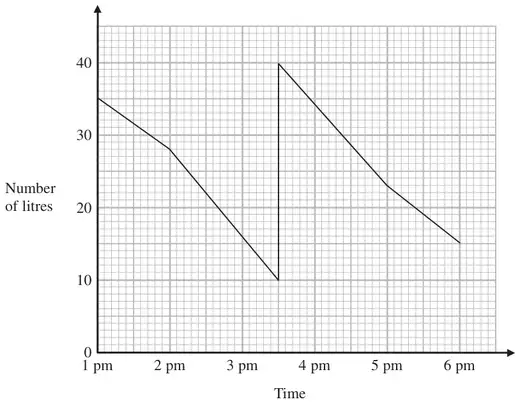
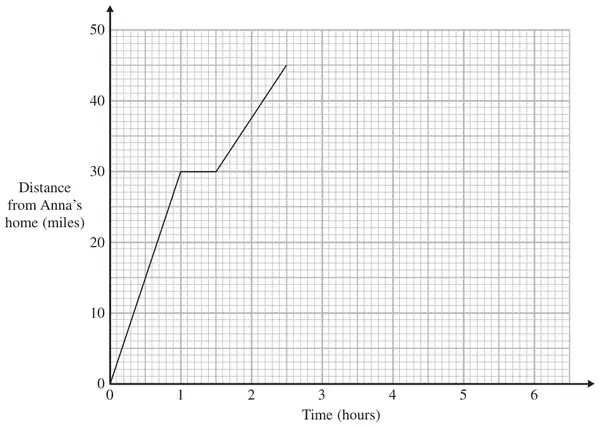
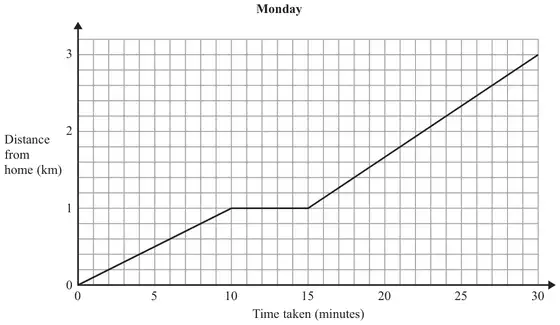
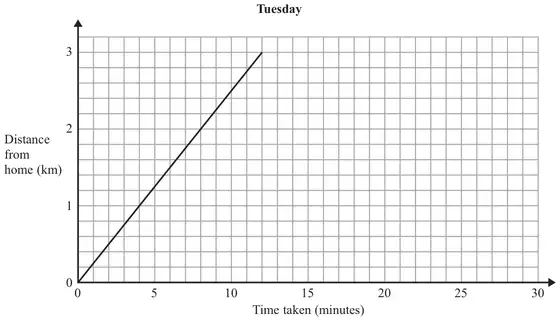
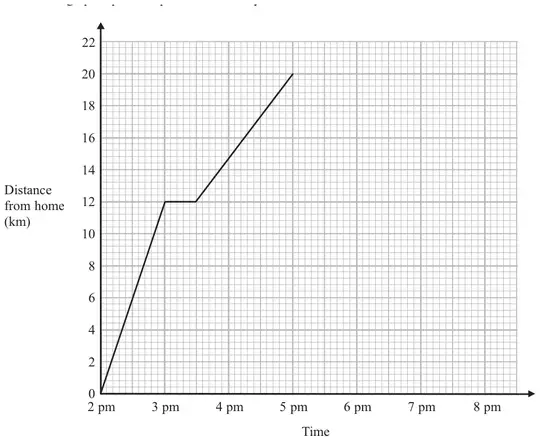
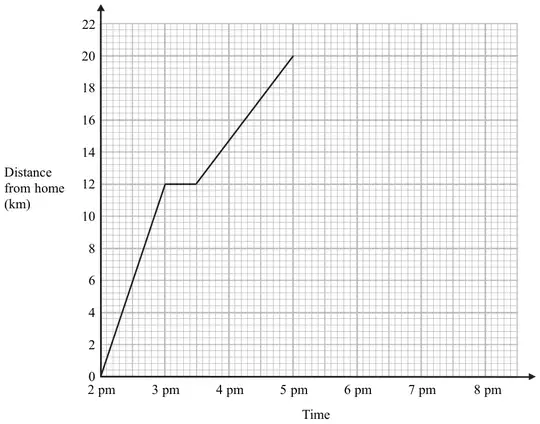
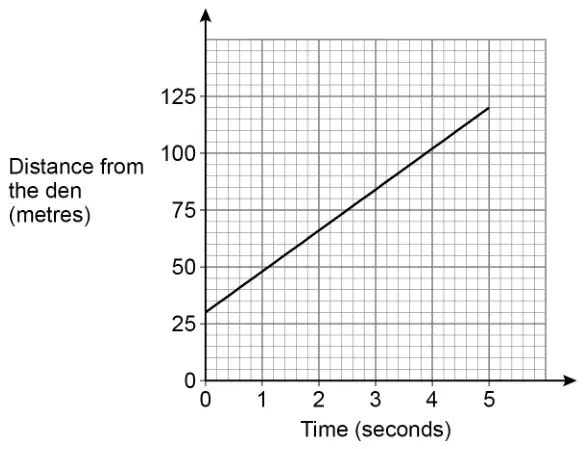
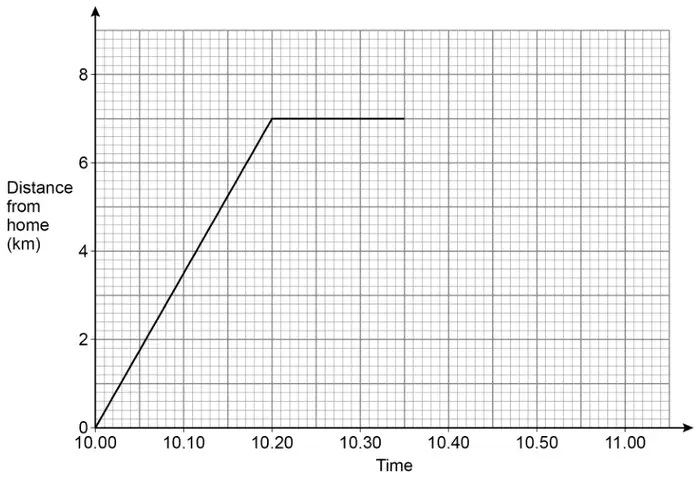
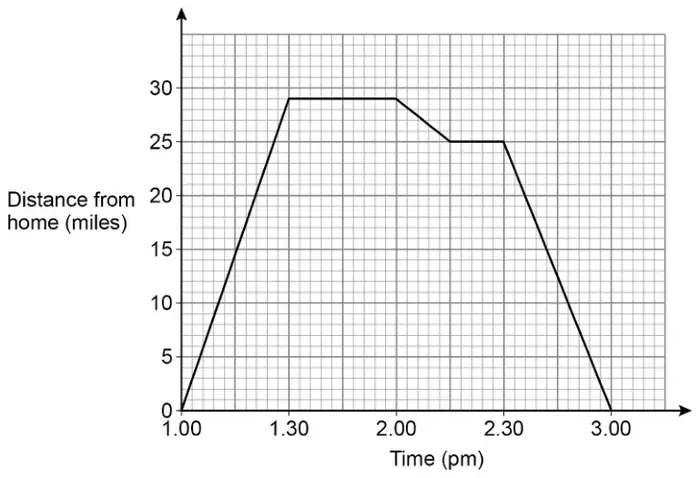
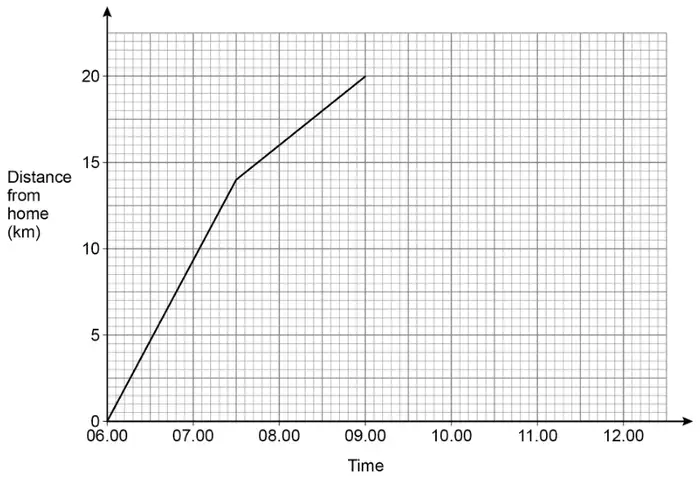
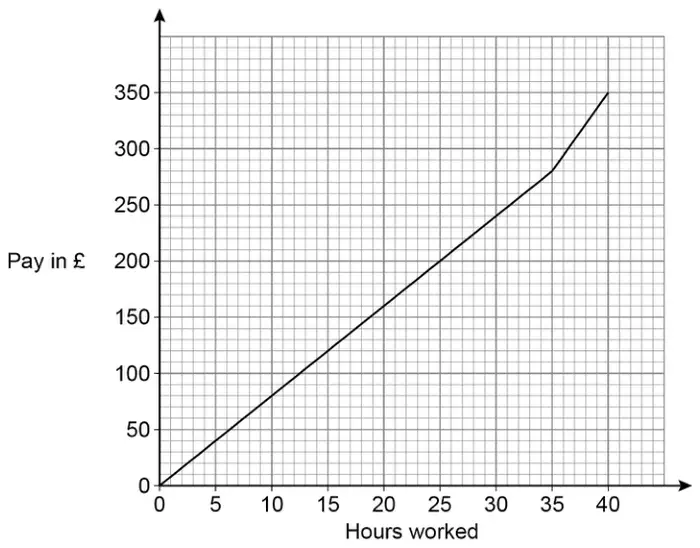
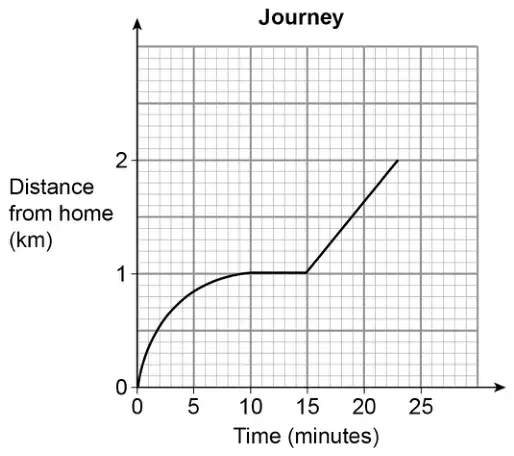
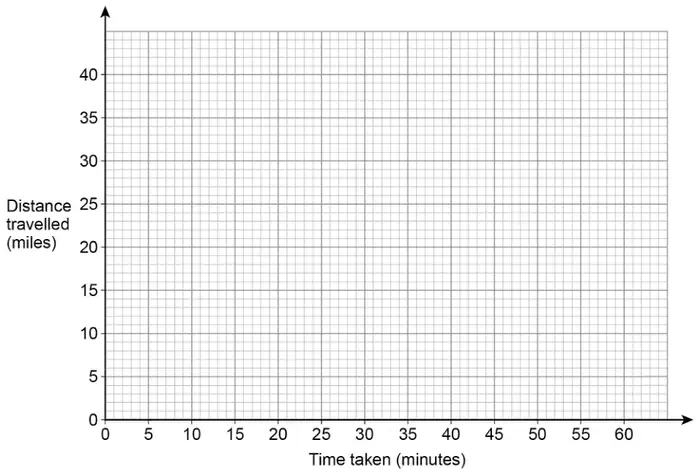
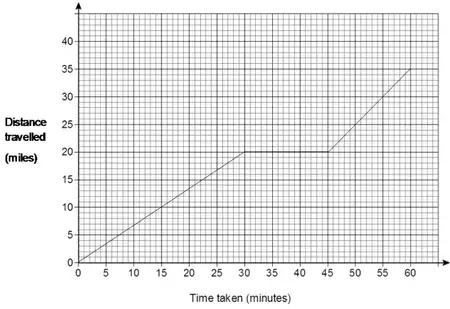
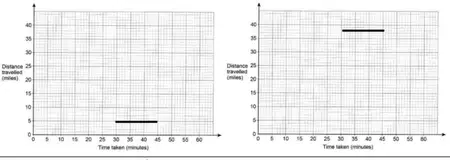
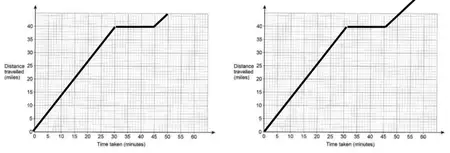
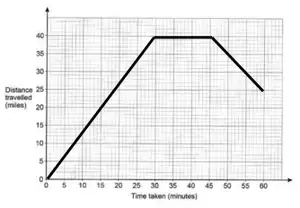
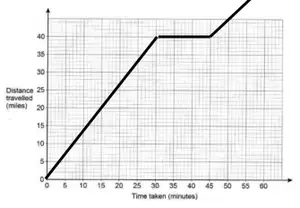
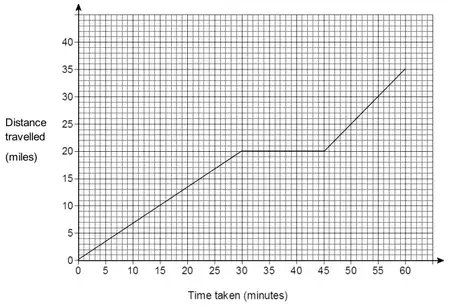
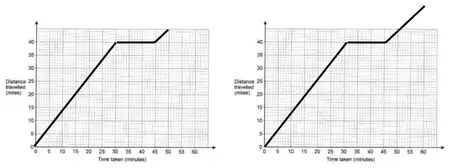
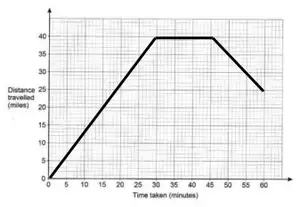
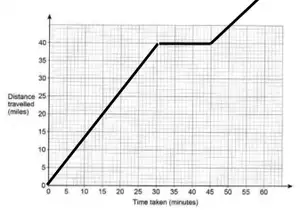
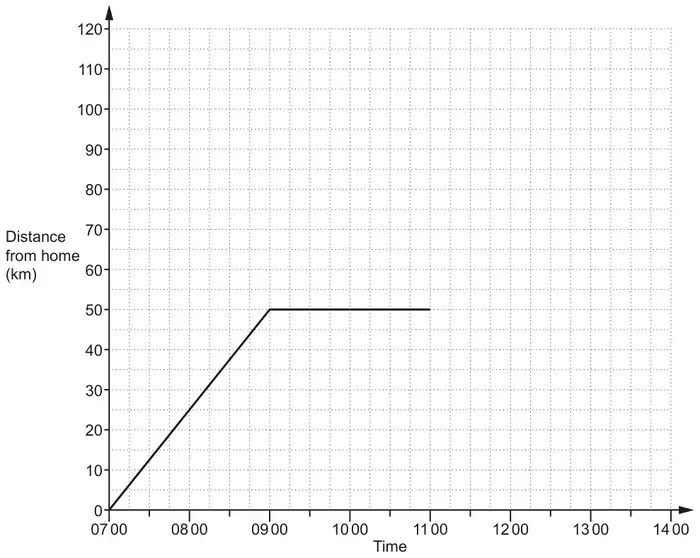
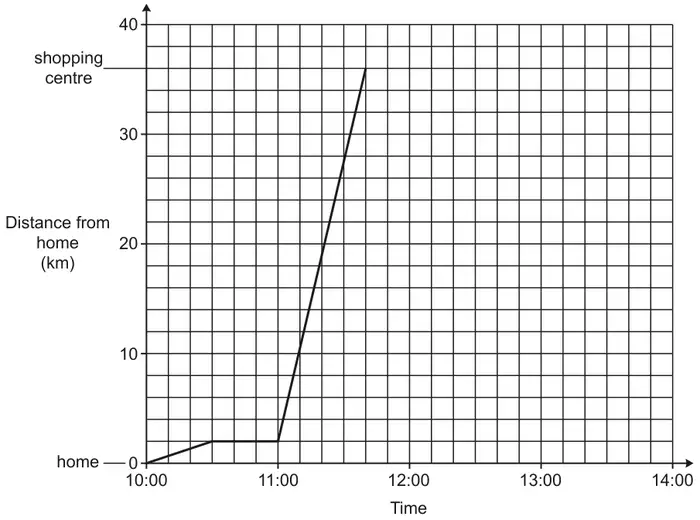
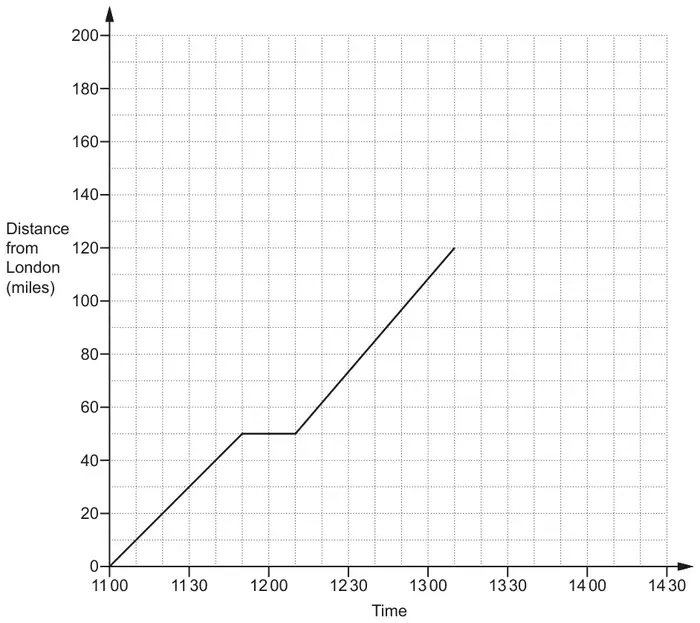
The travel graph shows information about the train’s journey.
(a) Work out the speed of the train. Give your answer in miles per hour. (2)
The train stays at Sheffield for 15 minutes.
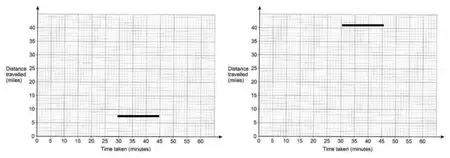
(b) Show this information on the travel graph. (1)
Mark scheme (a)
Answer
Mark
Mark scheme
70
M1
for a method to work with distance \(\div\) time, eg \(35 \div (30 \div 60)\) or \(35 \div 30 \times 60\) or \(35 \times (60 \div 30)\) or \(35 \div 30\ (= 1.16\ldots)\) or [distance] \(\div\) [time]
A1
answer in the range 69.6 to 70.2
Additional guidance
May use other readings from graph for [distance] and [time] but must be accurate
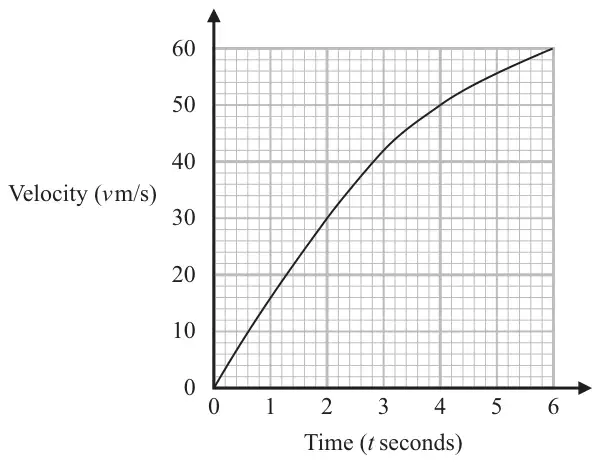
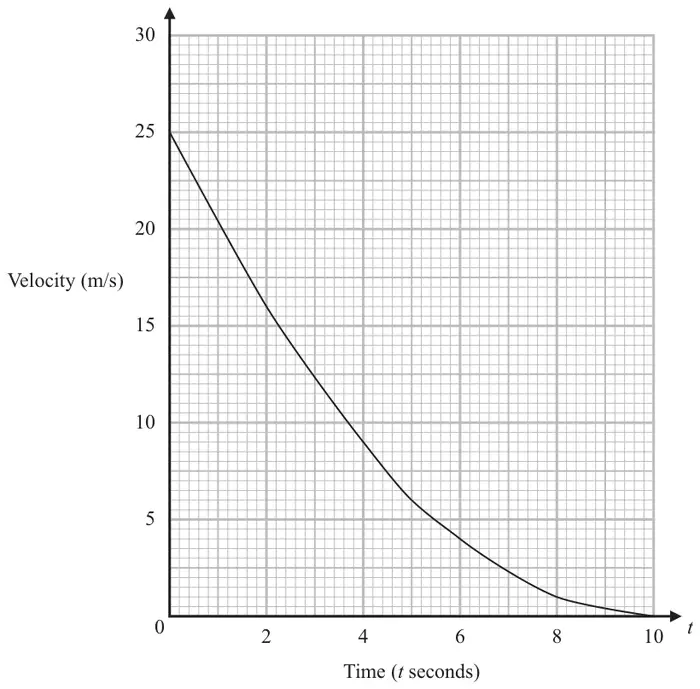
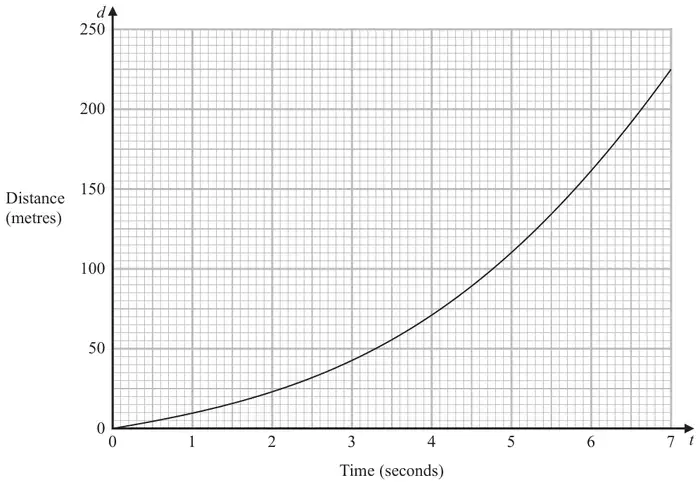
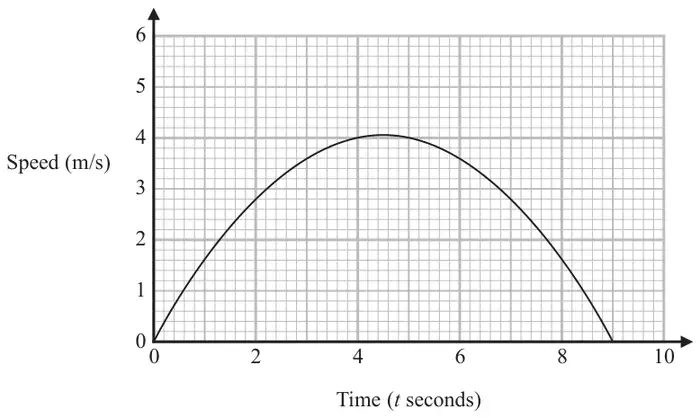
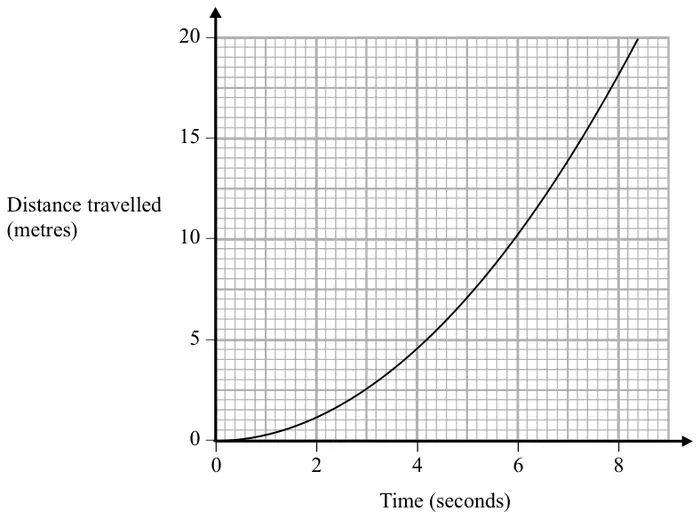
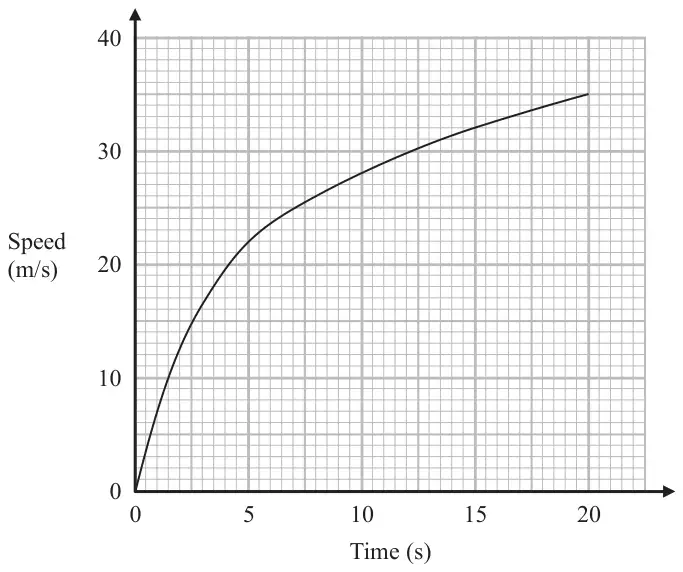
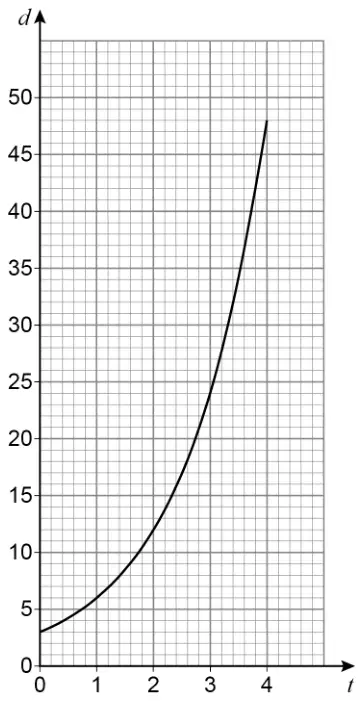
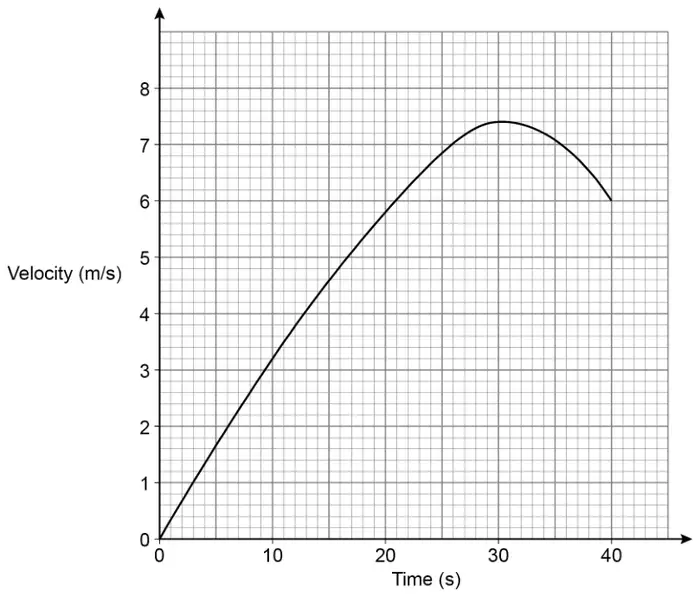
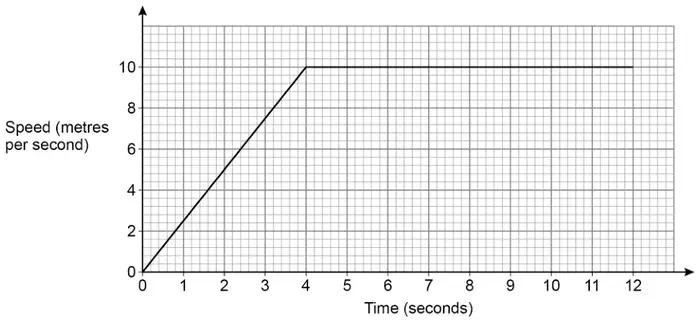
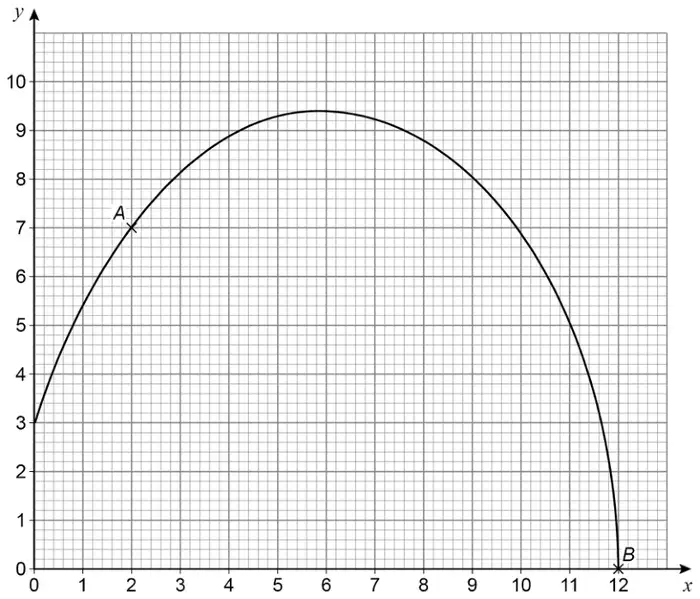
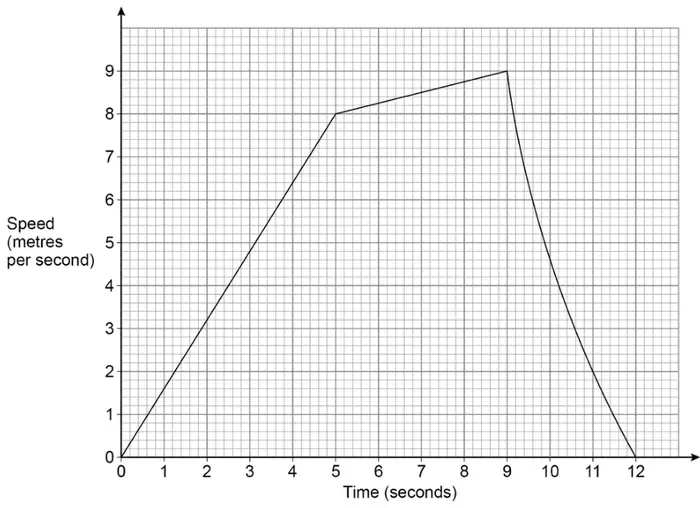
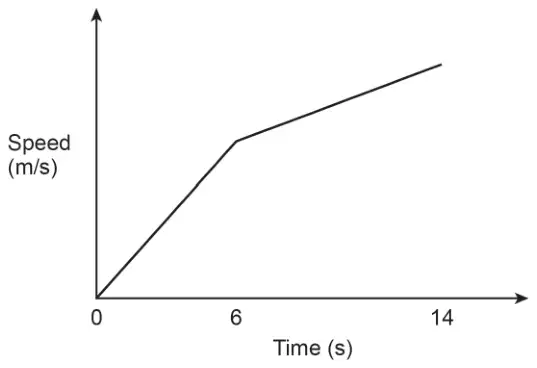
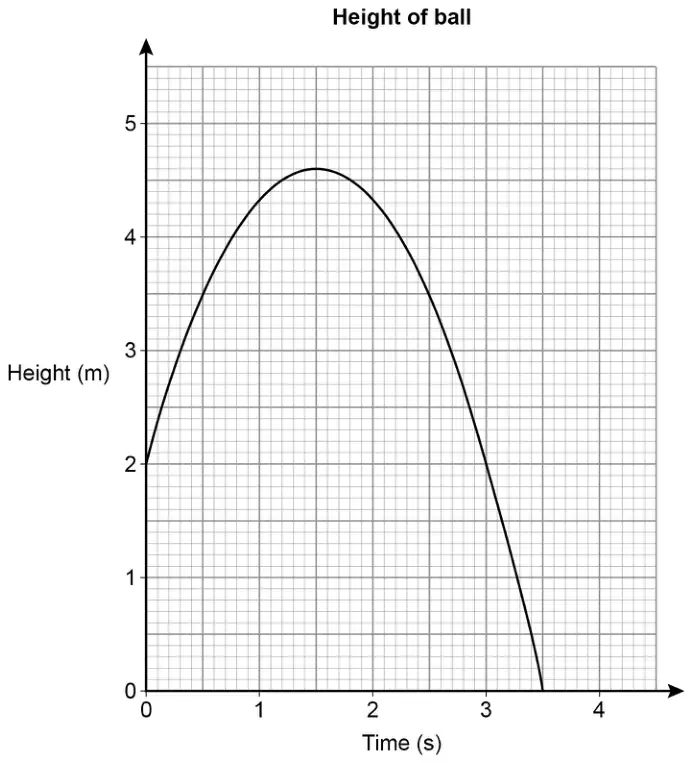
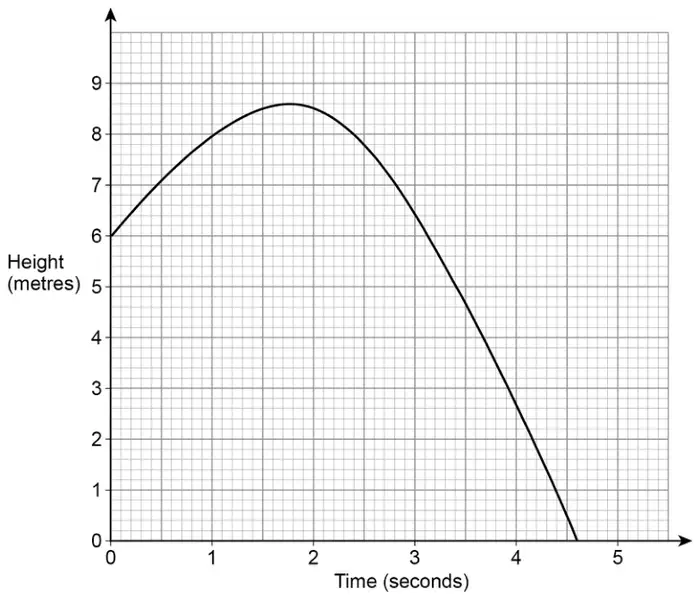
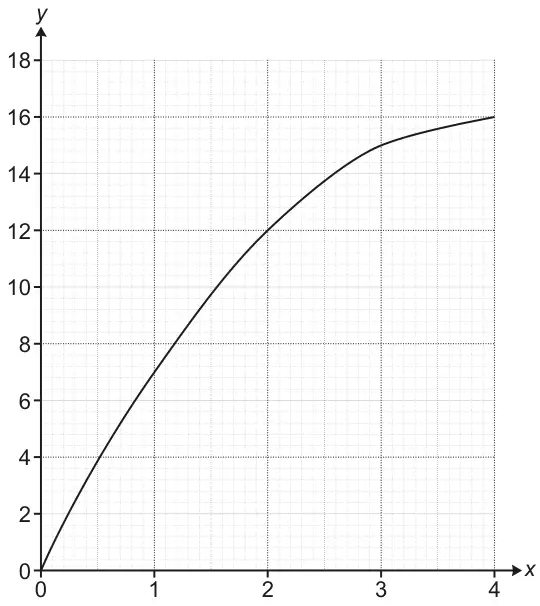
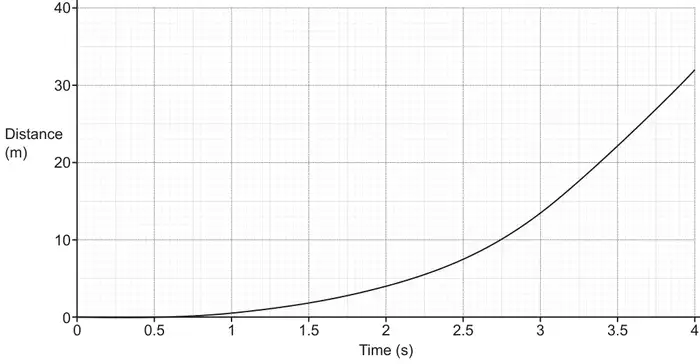
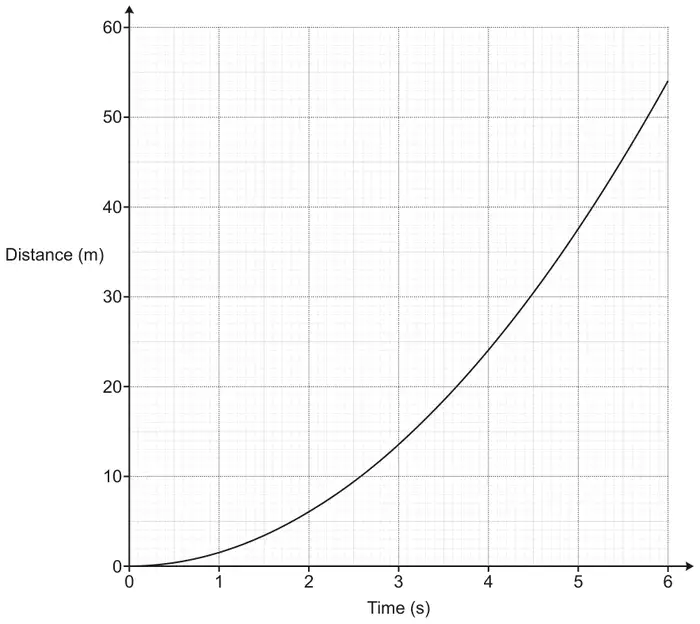
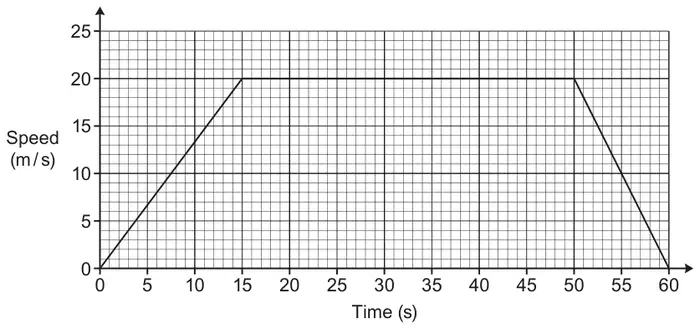
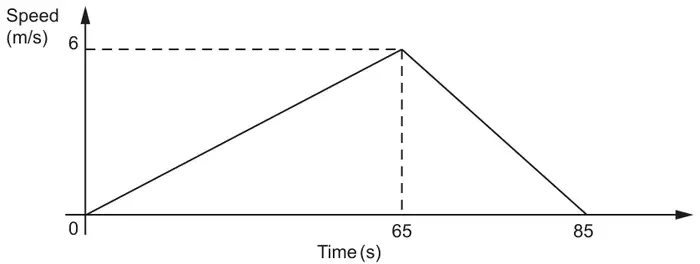
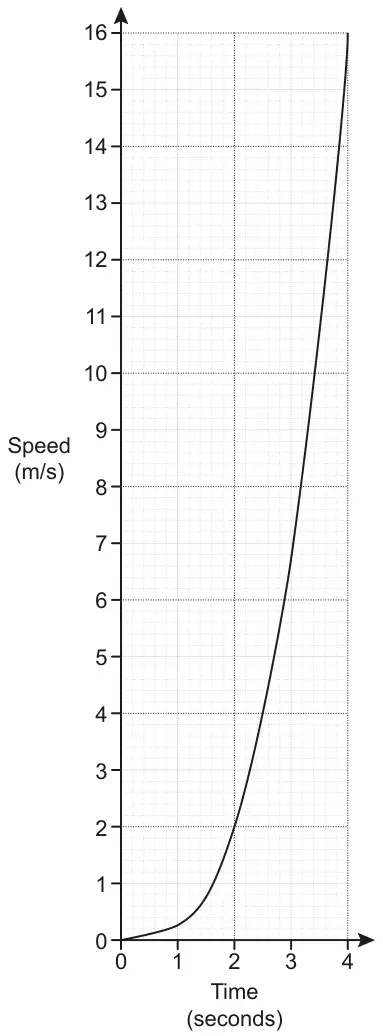
12 The graph shows the velocity, \(v\) m/s, of a particle \(t\) seconds after it starts to move.
(a)
(i) Work out an estimate of the gradient of the graph at \(t = 3\) You must show how you get your answer. (3)
(ii) What does this gradient represent? (1)
(b) Work out an estimate for the distance the particle travelled in the first 6 seconds. Use 3 strips of equal width. (3)
Mark scheme (a)
Answer
Mark
Mark scheme
(i) 10
M1
for a tangent drawn at \(t = 3\)
M1
for a complete method to find the gradient from tangent, eg \(\dfrac{30}{3}\)
A1
for answer in the range 8.5 to 11.5 or ft acceptable tangent at \(t = 3\)
(ii) Acceleration or rate of change of velocity
C1
for a correct explanation
Acceptable examples acceleration rate of change of velocity increase in velocity each second how quickly the velocity increases increase in velocity over time the rate at which the particle is accelerating
Not acceptable examples rate of change increase in velocity the velocity per second velocity ÷ time as time increases so does the velocity how steep the line is the acceleration of the particle and how far it got
Additional guidance
(i) A tangent must be seen to award any marks
This mark can be awarded if the tangent is drawn at \(t \neq 3\)
Accept answers in the form \(\dfrac{a}{b}\) where \(a\) and \(b\) are integers
Award 0 marks for a correct answer (in the range) with no (or incorrect) supportive working
(ii) Award if extra information is given provided not contradictory or incorrect
Accept ‘speed’ for ‘velocity’
Mark scheme (b)
Answer
Mark
Mark scheme
220
M1
for a method to find an appropriate area, eg \(\dfrac{1}{2} \times 30 \times 2\ (= 30)\) oe or \(\dfrac{1}{2}(30 + 50) \times (4 - 2)\ (= 80)\) oe or \(\dfrac{1}{2} \times (50 + 60) \times (6 - 4)\ (= 110)\) oe
or for a method to find an estimate for the area of at least one rectangle with height at intersection of midpoint and curve, eg \(2 \times 16\ (= 32)\) oe or \(2 \times 42\ (= 84)\) oe or \(2 \times 56\ (= 112)\) oe
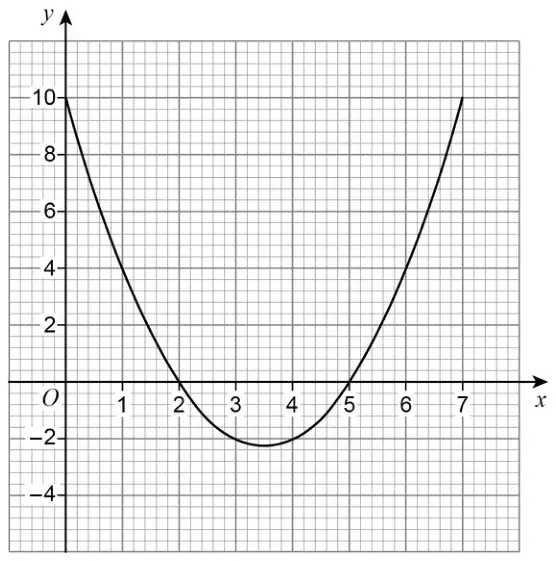
(a) Complete the table of values for \(y = x^2 + x - 4\)
\(x\)
−3
−2
−1
0
1
2
\(y\)
2
−4
(2)
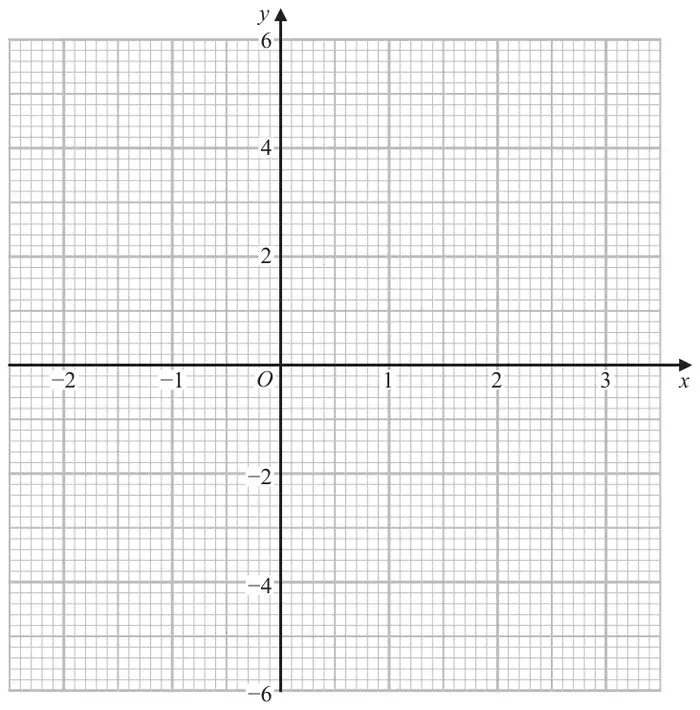
(b) On the grid, draw the graph of \(y = x^2 + x - 4\) for values of \(x\) from \(-3\) to 2(2)
(c) Write down the coordinates of the turning point of the graph of \(y = x^2 + x - 4\) (1)
Mark scheme (a)
Answer
Mark
Mark scheme
\((2), -2, (-4), -4, -2, 2\)
B2
for all 4 values correct
(B1
for 2 or 3 correct values)
Mark scheme (b)
Answer
Mark
Mark scheme
Graph drawn
B2
for a fully correct graph
(B1
ft (dep on B1 in (a)) for plotting at least 5 of the points from their table correctly)
Additional guidance
Accept a freehand curve drawn that is not made of line segments Curve must not have a horizontal segment between \((-1, -4)\) and \((0, -4)\) Ignore anything drawn outside the required range
Mark scheme (c)
Answer
Mark
Mark scheme
\(-0.5, -4.25\)
B1
ft their graph with a single turning point or for \(x\) coordinate \(= -0.5\) and \(y\) coordinate \(= -4.25\) oe
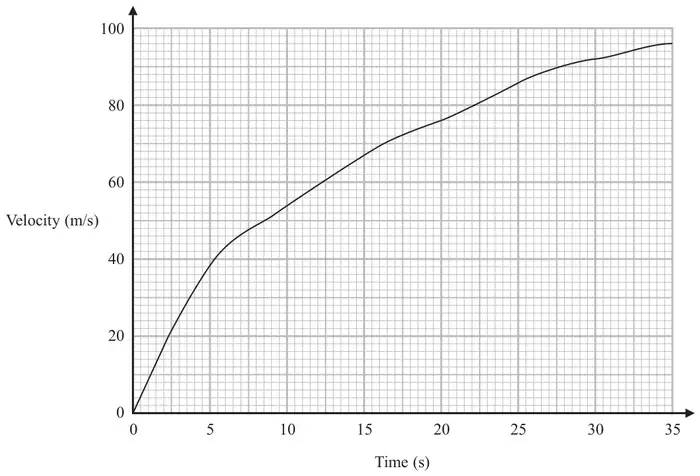
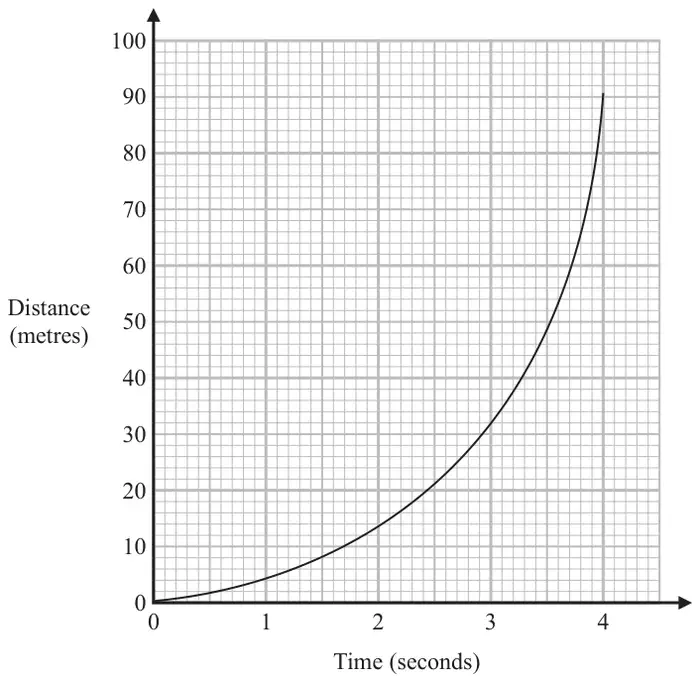
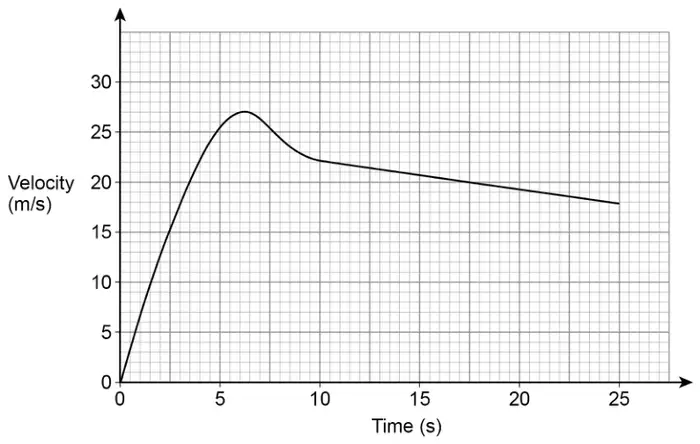
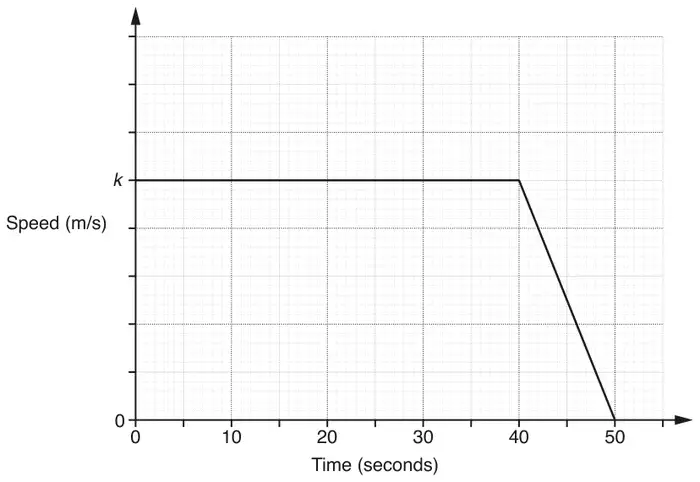
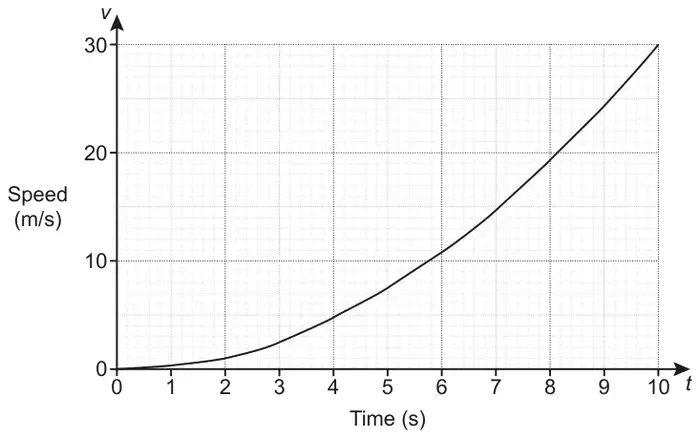
22 Here is a velocity-time graph for an aeroplane.
Work out an estimate for the distance the aeroplane travelled in the first 30 seconds. Use 3 strips of equal width. (3)
Mark scheme
Answer
Mark
Mark scheme
1760
M1
for starting to find the area under the curve, eg \(0.5 \times 10 \times \mathbf{54}\ (= 270)\) oe or \(0.5 \times 10 \times (\mathbf{54} + \mathbf{76})\ (= 650)\) oe or \(0.5 \times 10 \times (\mathbf{76} + \mathbf{92})\ (= 840)\)
or for a method to find an estimate for the area of at least 1 strip with heights at intersection of midpoint and curve eg \(10 \times [\mathbf{39}]\) oe or \(10 \times [\mathbf{67}]\) oe or \(10 \times [\mathbf{86}]\) oe
M1
for a complete method to find the area under the curve, eg \(0.5 \times 10 \times 54 + 0.5 \times 10 \times (54 + 76) + 0.5 \times 10 \times (76 + 92)\) oe eg \(0.5 \times 10\,(92 + 2(54 + 76))\) or \(10 \times [39] + 10 \times [67] + 10 \times [86]\) oe
A1
for 1760 or 1890 to 1950
SCB2 for an answer in the range 1815 – 1855
Additional guidance
Must have one correct expression for the award of this mark May be seen as a rectangle added to a triangle
Where \(38 \leqslant [39] \leqslant 40\) Where \(66 \leqslant [67] \leqslant 68\) Where \(85 \leqslant [86] \leqslant 87\)
Allow 1 error in \(y\) values used
Allow 1890 to 1950 only if it comes from midpoint method
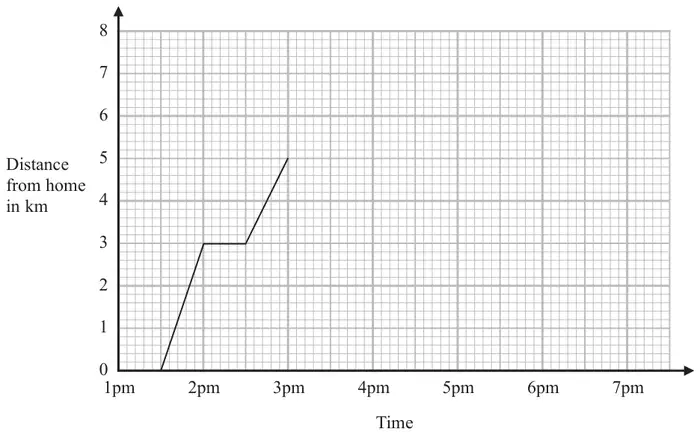
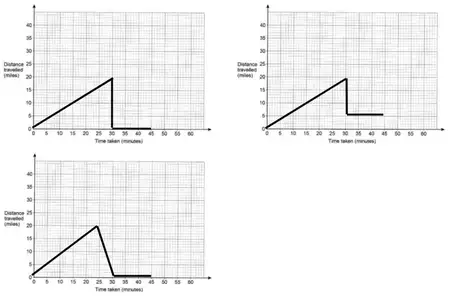
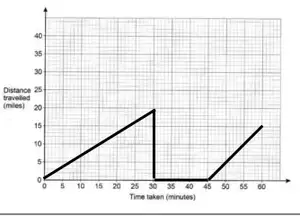
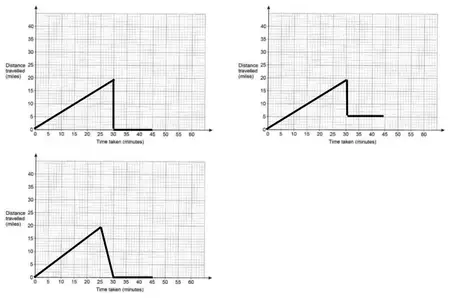
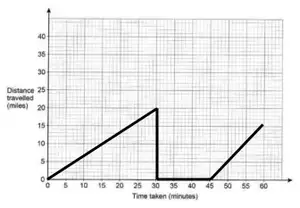
The travel graph of Amy’s walk to the skate park is shown below.
On the way to the skate park Amy stopped at her friend’s house.
(a) How far is it from her friend’s house to the skate park? (1)
Amy stayed at the skate park for 2 hours. Then she walked home at a steady speed. She took 1 hour 30 minutes to walk home.
(b) Complete the travel graph. (2)
Mark scheme (a)
Answer
Mark
Mark scheme
2
B1
cao
Mark scheme (b)
Answer
Mark
Mark scheme
Graph completed
M1
for straight line from (3, 5) to (5, 5) or for a straight line from (5, 5) to (6 30, 0) or line drawn from (3, 5) to (4 30, 0) or a line drawn from (\(x\), 5) to (\(x\) + 1 30, 0) where \(x \geqslant 3\)
A1
cao
Additional guidance
Accept hand drawn, ruler not required but intention clear
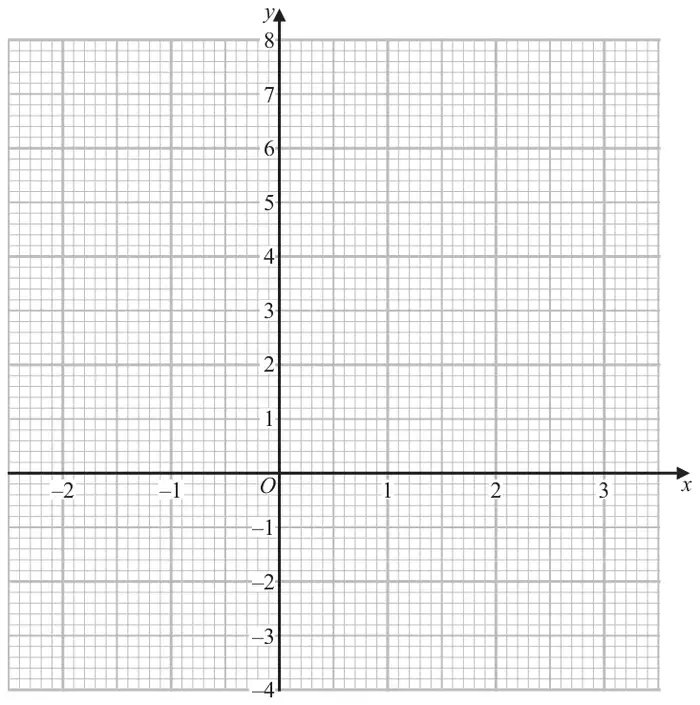
(a) Complete the table of values for \(\ y = x^2 - x\)
\(x\)
\(-2\)
\(-1\)
0
1
2
3
\(y\)
6
0
2
(2)
(b) On the grid, draw the graph of \(\ y = x^2 - x\ \) for values of \(x\) from \(-2\) to 3(2)
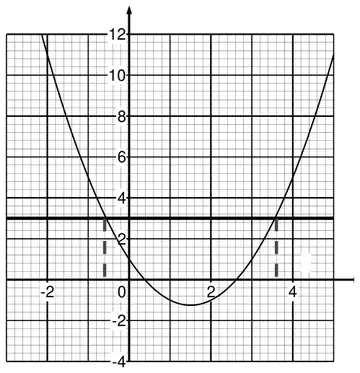
(c) Use your graph to find estimates for the solutions of the equation \(\ x^2 - x = 4\) (2)
Mark scheme (a)
Answer
Mark
Mark scheme
(6) 2 (0) 0 (2) 6
B2
for all 3 values correct
(B1
for 1 or 2 correct values)
Mark scheme (b)
Answer
Mark
Mark scheme
Graph drawn
B2
for a fully correct graph
(B1
ft (dep on B1 in (a)) for plotting at least 5 of the points from their table correctly)
Additional guidance
Accept a freehand curve drawn that is not made of line segments Ignore anything drawn outside the required range
Mark scheme (c)
Answer
Mark
Mark scheme
\(-1.7\) to \(-1.5\) and 2.5 to 2.7
M1
for drawing the line \(y = 4\) or reading off intersections where \(y = 4\) or one correct solution or both solutions given as coordinates, eg \((-1.6, 2.6)\) or \((-1.6, 4)\) and \((2.6, 4)\)
A1
for answers in the range \(-1.7\) to \(-1.5\) and 2.5 to 2.7 or ft their graph with at least 2 solutions
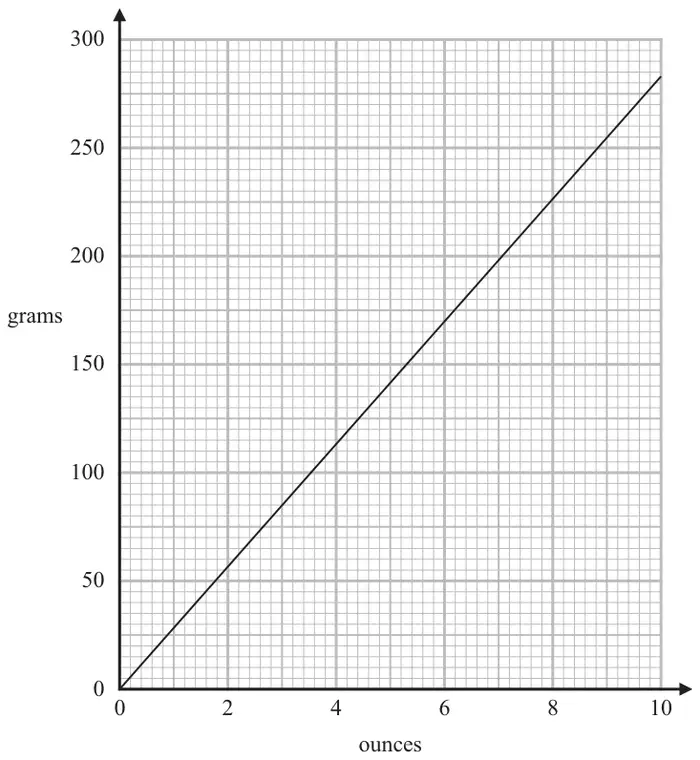
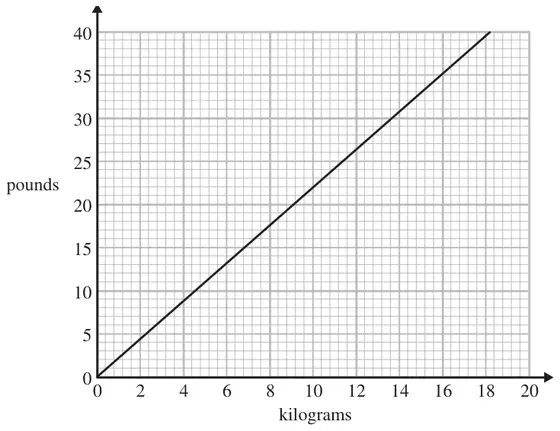
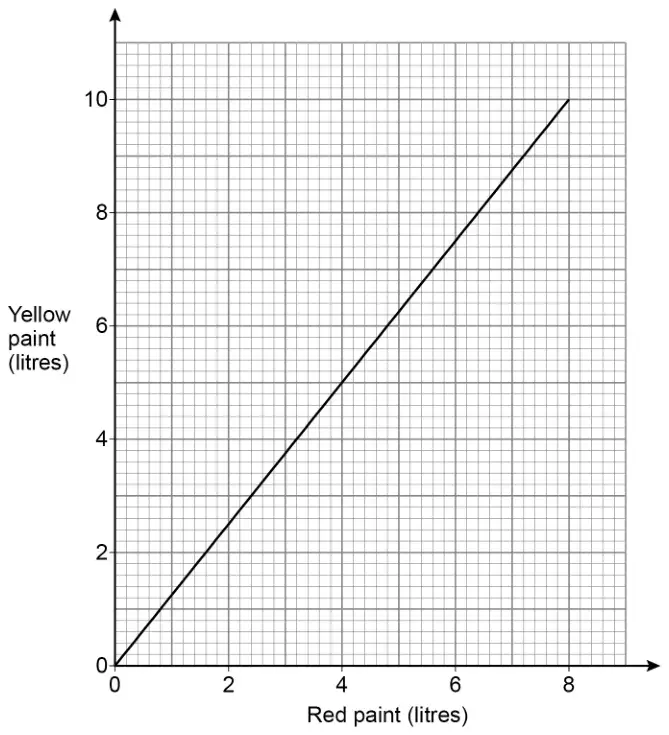
16 You can use this graph to change between ounces and grams.
(a) Change 6 ounces to grams. (1)
(b) Change 1 kg to ounces. (2)
Mark scheme (a)
Answer
Mark
Mark scheme
170
B1
for answer in the range 167 to 173
Mark scheme (b)
Answer
Mark
Mark scheme
35
M1
for correctly using readings from the graph as a factor of 1000 from the grams scale, eg \(200 \times 5\) or \(100 \times 10\) or \(20 \times 50\) or \(250 \times 4\)
or for method to use multiples of grams and corresponding ounces readings, eg \(1000 \div\) “answer to (a)” \(\times\, 6\) or \(1000 \div\) grams \(\times\) ounces oe
A1
for an answer in the range 34 to 36
Additional guidance
May be seen as a build-up method using multiple readings that can be read from the graph but must total 1000 grams
14 The graph shows the velocity of a car, in metres per second, \(t\) seconds after it starts to slow down.
(a) Calculate an estimate for the acceleration of the car when \(t = 5\) You must show all your working. (3)
(b) Work out an estimate for the distance the car travels in the first 6 seconds after it starts to slow down. Use 3 strips of equal width. (3)
Mark scheme (a)
Answer
Mark
Mark scheme
\(-2.5\)
M1
for drawing a tangent at \(t = 5\)
M1
(dep on M1) for a complete method to find the gradient eg tangent at \(t = 5\) and \(\text{``}10\text{''} \div \text{``}4\text{''}\) or an answer in the range 2.0 to 2.8
A1
for answer in the range \(-2.0\) to \(-2.8\) dependent on tangent drawn
Additional guidance
No tangent drawn score 0 marks Working may be seen on the diagram
Accept answers in the form \(\dfrac{a}{b}\) where \(a\) and \(b\) are integers
Mark scheme (b)
Answer
Mark
Mark scheme
79
M1
for a method to find an estimate for the area of at least 1 trapezium under the curve, eg \(\dfrac{1}{2} \times 2 \times (25 + 16)\ (= 41)\) oe or \(\dfrac{1}{2} \times 2 \times (16 + 9)\ (= 25)\) oe or \(\dfrac{1}{2} \times 2 \times (9 + 4)\ (= 13)\) oe or for a method to find an estimate for the area of at least 1 rectangle with heights at intersection of midpoint and curve, eg \(2 \times 20.5\ (= 41)\) oe or \(2 \times 12.5\ (= 25)\) oe or \(2 \times 6\ (= 12)\) oe
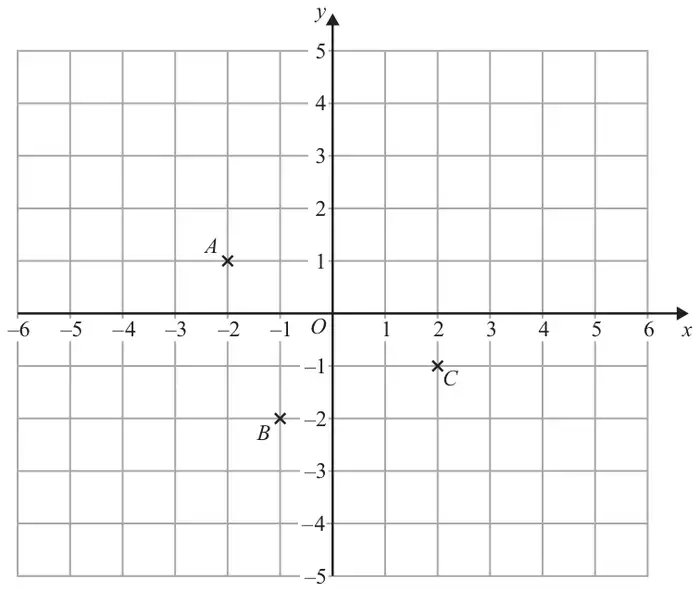
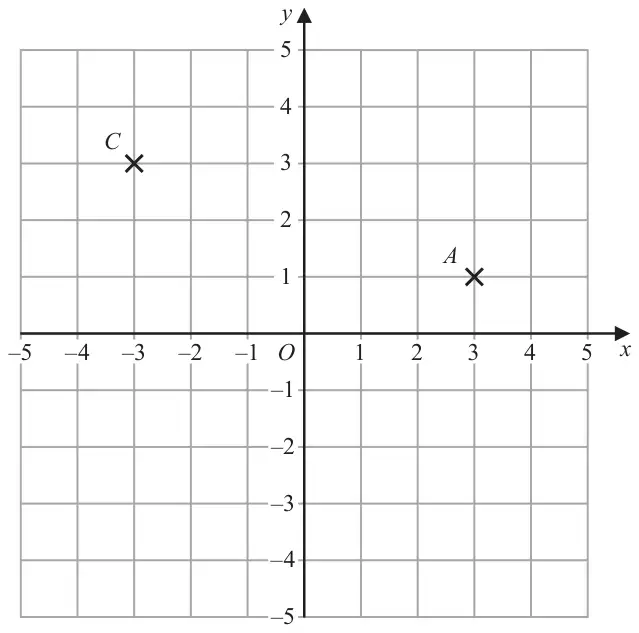
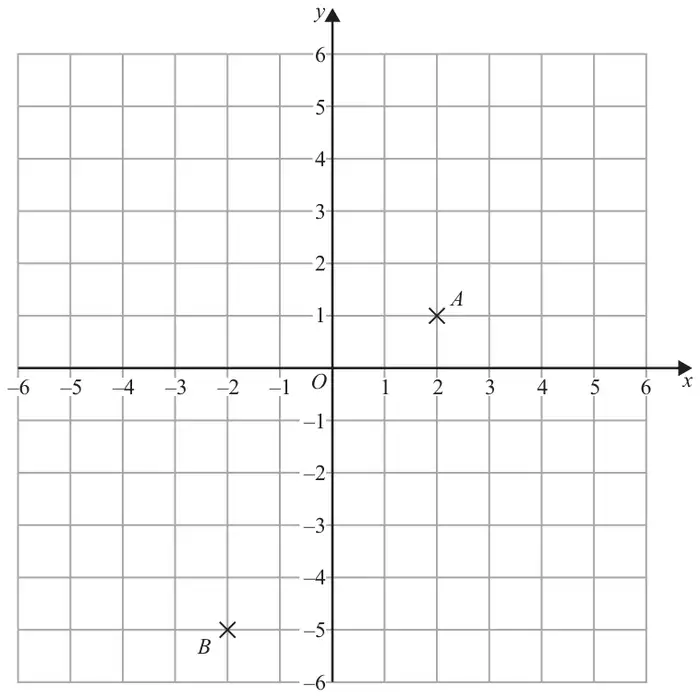
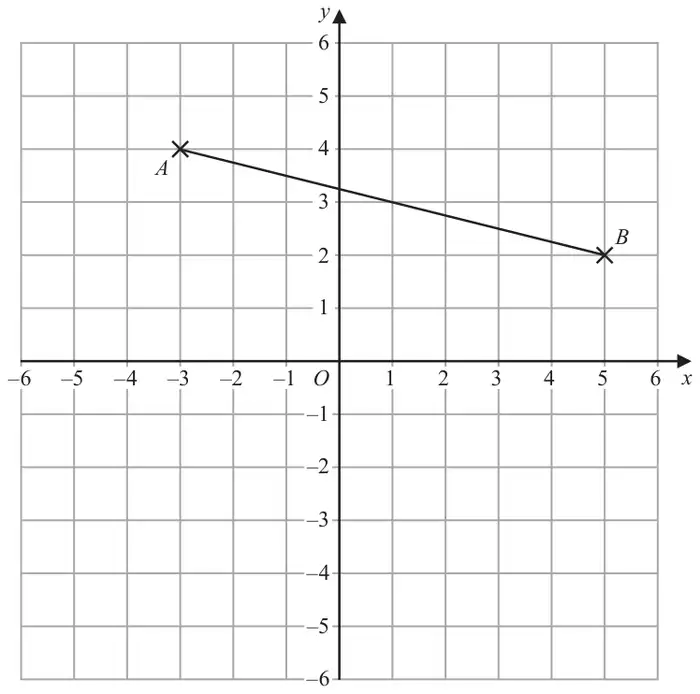
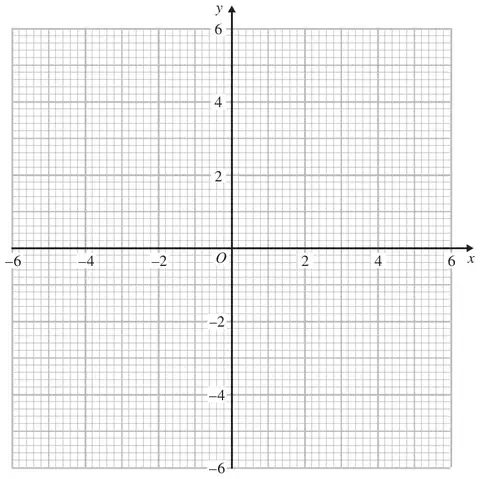
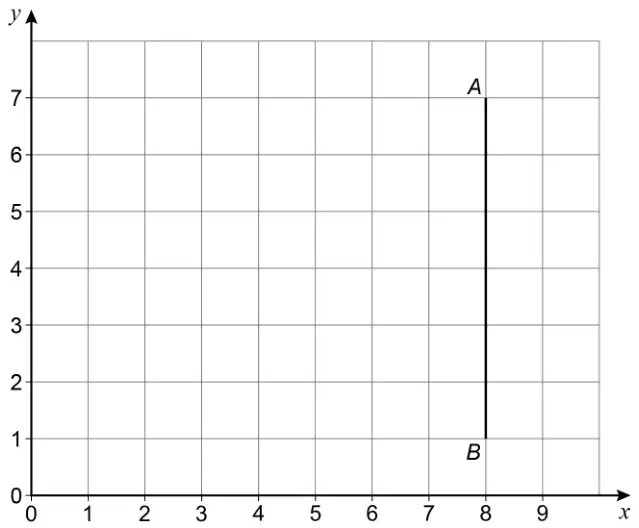
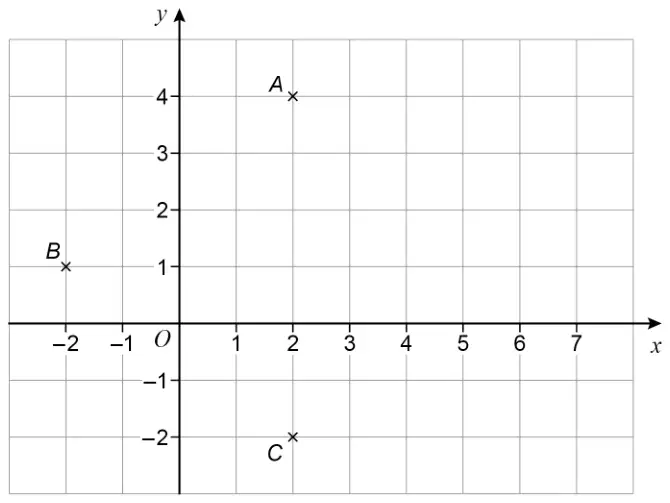
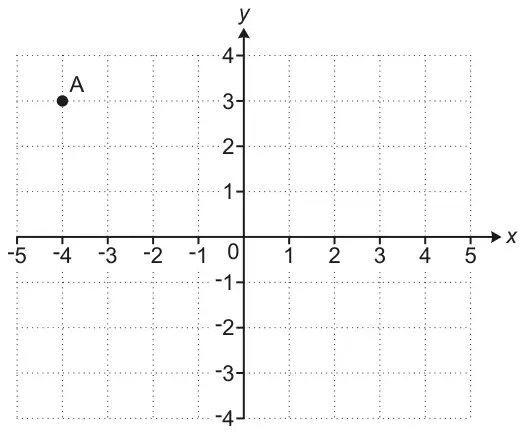
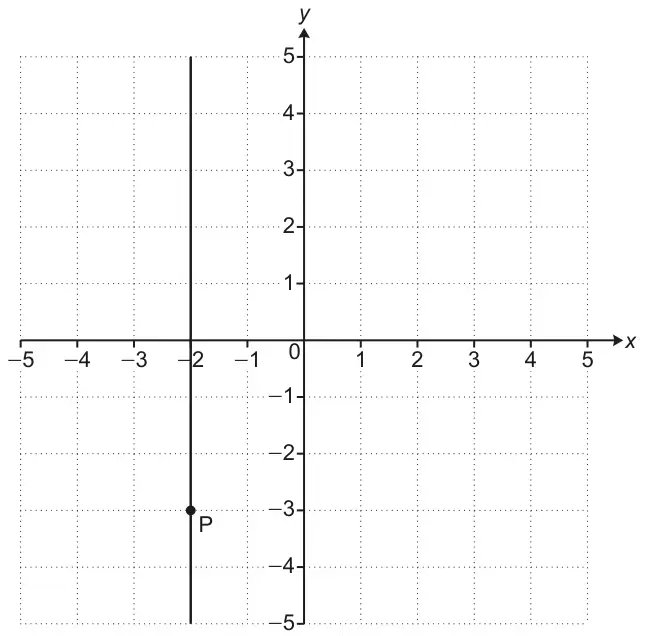
8 The points \(A\) and \(B\) are shown on the grid.
(a) Write down the coordinates of the point \(A\). (1)
(b) Find the coordinates of the midpoint of \(AB\). (2)
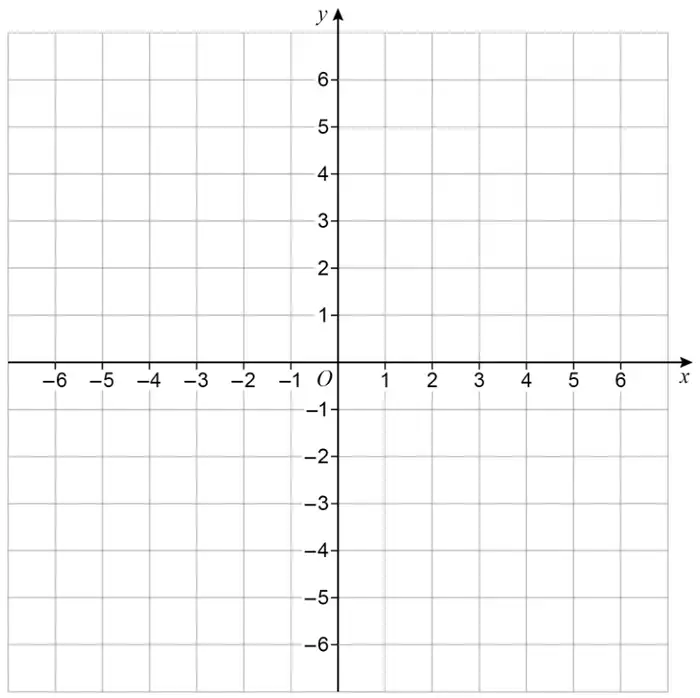
(c) On the grid, mark with a cross (\(\times\)) the point with coordinates \((-4, 2)\) Label this point \(C\). (1)
Mark scheme (a)
Answer
Mark
Mark scheme
2, 1
B1
cao
Mark scheme (b)
Answer
Mark
Mark scheme
\(0, -2\)
M1
for an answer of \((0, y)\) where \(y \ne -2\) or \((x, -2)\) where \(x \ne 0\) or the correct midpoint identified on the grid or \((2 + -2) \div 2\) or \((1 + -5) \div 2\)
(a) Complete the table of values for \(y = x^2 - x\)
\(x\)
\(-2\)
\(-1\)
0
1
2
3
\(y\)
6
0
2
(2)
(b) On the grid, draw the graph of \(y = x^2 - x\) for values of \(x\) from \(-2\) to 3(2)
(c) Use your graph to find estimates for the solutions of the equation \(x^2 - x = 4\) (2)
Mark scheme (a)
Answer
Mark
Mark scheme
(6) 2 (0) 0 (2) 6
B2
for all 3 values correct
(B1
for 1 or 2 correct values)
Mark scheme (b)
Answer
Mark
Mark scheme
Graph drawn
B2
for a fully correct graph
(B1
ft (dep on B1 in (a)) for plotting at least 5 of the points from their table correctly)
Additional guidance
Accept a freehand curve drawn that is not made of line segments Ignore anything drawn outside the required range
Mark scheme (c)
Answer
Mark
Mark scheme
\(-1.7\) to \(-1.5\) and 2.5 to 2.7
M1
for drawing the line \(y = 4\) or reading off intersections where \(y = 4\) or one correct solution or both solutions given as coordinates, eg \((-1.6, 2.6)\) or \((-1.6, 4)\) and \((2.6, 4)\)
A1
for answers in the range \(-1.7\) to \(-1.5\) and 2.5 to 2.7 or ft their graph with at least 2 solutions
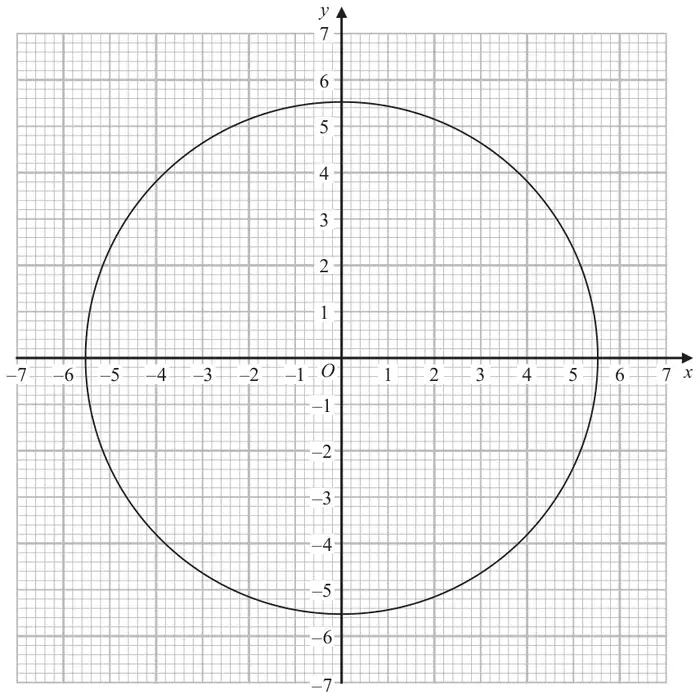
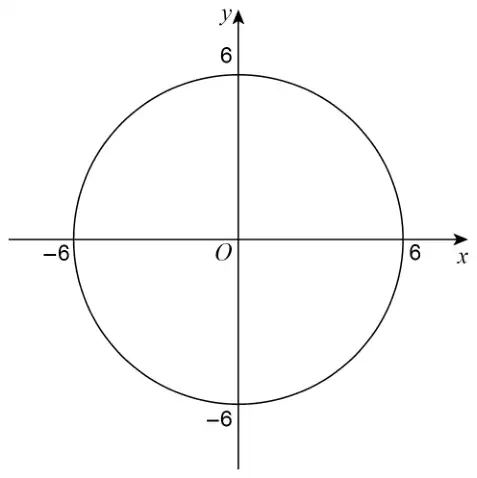
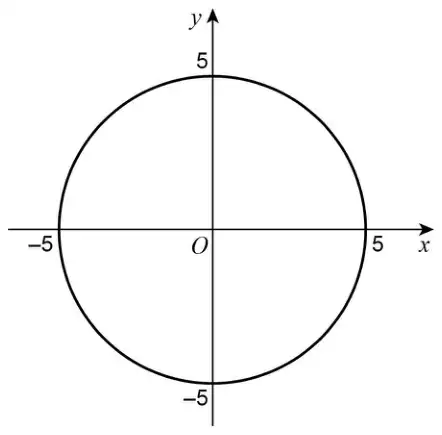
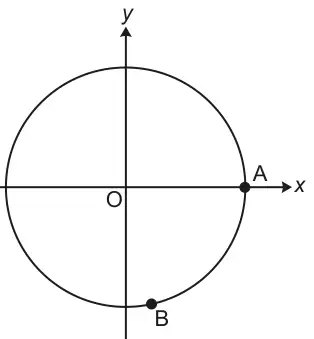
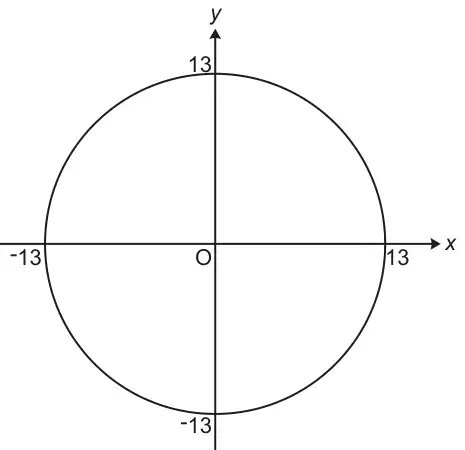
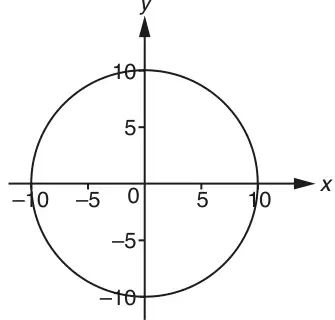
(a) On the grid, draw the graph of \(x^2 + y^2 = 169\)(2)
(b) Use your graph to find estimates for the solutions of the simultaneous equations\[\begin{gathered} x^2 + y^2 = 169 \\ 2y = 3x \end{gathered}\] (3)
Mark scheme (a)
Answer
Mark
Mark scheme
Circle drawn
B2
for drawing a circle centre \((0,0)\) and radius 13
(B1
for drawing a circle centre \((0,0)\) with radius \(\neq 13\) or a circle of radius 13 with a centre not \((0,0)\) or an incomplete correct circle drawn)
Additional guidance
Circle could be drawn freehand as long as it closely approximates to a circle
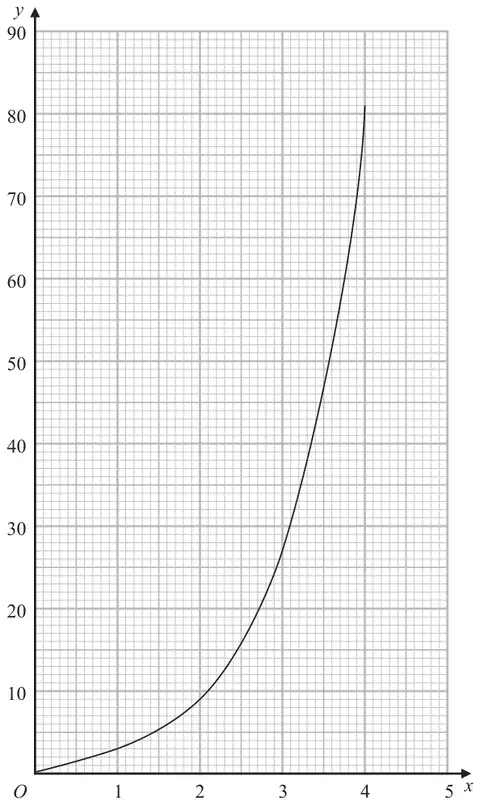
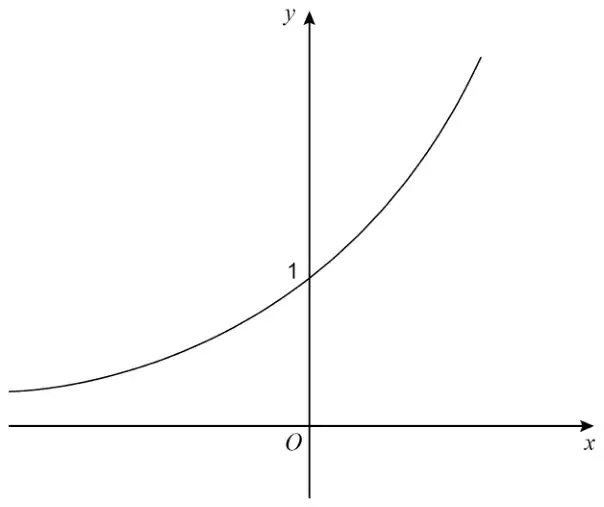
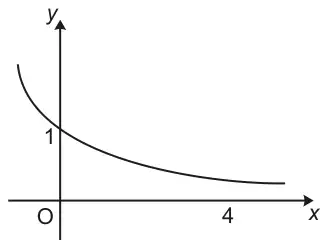
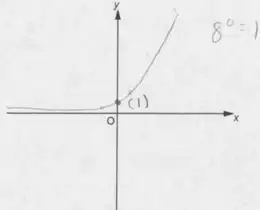
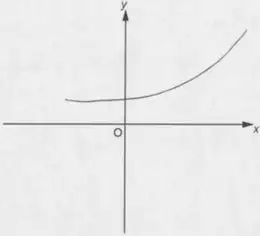
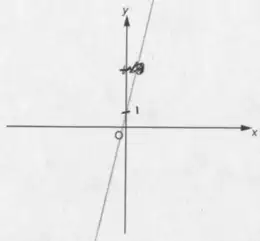
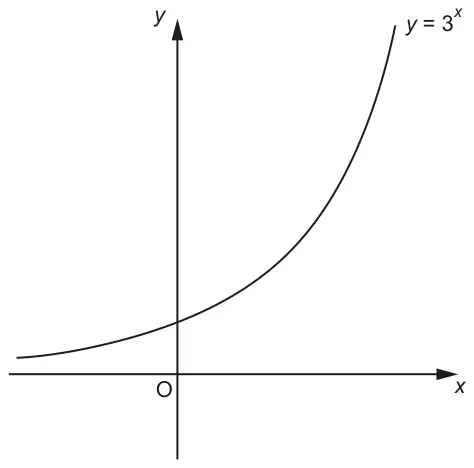
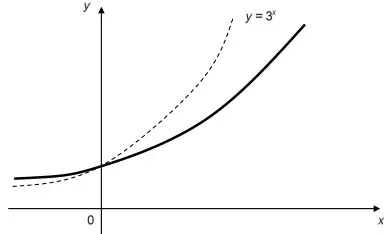
19 Sana needs to draw the graph of \(y = 3^x\) for \(0 \leqslant x \leqslant 4\)
She draws the graph shown on the grid.
Write down one thing Sana has done wrong. (1)
Mark scheme
Answer
Mark
Mark scheme
Statement
C1
for explanation Acceptable examples should go through (0, 1) should not go through (0, 0) it has touched the \(x\)-axis \(3^0 = 1\) \(3^0 \neq 0\) Not acceptable examples the graph has been drawn wrong axes are not labelled
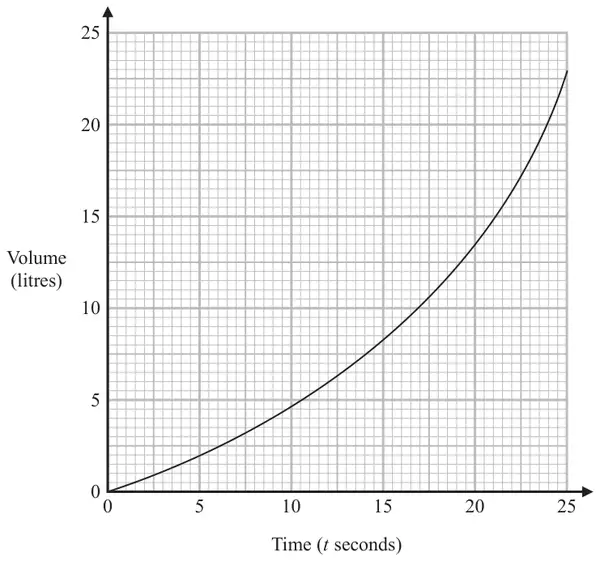
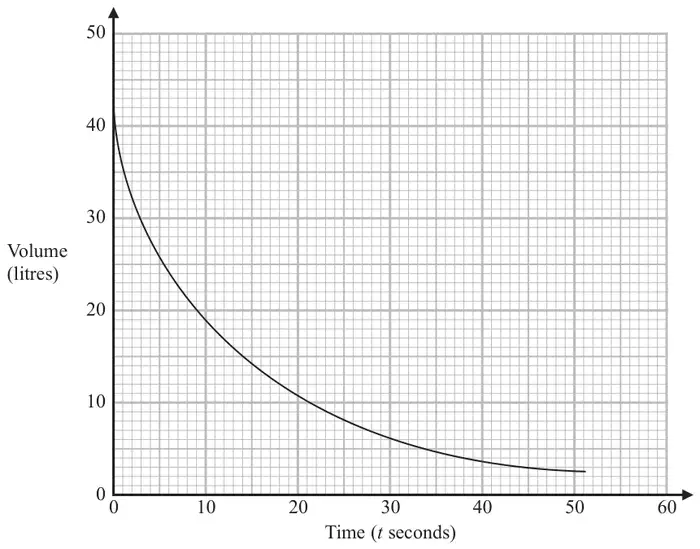
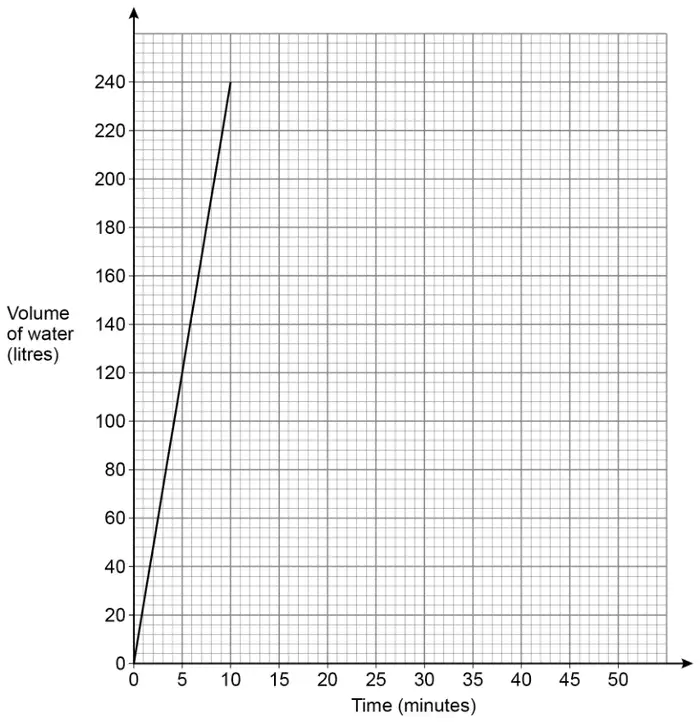
21 The graph below gives the volume, in litres, of water in a container \(t\) seconds after the water starts to fill the container.
(a) Calculate an estimate for the gradient of the graph when \(t = 17.5\) You must show how you get your answer. (3)
(b) Describe fully what the gradient in part (a) represents. (1)
Mark scheme (a)
Answer
Mark
Mark scheme
1.06
M1
for tangent drawn at \(t = 17.5\)
M1
for a complete method to find the gradient eg tangent drawn at \(t = 17.5\), and \(18.5 \div 17.5\)
A1
answer in the range 0.9 to 1.2
Additional guidance
No tangent drawn at \(t=17.5\) scores zero marks
Use of change in \(y\) over change in \(x\). Working may be seen on the diagram Answer of \(\dfrac{10.5}{17.5}\) oe scores no marks. Accept answers in the form \(\dfrac{a}{b}\) where \(a\) and \(b\) are integers
Mark scheme (b)
Answer
Mark
Mark scheme
Explanation
C1
suitable explanation, eg the rate of change of volume
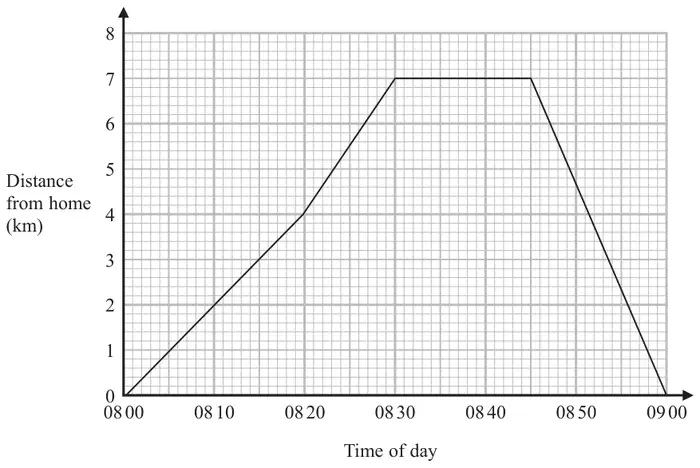
19 Carly cycles to her friend’s house. She stays at her friend’s house for a number of minutes. Then she cycles home.
Here is the travel graph for her journey.
(a) For how many minutes did Carly stay at her friend’s house? (1)
(b) How far is Carly from her home at 08 50? (1)
(c) Work out Carly’s speed, in km/h, for the first 20 minutes of her journey. (2)
Mark scheme (a)
Answer
Mark
Mark scheme
15
B1
cao
Mark scheme (b)
Answer
Mark
Mark scheme
4.6
B1
for an answer in the range 4.4 to 4.8
Mark scheme (c)
Answer
Mark
Mark scheme
12
M1
for a method to calculate speed eg distance ÷ time (could be implied from figures used) eg \(4 \div 20\ (= 0.2)\) oe, \(4 \div 0.33(...)\) oe or \(4 \div \tfrac{1}{3}\) oe
A1
cao
Additional guidance
Accept readings from the graph as an indication at this stage
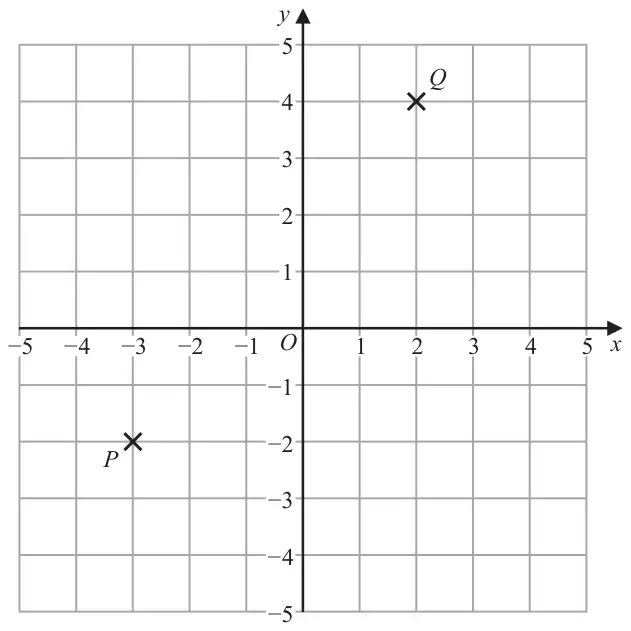
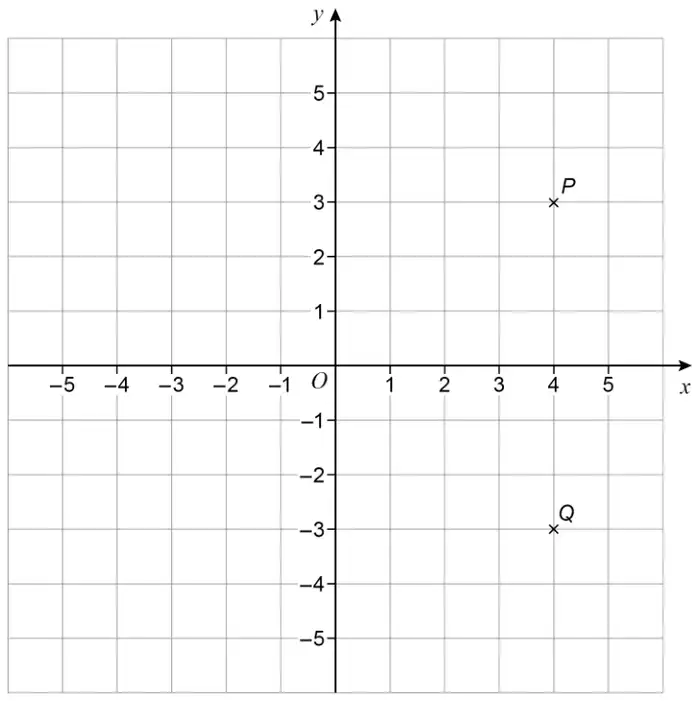
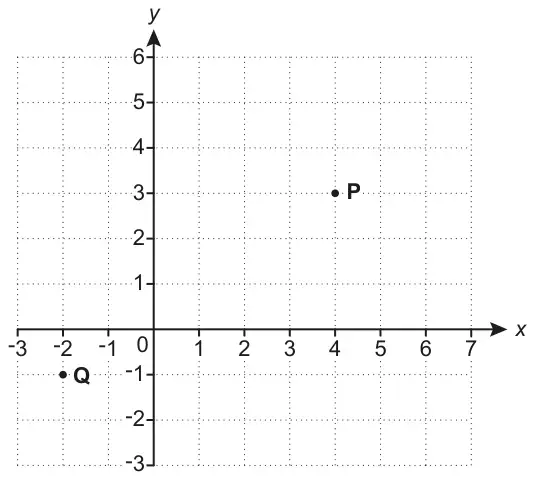
Find the coordinates of the midpoint of \(PQ\). (2)
Mark scheme
Answer
Mark
Mark scheme
\(-0.5, 1\)
M1
for one correct coordinate or midpoint shown on diagram or correct method, eg \(\dfrac{-3+2}{2}\) or \(\dfrac{-2+4}{2}\) or for the coordinates reversed, eg \(1, -0.5\)
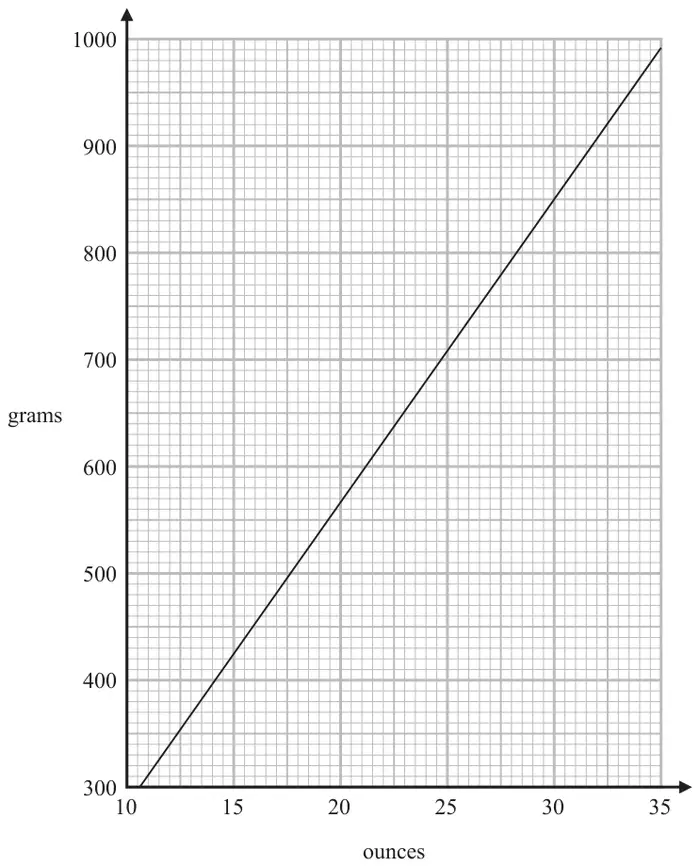
14 You can use this graph to change between ounces and grams.
(a) Change 850 grams to ounces. (1)
(b) Change 80 ounces to grams. (2)
Mark scheme (a)
Answer
Mark
Mark scheme
30
B1
cao
Mark scheme (b)
Answer
Mark
Mark scheme
2238 to 2296
M1
for a complete method eg attempts to read from the graph at a factor of 80 and scales up to 80 using a correct scale or attempts to read from the graph using numbers that sum to 80 and finds the sum of their readings or attempts to read from the graph a number that they then go on to scale up to 80 using a correct scaling factor
A1
for an answer in the range 2238 to 2296
Additional guidance
Condone some inaccuracy in reading from the graph, which should be given to within the nearest 50g
(a) Complete the table of values for \(y = x^2 - 3x + 1\)
\(x\)
\(-1\)
0
1
2
3
4
\(y\)
1
\(-1\)
(2)
(b) On the grid, draw the graph of \(y = x^2 - 3x + 1\) for values of \(x\) from \(-1\) to 4(2)
(c) Using your graph, find estimates for the solutions of the equation \(x^2 - 3x + 1 = 0\) (2)
Mark scheme (a)
Answer
Mark
Mark scheme
\(5, (1), (-1), -1, 1, 5\)
B2
for all 4 values correct
(B1
for 2 or 3 correct values)
Mark scheme (b)
Answer
Mark
Mark scheme
Graph drawn
B2
for a fully correct graph
(B1
ft (dep on B1 in (a)) for plotting at least 5 of the points from their table correctly)
Additional guidance
Accept a freehand graph drawn that is not made of line segments Ignore anything drawn outside the required range
Mark scheme (c)
Answer
Mark
Mark scheme
0.3 to 0.5 and 2.5 to 2.7
M1
for a correct method, eg marking intercepts with \(x\)-axis or one correct solution or both solutions given as a coordinates, eg (0.4, 2.6) or (0.4, 0) and (2.6, 0)
A1
for answers in the range 0.3 to 0.5 and 2.5 to 2.7 or ft their graph with at least 2 solutions
(a) Complete the table of values for \(y = x^2 - 3x + 1\)
\(x\)
−1
0
1
2
3
4
\(y\)
1
−1
(2)
(b) On the grid, draw the graph of \(y = x^2 - 3x + 1\) for values of \(x\) from \(-1\) to 4(2)
(c) Using your graph, find estimates for the solutions of the equation \(x^2 - 3x + 1 = 0\) (2)
Mark scheme (a)
Answer
Mark
Mark scheme
\(5, (1), (-1), -1, 1, 5\)
B2
for all 4 values correct
(B1
for 2 or 3 correct values)
Mark scheme (b)
Answer
Mark
Mark scheme
Graph drawn
B2
for a fully correct graph
(B1
ft (dep on B1 in (a)) for plotting at least 5 of the points from their table correctly)
Additional guidance
Accept a freehand curve drawn that is not made of line segments
Ignore anything drawn outside the required range
Mark scheme (c)
Answer
Mark
Mark scheme
0.3 to 0.5 and 2.5 to 2.7
M1
for a correct method, eg marking intercepts with \(x\)-axis or one correct solution or both solutions given as a coordinates, eg \((0.4, 2.6)\) or \((0.4, 0)\) and \((2.6, 0)\)
A1
for answers in the range 0.3 to 0.5 and 2.5 to 2.7 or ft their graph with at least 2 solutions
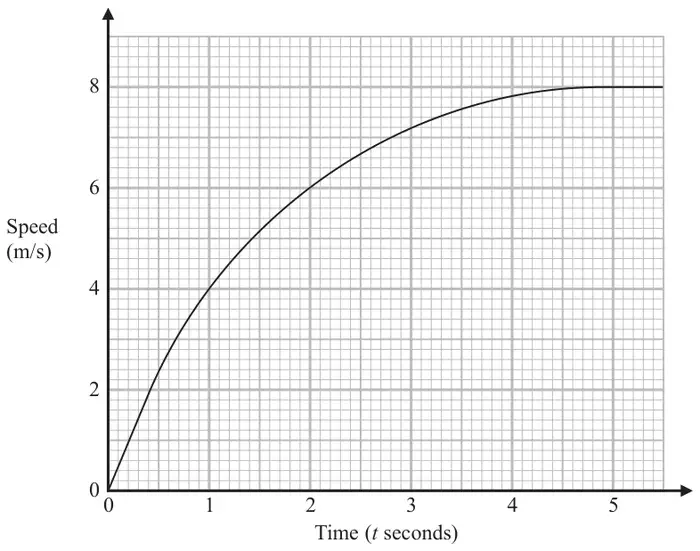
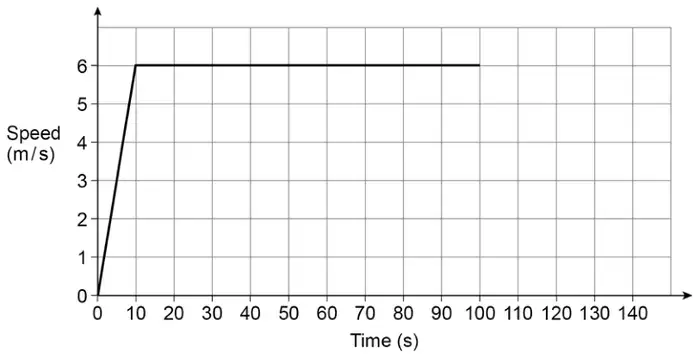
21 Here is a speed-time graph showing the speed, in metres per second, of an object \(t\) seconds after it started to move from rest.
(a) Using 3 trapeziums of equal width, work out an estimate for the area under the graph between \(t = 1\) and \(t = 4\) (3)
(b) What does this area represent? (1)
Mark scheme (a)
Answer
Mark
Mark scheme
19.1
M1
for a method to find an estimate for the area of at least 1 trapezium under the curve eg \(0.5 \times 1 \times (4 + 6)\) or \(0.5 \times 1 \times (6 + 7.2)\) or \(0.5 \times 1 \times (7.2 + 7.8)\)
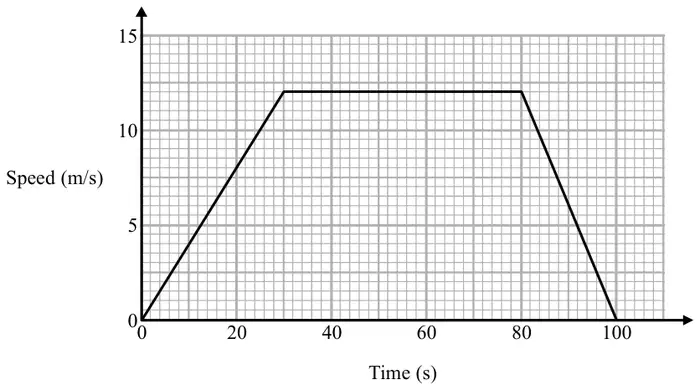
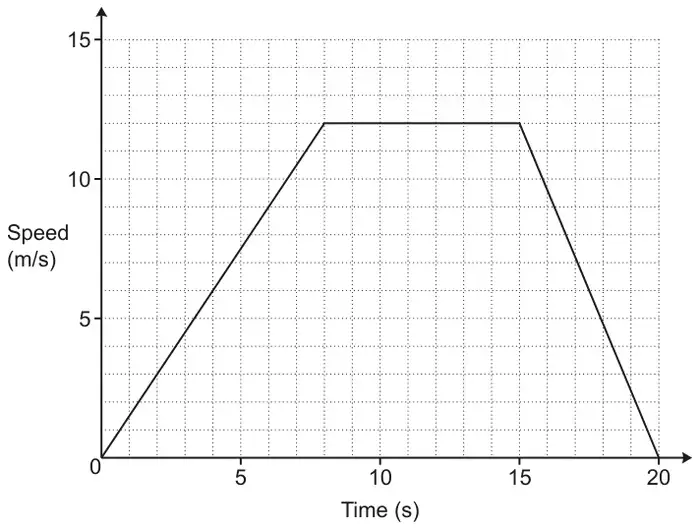
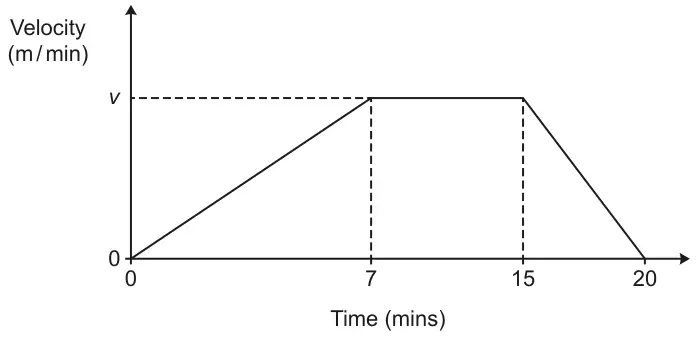
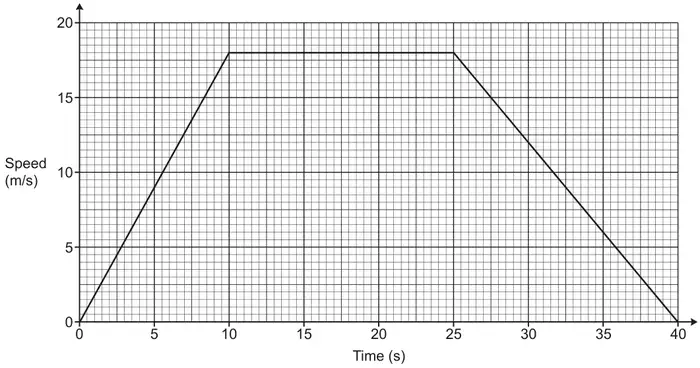
21 Here is a speed-time graph for a train journey between two stations. The journey took 100 seconds.
(a) Calculate the time taken by the train to travel half the distance between the two stations. You must show all your working. (4)
(b) Compare the acceleration of the train during the first part of its journey with the acceleration of the train during the last part of its journey. (1)
Mark scheme (a)
Answer
Mark
Mark scheme
52.5
P1
starts to find area under graph, eg \(\dfrac{30 \times 12}{2}\ (= 180)\) or \(50 \times 12\ (= 600)\) or \(\dfrac{20 \times 12}{2}\ (= 120)\)
P1
complete process to find area under graph, eg \(\dfrac{30 \times 12}{2} + 50 \times 12 + \dfrac{20 \times 12}{2}\ (= 900)\)
P1
starts process to find half way time, eg \(((\text{``}900\text{''} \div 2) - 180) \div 12\ (= 22.5)\)
A1
52.5 oe
Mark scheme (b)
Answer
Mark
Mark scheme
Comparison
C1
acceptable comparison
Acceptable (acceleration) during first part is positive but (acceleration) during last part is negative / deceleration (acceleration is) greater during the last part than during the first part gradient is steeper in the last part / longer to speed up than slow down speed / (acceleration) is increasing at start and decreasing at end (acceleration) is slower in the first part (acceleration) is ascending in the first part and descending in the last part 0.4 is the first part and \(-0.6\) in the last part
Not acceptable goes down in the last part speed is greater in last part than first part
Use the graph to find estimates for the solutions to the equation \(x^2 - 2x - 2 = 0\) You must show how you get your solutions. (4)
Mark scheme
Answer
Mark
Mark scheme
2.7 and \(-0.7\)
M1
for \(x^2 - 3 = 2x - 1\) oe or \(x^2 - 3 - 2x + 1\ (= 0)\) or completing the square eg \((y =)\ (x - 1)^2 - 1 - 2\)
M1
(dep M1) draws graph of \(y = 2x - 1\) or drawing the translated graph or describing the translation in words or \(-1.7 + 1\ (= -0.7)\) or \(1.7 + 1\ (= 2.7)\)
M1
shows the points of intersection clearly for the given quadratic graph and linear graph or for one correct solution from appropriate supportive working
A1
for \(x\) in the range 2.6 to 2.8 and \(-0.6\) to \(-0.8\)
SC B2 for plotting \(y = 2x + 1\) and values for \(x\) in the range \(-1.1\) to \(-1.3\) and 3.1 to 3.3
Additional guidance
Line segments required For 1.7 allow from 1.6 to 1.8 For \(-1.7\) allow from \(-1.8\) to \(-1.6\)
Points indicated or attempt to read off \(x\)-axis at the appropriate points – maybe indicated by dashes
16 Steve drove from his home to his friend’s house. He stayed at his friend’s house and then drove home.
Here is Steve’s travel graph.
(a) For how many minutes did Steve stay at his friend’s house? (1)
(b) What was Steve’s average speed on his journey home? (2)
Mark scheme (a)
Answer
Mark
Mark scheme
45
B1
cao
Mark scheme (b)
Answer
Mark
Mark scheme
50
M1
for an attempt to find the gradient eg \(\text{``}25\text{''} \div \text{``}0.5\text{''}\) ft their readings from the travel graph; use of speed-time formula eg \(25 \div 30\) (ignore units if shown)
A1
cao
Additional guidance
could be shown in working or on the graph using any acceptable triangle; could be shown by multiples of 25, 0.5 or multiples of ft figures
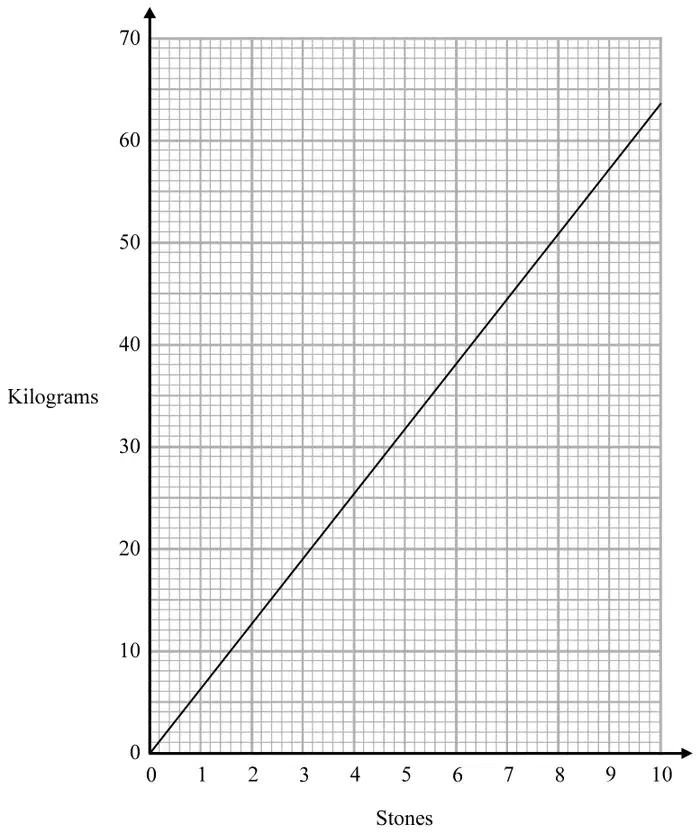
11 You can use this graph to change between stones and kilograms.
(a) Change 3 stones to kilograms. (1)
(b) Change 80 kilograms to stones. (2)
Mark scheme (a)
Answer
Mark
Mark scheme
19
B1
cao
Mark scheme (b)
Answer
Mark
Mark scheme
12.4 to 12.8
M1
for a complete method, eg attempts to read from the graph at a factor of 80 and scales up to 80 or attempts to read from the graph at two numbers that sum to 80 and finds the sum of their readings or 1 stone = “6”kg and \(80 \div \text{``}6\text{''}\)
A1
for an answer in the range 12.4 to 12.8 or ft correct reading from graph
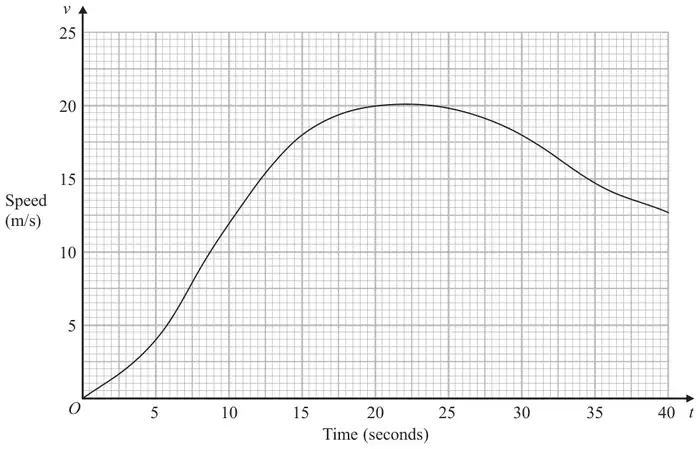
The graph gives information about the speed, \(v\) metres per second, of the car \(t\) seconds after it starts to move.
(a)
(i) Calculate an estimate of the gradient of the graph at \(t = 15\) (3)
(ii) Describe what your answer to part (i) represents. (1)
(b) Work out an estimate for the distance the car travels in the first 20 seconds of its journey. Use 4 strips of equal width. (3)
Mark scheme (a)(i)
Answer
Mark
Mark scheme
0.83
B1
for a tangent drawn at \(t = 15\)
M1
full method to use the tangent to find the gradient (eg \(7.5 \div 9\))
A1
for answer in the range 0.6 to 1.0
Additional guidance
Working: \(7.5 \div 9 = 0.83\ldots\) No tangent scores 0 marks
This mark can be awarded if the tangent is drawn at \(t \neq 15\) Working may be seen on the diagram
Mark scheme (a)(ii)
Answer
Mark
Mark scheme
Statement
C1
statement Acceptable examples acceleration rate of change of speed increase in speed over time Not acceptable examples rate of change m/s/s increase in speed
Mark scheme (b)
Answer
Mark
Mark scheme
220
P1
for splitting the area into strips and correct process to find the area of one strip, eg \(\dfrac{5 \times 4}{2}\ (= 10)\) or \(\dfrac{(4 + 12)}{2} \times 5\ (= 40)\) or \(\dfrac{(12 + 18)}{2} \times 5\ (= 75)\) or \(\dfrac{(18 + 20)}{2} \times 5\ (= 95)\)
P1
for a complete process using at least 4 strips to find the area under the curve eg, \(\text{``}10\text{''} + \text{``}40\text{''} + \text{``}75\text{''} + \text{``}95\text{''}\)
A1
for answer in the range 215 to 225 from correct working using at least 4 strips
(a) Complete this table of values for \(y = x^2 + x - 4\)
\(x\)
\(-3\)
\(-2\)
\(-1\)
\(0\)
\(1\)
\(2\)
\(3\)
\(y\)
\(-2\)
\(-4\)
\(-2\)
(2)
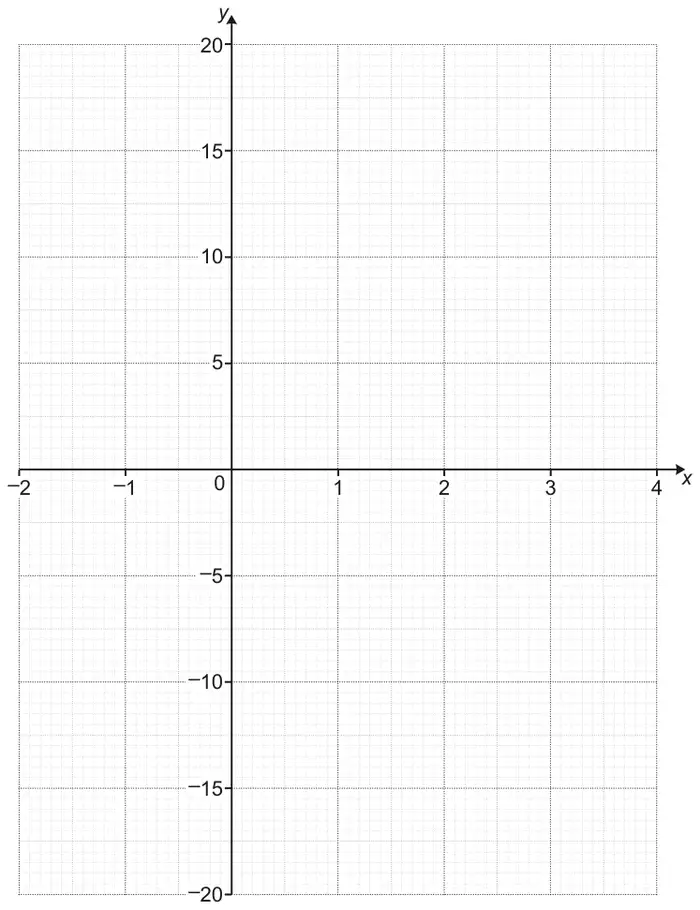
(b) On the grid, draw the graph of \(y = x^2 + x - 4\) for values of \(x\) from \(-3\) to 3(2)
(c) Use the graph to estimate a solution to \(x^2 + x - 4 = 0\) (1)
Mark scheme (a)
Answer
Mark
Mark scheme
\(2, -4, 2, 8\)
B2
all 4 values correct
(B1
for 2 or 3 correct values)
Mark scheme (b)
Answer
Mark
Mark scheme
Graph
M1
(dep B1) for at least 5 points plotted correctly ft from part a
A1
for a fully correct curve drawn
Additional guidance
Accept freehand curves drawn that are not line segments; there must be some attempt to draw the minimum point below \(y = -4\).
Mark scheme (c)
Answer
Mark
Mark scheme
\(-2.6\) or 1.6
B1
for 1 correct value, ft a non linear graph
Additional guidance
Award for \(-2.6\) or 1.6 or both values but do not award the mark if a correct value is given with an incorrect value. Accept 1.56 or \(-2.56\) Note for ft to be applied the graph may be joined by line segments.
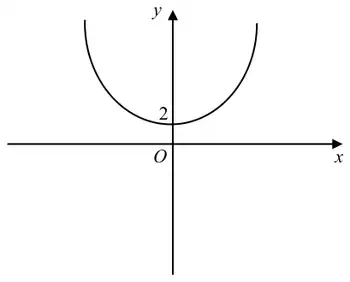
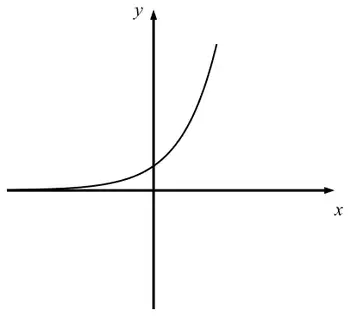
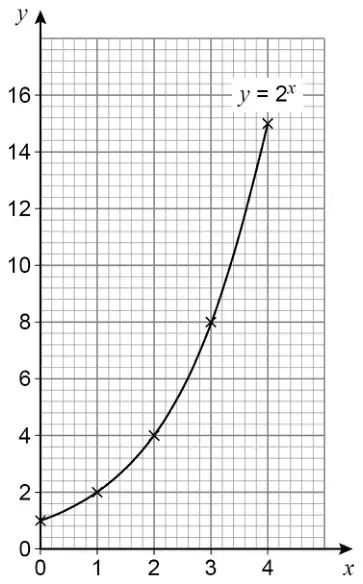
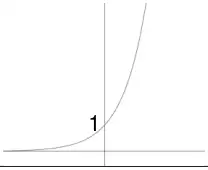
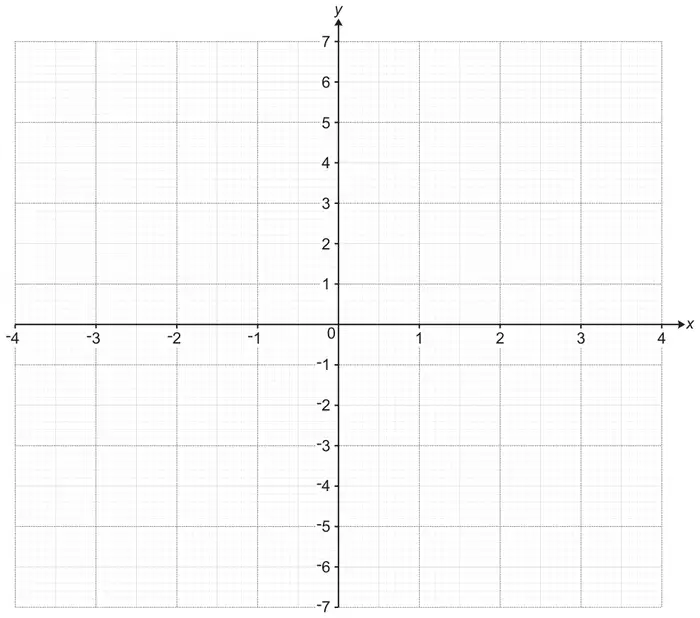
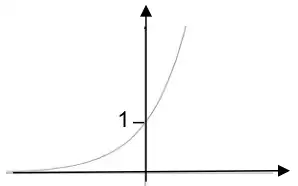
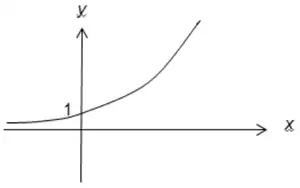
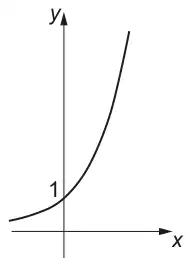
14 On the grid, sketch the curve with equation \(y = 2^x\) Give the coordinates of any points of intersection with the axes.
(2)
Mark scheme
Answer
Mark
Mark scheme
curve
C1
sketch of graph which starts above \(x\)-axis for negative \(x\), and makes an increasing exponential rise into positive \(x\)
(0,1) labelled
C1
for showing a label of (0,1) on the \(y\) axis
Additional guidance
Condone graph “touching” the \(x\) axis. Do not award from a graph for positive \(x\) only.
Do not award if a point is given for crossing the \(x\)-axis. Accept the coordinates shown as a label of “1” written on the \(y\) axis at the intersection.
(a) Complete this table of values for \(y = x^2 + x - 4\)
\(x\)
\(-3\)
\(-2\)
\(-1\)
\(0\)
\(1\)
\(2\)
\(3\)
\(y\)
\(-2\)
\(-4\)
\(-2\)
(2)
(b) On the grid, draw the graph of \(y = x^2 + x - 4\) for values of \(x\) from \(-3\) to 3(2)
(c) Use the graph to estimate a solution to \(x^2 + x - 4 = 0\) (1)
Mark scheme (a)
Answer
Mark
Mark scheme
\(2, -4, 2, 8\)
B2
all 4 values correct
(B1
for 2 or 3 correct values)
Mark scheme (b)
Answer
Mark
Mark scheme
Graph
M1
(dep B1) for at least 5 points plotted correctly ft from part a
A1
for a fully correct curve drawn
Additional guidance
Accept freehand curves drawn that are not line segments; there must be some attempt to draw the minimum point below \(y = -4\).
Mark scheme (c)
Answer
Mark
Mark scheme
\(-2.6\) or 1.6
B1
for 1 correct value, ft a non linear graph
Additional guidance
Award for \(-2.6\) or 1.6 or both values but do not award the mark if a correct value is given with an incorrect value. Accept 1.56 or \(-2.56\) Note for ft to be applied the graph may be joined by line segments.
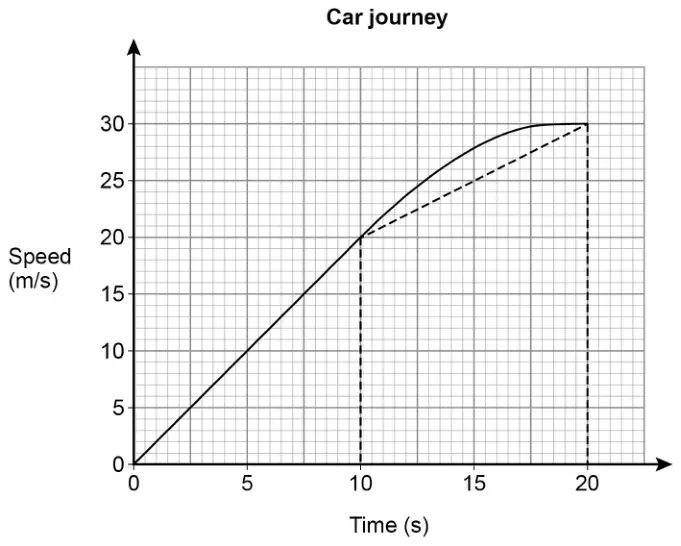
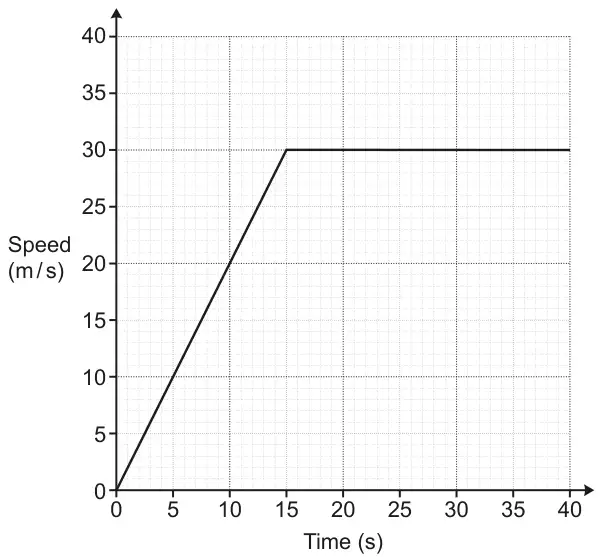
15 The graph shows the speed of a car, in metres per second, during the first 20 seconds of a journey.
(a) Work out an estimate for the distance the car travelled in the first 20 seconds. Use 4 strips of equal width. (3)
(b) Is your answer to part (a) an underestimate or an overestimate of the actual distance the car travelled in the first 20 seconds? Give a reason for your answer. (1)
Mark scheme (a)
Answer
Mark
Mark scheme
488 to 507
M1
for method to find area of one strip using trapezia, eg \(\frac{1}{2} \times 5 \times 22\) (= 55) or \(\frac{1}{2} \times 5 \times (22 + 28)\) (= 125) or \(\frac{1}{2} \times 5 \times (28 + 32)\) (= 150) or \(\frac{1}{2} \times 5 \times (32 + 35)\) (= 167.5) OR for a method to find an estimate for the area using rectangles eg \(5 \times 22\) or \(5 \times 28\) or \(5 \times 32\) or \(5 \times 35\)
M1
for complete and correct method to find the area using four strips, eg \(\frac{1}{2} \times 5 \times 22 + \frac{1}{2} \times 5 \times (22 + 28) + \frac{1}{2} \times 5 \times (28 + 32) + \frac{1}{2} \times 5 \times (32 + 35)\) or \(5 \times 22 + 5 \times 28 + 5 \times 32 + 5 \times 35\)
A1
for answer in the range 488 to 507
(SC B1 for using area under the curve)
Additional guidance
May use area of triangle + area of rectangle for the second, third and fourth strips – lengths must be correct. May use triangle for first strip, \(\frac{1}{2} \times 5 \times 22\)
May use triangle for first strip, \(\frac{1}{2} \times 5 \times 22\)
Mark scheme (b)
Answer
Mark
Mark scheme
Underestimate (supported)
C1
(dep M1) for underestimate since parts not included below the graph OR ft their method
(a) Complete the table of values for \(y = \dfrac{1}{2}x - 1\)
\(x\)
\({-2}\)
\({-1}\)
\(0\)
\(1\)
\(2\)
\(3\)
\(y\)
\({-2}\)
\(0\)
(2)
(b) On the grid, draw the graph of \(y = \dfrac{1}{2}x - 1\) for values of \(x\) from \(-2\) to 3(2)
(c) Use your graph to find the value of \(x\) when \(y = 0.3\) (1)
Mark scheme (a)
Answer
Mark
Notes
(−2) −1.5 −1 −0.5 (0) 0.5
B2
for a fully correct table
[B1
for 2 or 3 correct entries]
Mark scheme (b)
Answer
Mark
Notes
Correct line
M1
for correctly plotting at least 5 of their points (provided B1 scored in part (a)) or for a straight line with gradient 0.5 or for a straight line through \((0, -1)\) with a positive gradient
A1
for a correct line between \(x = -2\) and \(x = 3\)
Mark scheme (c)
Answer
Mark
Notes
2.6
B1
for answer in the range 2.5 to 2.7 or ft a single straight line with positive gradient
20 The equation of a curve is \(y = a^x\) \(A\) is the point where the curve intersects the \(y\)-axis.
(a) State the coordinates of \(A\). (1)
The equation of circle C is \(x^2 + y^2 = 16\)
The circle C is translated by the vector \(\begin{pmatrix} 3 \\ 0 \end{pmatrix}\) to give circle B.
(b) Draw a sketch of circle B. Label with coordinates the centre of circle B and any points of intersection with the \(x\)-axis. (3)
Mark scheme (a)
Answer
Mark
Notes
(0, 1)
B1
(0, 1)
Mark scheme (b)
Answer
Mark
Notes
Circle radius 4 Centre (3, 0) and (−1, 0) and (7, 0) labelled
M1
For centre (3, 0) implied by drawing or label or a circle of radius 4 or intersections on the \(x\)-axis at \(-1\) or 7 implied by drawing or labels
M1
for 2 of centre (3, 0) implied by drawing or label intersections on the \(x\)-axis at \(-1\) and 7 implied by drawing or label circle drawn with radius 4
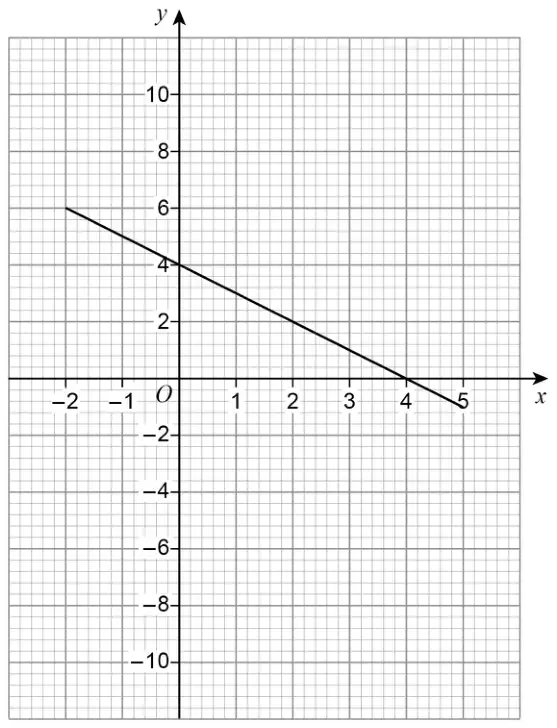
(a) Complete the table of values for \(x + y = 4\)
\(x\)
\(-1\)
0
1
2
3
4
\(y\)
3
0
(2)
(b) On the grid, draw the graph of \(x + y = 4\) for values of \(x\) from \(-1\) to 4(2)
Mark scheme (a)
Answer
Mark
Notes
5, 4, (3), 2, 1, (0)
2
M1 for 1 or 2 or 3 correct entries A1 cao
Mark scheme (b)
Answer
Mark
Notes
Line drawn
2
M1 plots 5 of their points correctly or a straight line with gradient \(-1\) or a straight line through (0, 4) A1 correct line between \(x = -1\) and \(x = 4\)
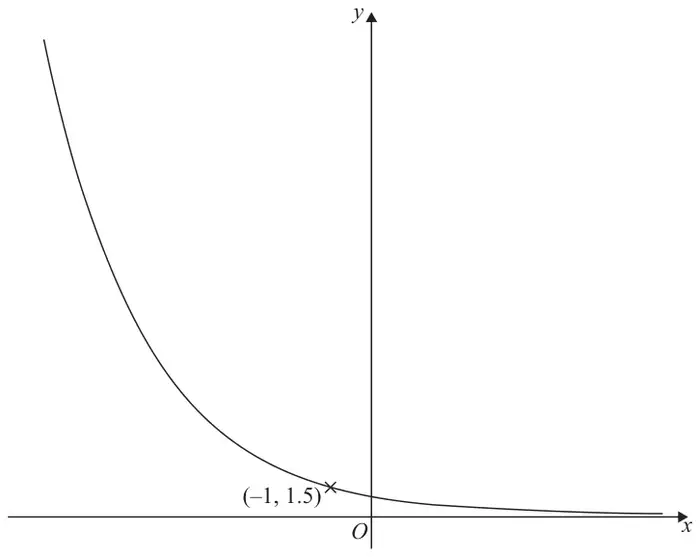
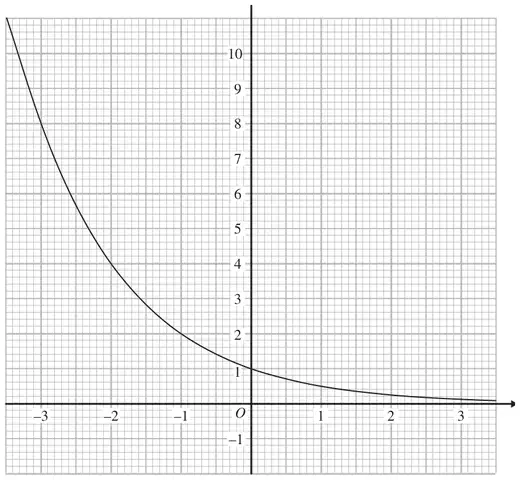
The graph of \(y = k^x\), where \(k\) is a positive constant, is shown above.
(a) Find the value of \(k\). (2)
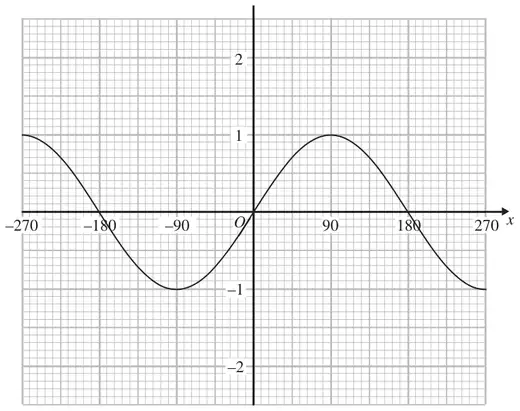
The graph of \(y = \sin x^\circ\) for values of \(x\) from \(-270\) to \(+270\) is shown above.
(b) On the same axes, draw the graph of \(y = 1 - \sin x^\circ\) for values of \(x\) from \(-270\) to \(+270\) (2)
Mark scheme (a)
Working
Answer
Mark
Notes
\(2 = k^{-1}\)
\(\tfrac{1}{2}\)
2
M1 for reading off and substituting a pair of values from the graph (excluding 0, 1) into the equation, eg \(x = -1\), \(y = 2\) A1 for \(\tfrac{1}{2}\) oe
Mark scheme (b)
Answer
Mark
Notes
correct graph
2
B2 cao (B1 for correct general shape, eg \(y = -\sin x^\circ\))
(a) Complete the table of values for \(y = 8 - 2x\)
\(x\)
\(-1\)
0
1
2
3
4
\(y\)
6
0
(2)
(b) On the grid, draw the graph of \(y = 8 - 2x\) for values of \(x\) from \(-1\) to 4(2)
Mark scheme (a)
Answer
Mark
Notes
10, 8, (6), 4, 2, (0)
2
B2 for fully correct table (B1 for 2 or 3 entries correct)
Mark scheme (b)
Answer
Mark
Notes
line drawn
2
B2 for correct straight line between \(x = -1\) and \(x = 4\) (B1 for a single straight line which passes through (0, 8) or for a single straight line with negative gradient \(-2\) or for at least 5 points from their table plotted correctly)
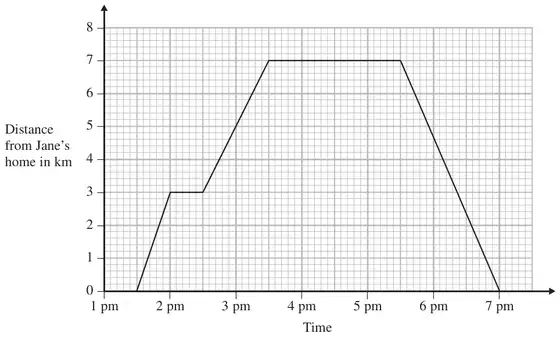
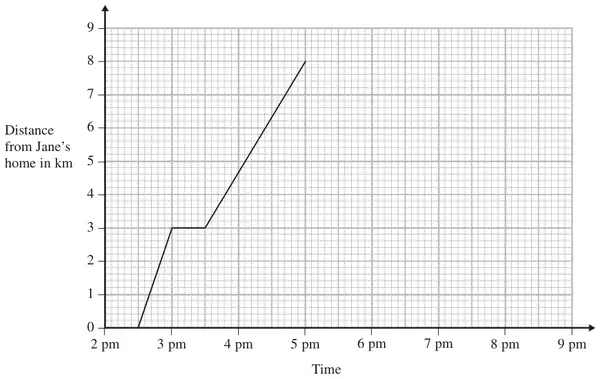
17 Jane walked from her home to the ice rink and then walked back home. The travel graph for Jane’s journey to the ice rink and back home is shown below.
On the way to the ice rink Jane stopped at her friend’s house.
(a) How long did Jane stay at her friend’s house? (1)
(b) How far is it from her friend’s house to the ice rink? (1)
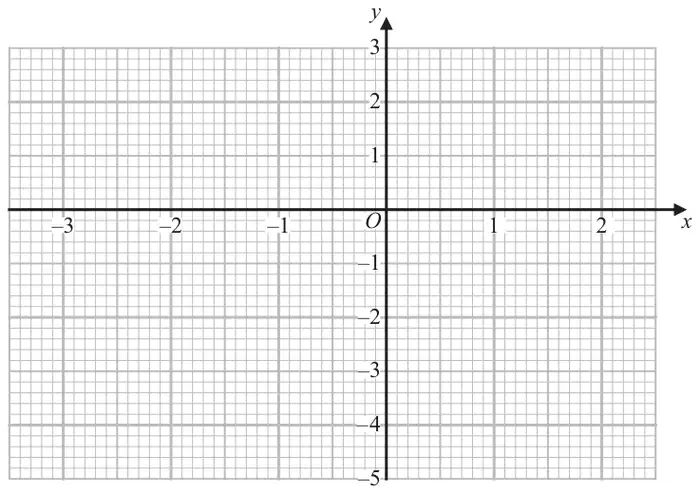
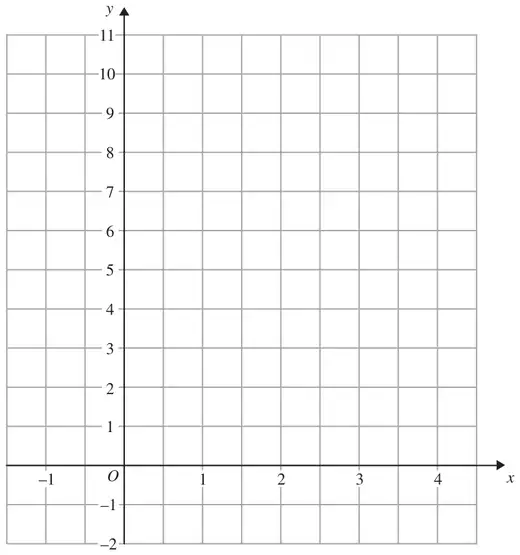
(b) On the grid, draw the graph of \(y = 2^x\) for values of \(x\) from \(-2\) to 3(2)
Mark scheme (a)
Working
Answer
Mark
Notes
\(x\)
\(-2\)
\(-1\)
0
1
2
3
\(y\)
0.25
0.5
1
2
4
8
0.5, 1, 4, 8
2
B2 for all 4 correct (B1 for 2 or 3 correct)
Mark scheme (b)
Answer
Mark
Notes
Correct graph
2
M1 for at least 5 points plotted correctly from their table, provided at least B1 scored in part (a) A1 cao for a correct graph drawn from (−2, 0.25) to (3, 8)
7 On the grid, draw the graph of \(y = 8 - 2x\) for values of \(x\) from \(-1\) to 4
(3)
Mark scheme
Working
Answer
Mark
Notes
\(x\)
\(-1\)
0
1
2
3
4
\(y\)
10
8
6
4
2
0
\(y = 8 - 2x\) drawn
3
B3 for a correct line between \(x = -1\) and \(x = 4\)
OR B2 for a correct straight line segment through at least 3 of \((-1, 10)\), (0, 8), (1, 6), (2, 4), (3, 2), (4, 0) or for all of these points plotted but not joined or for a line drawn with a negative gradient through (0, 8) and clear intention to use of a gradient of \(-2\), eg line through (0,8) and (0.5, 6)
OR B1 for at least 2 correct points stated or plotted or for a line drawn with a negative gradient through (0, 8) or a line with gradient \(-2\)
4 Jane walked from her home to the ice rink. The travel graph for Jane’s journey to the ice rink is shown below.
On the way to the ice rink Jane stopped at her friend’s house.
(a) How far is it from her friend’s house to the ice rink? (1)
Jane was at the ice rink for 1 hour 30 minutes. She then walked home at a steady speed. Jane took 2 hours to walk home.
(b) Complete the travel graph for this information. (2)
Mark scheme (a)
Answer
Mark
Notes
5
1
B1 cao
Mark scheme (b)
Answer
Mark
Notes
Lines added
2
B1 for a horizontal line from (5, 8) to (6.30, 8) B1 for a single straight line with the correct gradient and length, down to the time axis eg (6.30, 8) to (8.30, 0)
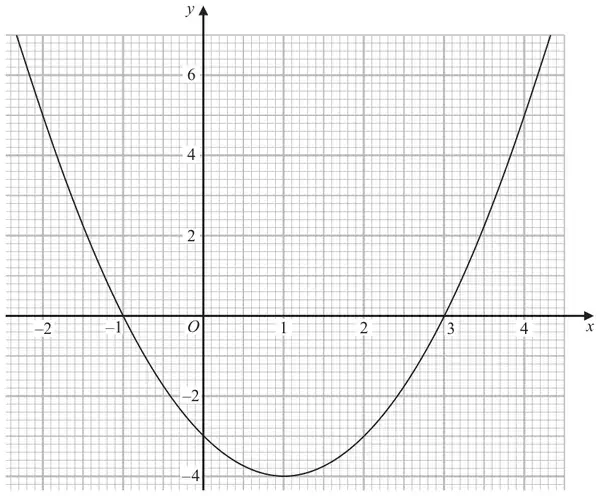
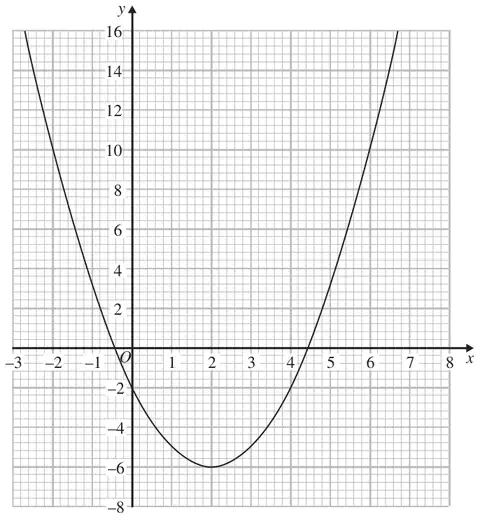
19 The diagram shows the graph of \(y = x^2 - 4x - 2\)
(a) Use the graph to find estimates for the solutions of
(i) \(x^2 - 4x - 2 = 0\)
(ii) \(x^2 - 4x - 6 = 0\) (3)
(b) Use the graph to find estimates for the values of \(x\) that satisfy the simultaneous equations \[\begin{aligned} y &= x^2 - 4x - 2 \\ x + y &= 6 \end{aligned}\] (3)
Mark scheme (a)
Answer
Mark
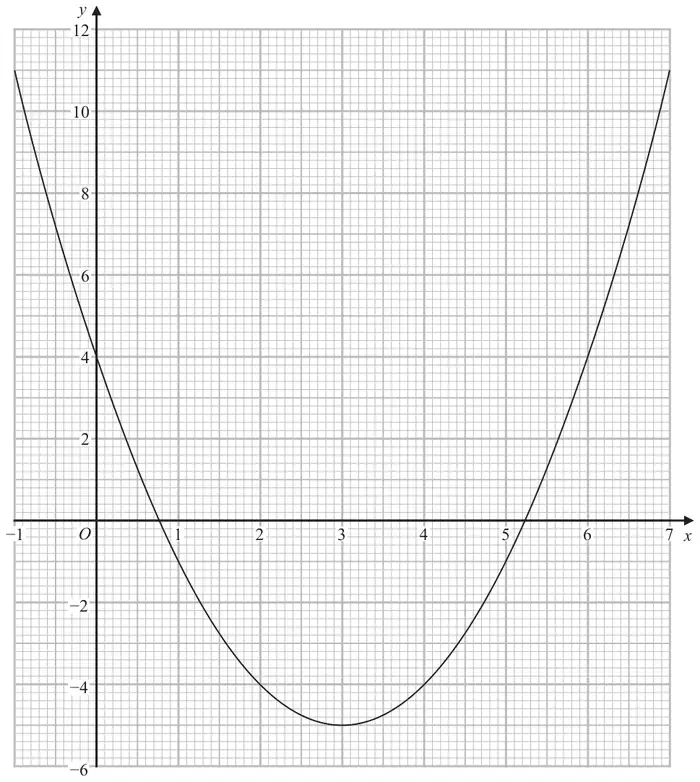
Notes
(i) \(-0.4\) to \(-0.5\) 4.4 to 4.5
B1 for value in range \(-0.4\) to \(-0.5\) and value in range 4.4 to 4.5 NB: condone values given as part of coordinates.
(ii) \(-1.0\) to \(-1.2\) 5.0 to 5.2
3
M1 for \(x^2 - 4x - 2 = 4\) or line \(y = 4\) drawn on graph or points marked with a \(y\) coord. of 4 or a value in range \(-1.0\) to \(-1.2\) or a value in range 5.0 to 5.2 A1 for value in range \(-1.0\) to \(-1.2\) and value in range 5.0 to 5.2; do not accept coordinates.
Mark scheme (b)
Answer
Mark
Notes
\(-1.6\) to \(-1.8\) 4.6 to 4.8
3
M1 for \(x + y = 6\) drawn on graph A2 for value in range \(-1.6\) to \(-1.8\) and value in range 4.6 to 4.8 (A1 for one correct value or both values given as coordinates)
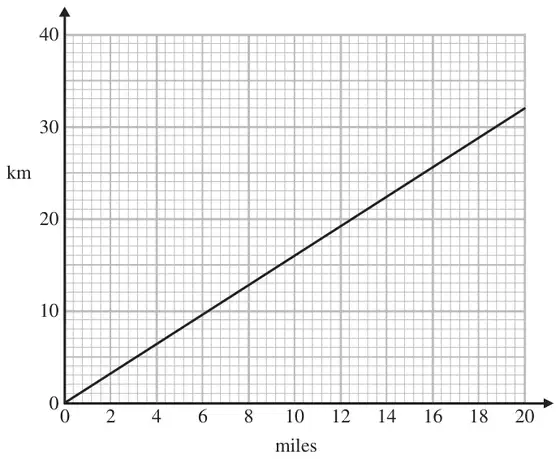
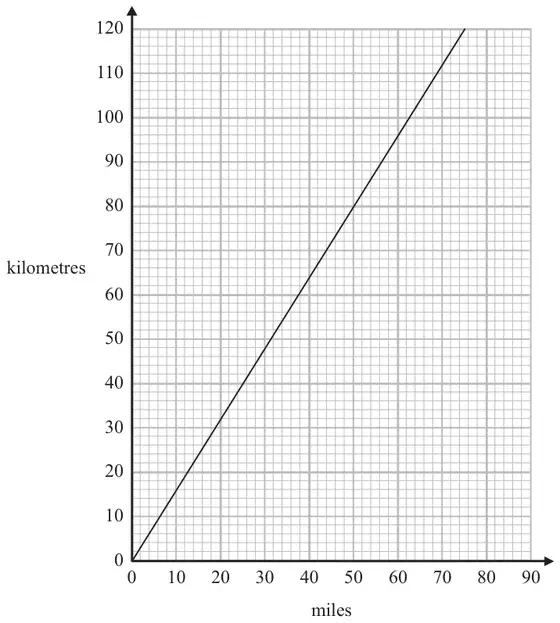
14 You can use this graph to change between km and miles.
(a) Change 18 miles to km. (1)
(b) Change 13 km to miles. (1)
Chris drives 250 km. He then drives 100 miles.
(c) Work out, in miles, the total distance Chris drives. (3)
Mark scheme (a)
Answer
Mark
Notes
28 – 29
1
B1 answer in range 28 – 29
Mark scheme (b)
Answer
Mark
Notes
8 – 8.5
1
B1 answer in range 8 – 8.5
Mark scheme (c)
Answer
Mark
Notes
250 – 259
3
M1 for use of conversion graph to change 250 km to miles (eg 140 – 160 miles) or 100 miles to km (eg 150 – 170 km) M1 (dep) for addition of 100 miles or 250 km in consistent units A1 for answer in the range 250 – 259 (miles)
(a) Complete the table of values for \(y = x^2 - 3x + 2\)
\(x\)
\(-1\)
0
1
2
3
4
5
\(y\)
6
2
12
(2)
(b) On the grid, draw the graph of \(y = x^2 - 3x + 2\) for values of \(x\) from \(-1\) to 5(2)
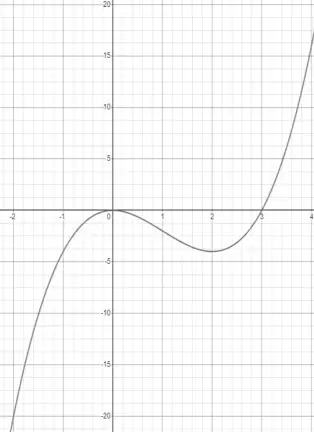
(c) Find estimates for the solutions of the equation \(x^2 - 3x + 2 = 4\) (2)
Mark scheme (a)
Answer
Mark
Notes
2, 0, 0, 6
2
B2 for 2, 0, 0, 6 (B1 for at least two of 2, 0, 0, 6); could be taken from graph
Mark scheme (b)
Answer
Mark
Notes
Correct curve
2
M1 (ft) for at least 5 points plotted correctly A1 for a fully correct curve
Mark scheme (c)
Answer
Mark
Notes
\(-0.6\), 3.6
2
M1 (ft if M1 awarded in (b) and at least B1 in (a)) for indicating a point or line drawn at \(y = 4\), or one solution given A1 (ft) for both solutions
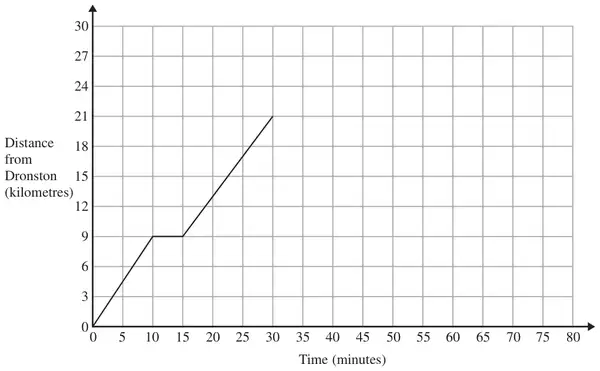
10 A coach travels from Dronston to Luscoe. The travel graph for this journey is shown below.
(a) Work out the average speed of the coach, in kilometres per hour, for the first 10 minutes of the journey. (2)
The coach stops in Luscoe for 15 minutes. The coach then returns to Dronston at a constant speed of 42 km/h.
(b) Show this information on the travel graph. (3)
Mark scheme (a)
Working
Answer
Mark
Notes
\(9 \times 6\)
54
2
M1 for a method to find the speed e.g \(9 \div 10\), \(9 \div 0.16\) A1 cao
Mark scheme (b)
Answer
Mark
Notes
Graph completed
3
B1 horizontal line from (30,21) to (45,21) M1 for a complete method to show the return journey is 30 mins or \(\tfrac{1}{2}\) hour evidenced by the line on the graph or by calculation A1 Correct line drawn from Luscoe \((x, 21)\) to \((x + 30, 0)\)
M1 for \(y = 2x + 1\) drawn or for elimination of one variable A1 for one correct pair of values given or for \(x = 1.4, -2.2\) (\(\pm 0.2\)) or ft from graph provided 2 marks in (a) A1 for second correct pair of values given (\(\pm 0.2\)) or ft from graph provided 2 marks in (a)
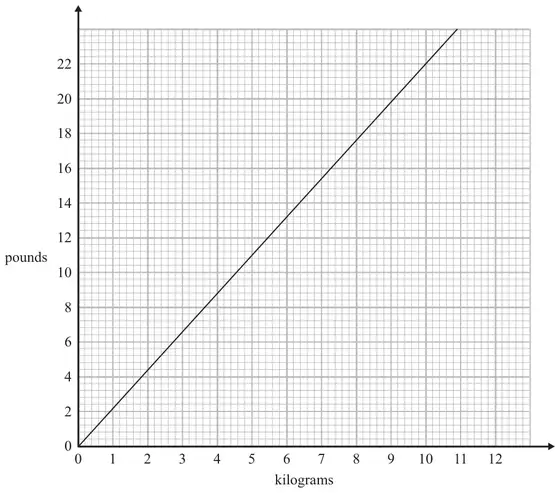
10 You can use this graph to change between pounds and kilograms.
(a) Change 13 pounds to kilograms. (1)
A trolley can carry a maximum weight of 200 pounds.
Jack has 4 bags of potatoes. Each bag of potatoes weighs 25 kilograms.
(*b) Can the trolley carry the 4 bags of potatoes at the same time? You must show your working. (3)
Mark scheme (a)
Answer
Mark
Notes
5.8 to 6
1
B1 for an answer in the range 5.8 to 6
Mark scheme (b)
Answer
Mark
Notes
No (supported)
3
M1 for a correct conversion of any amount (lb to kg or kg to lb) excepting that in (a) M1 (dep M1) for a complete method to convert 100 kg (from \(25 \times 4\)) to lb (to compare with 200 lb) or to convert 50 lb (from \(200 \div 4\)) to kg (to compare with 25 kg) C1 for “no” and a comparison with a converted weight of 212 – 228 pounds or 88 – 94 kg
25 On the grid, draw the graph of \(y = 2x - 3\) for values of \(x\) from \(-2\) to 3 (4)
Mark scheme
Answer
Mark
Notes
Straight line from \((-2, -7)\) to \((3, 3)\)
4
(Table of values) C1 for axes scaled and labelled M1 for at least 2 correct attempts to find points by substituting values of \(x\) M1 ft for plotting at least 2 of their points (any points plotted from their table must be plotted correctly) A1 for correct line between \(x = -2\) and \(x = 3\)
(No table of values) C1 for axes scaled and labelled M1 for at least 2 correct points with no more than 2 incorrect points M1 for at least 2 correct points (and no incorrect points) plotted OR line segment of \(y = 2x - 3\) drawn A1 for correct line between \(x = -2\) and \(x = 3\)
(Use of \(y = mx + c\)) C1 for axes scaled and labelled M1 for line drawn with gradient of 2 OR line drawn with a \(y\) intercept of \(-3\) M1 for line drawn with gradient of 2 AND with a \(y\) intercept of \(-3\) A1 for correct line between \(x = -2\) and \(x = 3\)
[SC B2 (indep of C1) for the correct line between \(x = 0\) and \(x = 3\), ignore any additional incorrect line segment(s)]
*13 You can use this graph to change between miles and kilometres.
The distance from Paris to London is 280 miles. The distance from Paris to Amsterdam is 500 kilometres.
Is Paris further from London or further from Amsterdam? You must show how you get your answer. (3)
Mark scheme
Answer
Mark
Notes
Amsterdam with figures
3
B1 for a correct conversion from miles to km or km to miles eg 8 km = 5 miles eg 28 miles = 44 km M1 for a correct method to convert 280 miles to km or 500 km to miles or 420 – 460 (km) or 300 – 320 (miles) C1 (dep on M1) for statement with correct conclusion and correct conversions (420 – 460 km or 300 – 320 miles)
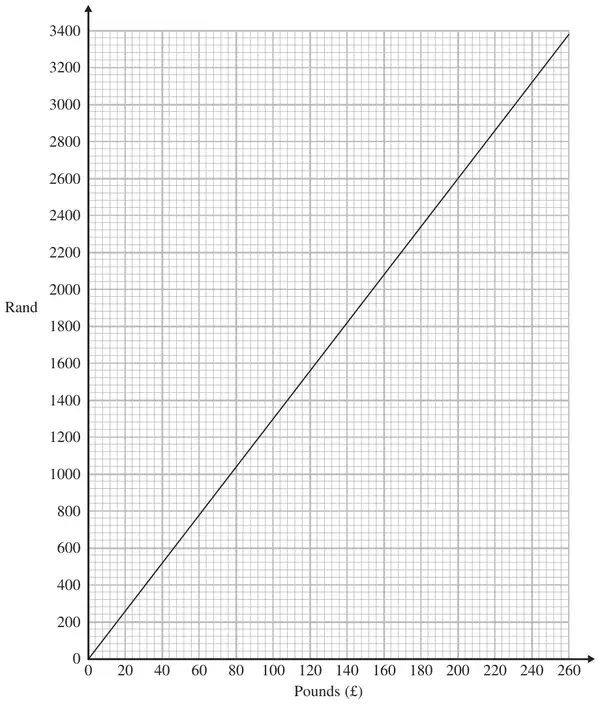
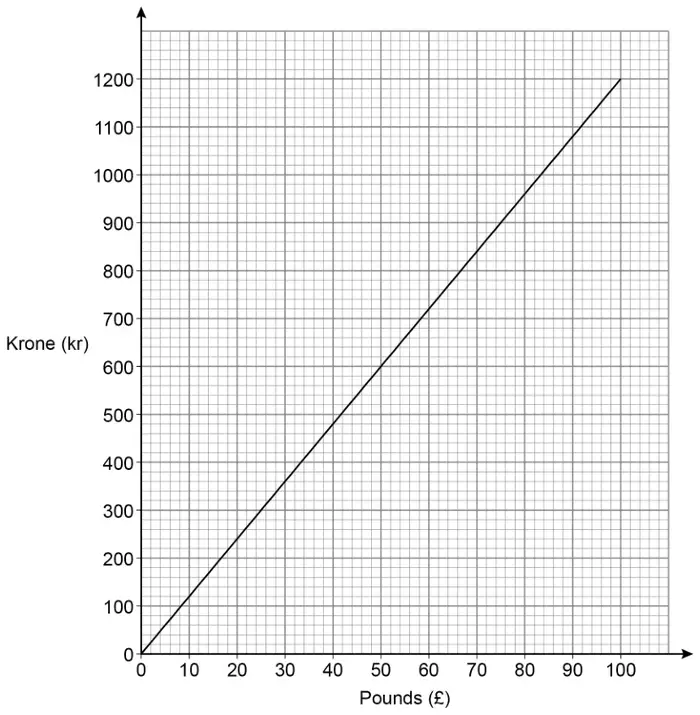
18 Here is a conversion graph to change between UK pounds (£) and South African rand.
Jo changes £200 into rand.
(a) How many rand does she get? (1)
Simon has £100 and 3700 rand.
He goes to a shop where he can spend both pounds and rand.
He wants to buy a computer costing £360 or a watch costing £400 or a camera costing £375
*(b) Which of these items can Simon afford to buy? You must show clearly how you get your answer. (3)
Mark scheme (a)
Answer
Mark
Notes
2600
1
B1 for 2600
Mark scheme (b)
Working
Answer
Mark
Notes
£100
1300 rand
3700 rand
£285
Computer
4680 rand
Watch
5200 rand
Camera
4875 rand
computer, camera
3
M1 for method to convert 3700 rand into £ or for changing one amount in pounds into rand M1 for a complete method to compare total money Simon has with the cost of each item C1 (dep M2) for correct conclusion with correct figures e.g. £383 - £386 or 4950 rand to 5050 rand
(a) Complete the table of values for \(y = x^2 - 2x - 1\)
\(x\)
\(-2\)
\(-1\)
0
1
2
3
4
\(y\)
7
\(-2\)
\(-1\)
(2)
(b) On the grid, draw the graph of \(y = x^2 - 2x - 1\) for values of \(x\) from \(-2\) to 4(2)
(c) Solve \(x^2 - 2x - 1 = x + 3\) (2)
Mark scheme (a)
Answer
Mark
Notes
\(2, -1, 2, 7\)
2
B2 for all correct (B1 for 2 or 3 correct)
Mark scheme (b)
Answer
Mark
Notes
Correct graph
2
M1 (dep on at least B1) for at least 6 points from their table plotted correctly A1 cao for fully correct graph
Mark scheme (c)
Working
Answer
Mark
Notes
\(x^2 - 3x - 4 = 0\) \((x - 4)(x + 1) = 0\)
\(-1, 4\)
2
M1 for line \(y = x + 3\) drawn correctly or for reduction to correct 3 term quadratic (=0) and : \((x \pm 1)(x \pm 4)\) or formula using \(a = 1\), \(b = -3\) and \(c = -4\), allow one sign error in the formula, or \(\left(x - \dfrac{3}{2}\right)^2 = 4 + \left(\dfrac{3}{2}\right)^2\) A1 cao
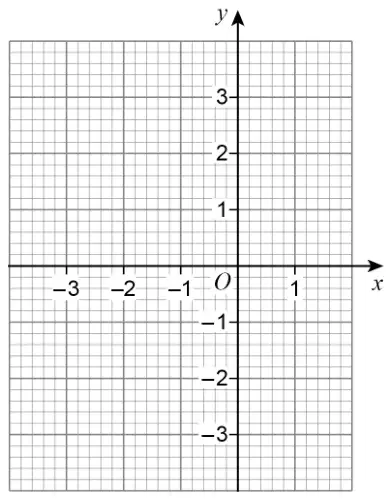
26 On the grid, draw the graph of \(y = 3x + 2\) for values of \(x\) from \(-2\) to 2
(4)
Mark scheme
Working
Answer
Mark
Notes
\(x\)
\(-2\)
\(-1\)
0
1
2
\(y\)
\(-4\)
\(-1\)
2
5
8
\(y = 3x + 2\) drawn
4
B1 for axes scaled and labelled (Table of values) M1 for at least 2 correct attempts to find points by substituting values of \(x\) M1 ft for plotting at least 2 of their points (any points from their table must be correctly plotted) A1 for correct line between \(x = -2\) and \(x = 2\) (No table of values) M1 for at least 2 correct points with no more than 2 incorrect points M1 for at least 2 correct points (and no incorrect points) plotted OR line segment of \(y = 3x + 2\) drawn A1 for correct line between \(x = -2\) and \(x = 2\) (Use of \(y = mx + c\)) M1 for line drawn with gradient of 3 OR line drawn with \(y\) intercept at 2 M1 for line drawn with gradient of 3 AND with \(y\) intercept at 2 A1 for correct line between \(x = -2\) and \(x = 2\) [SC B2 (indep of B1) for correct line segment between \(x = 0\) and \(x = 2\) – ignore any additional incorrect line segment(s)]
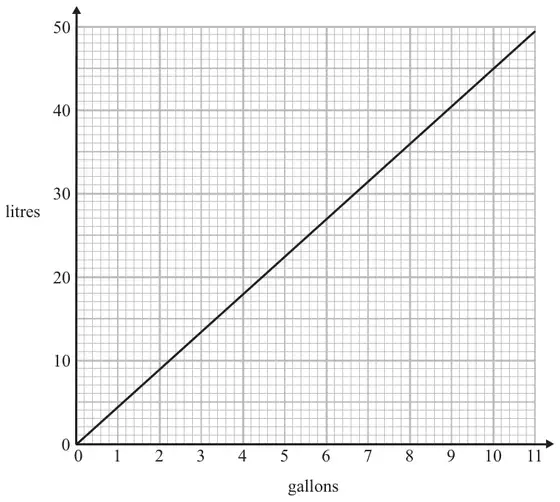
18 You can use this graph to change between gallons and litres.
There are 80 litres of petrol in the petrol tank of car A. There are 16 gallons of petrol in the petrol tank of car B.
Which car has the most petrol in its petrol tank?
You must show all your working.(3)
Mark scheme
Working
Answer
Mark
Notes
80 litres ≈ 18 gallons or 16 gallons ≈ 72 litres
A with correct figures
3
M1 for reading from the graph eg. 8 gallons = 36 litres; 20 litres = 4.4 gallons M1 for a complete method to convert either 80 litres into gallons or 16 gallons into litres e.g. 80 litres = “4.4” × 4 gallons or 16 gallons = “36” × 2 litres A1 for car A with correct figures in range 17.5 – 18.5 gallons or 64 – 72 litres
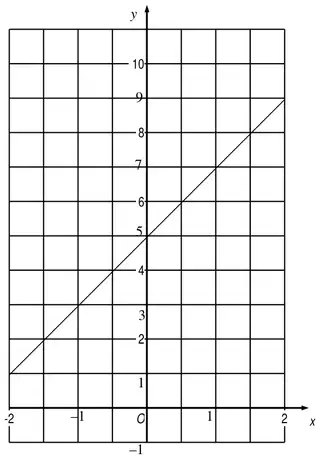
On the grid, draw the graph of \(y = \frac{1}{2}x + 5\) for values of \(x\) from \(-2\) to 4 (3)
Mark scheme
Working
Answer
Mark
Notes
\(x\)
\(-2\)
\(-1\)
0
1
2
3
4
\(y\)
4
4.5
5
5.5
6
6.5
7
\(y = \frac{1}{2}x + 5\) drawn
3
(Table of values / calculation of values) M1 for at least 2 correct attempts to find points by substituting values of \(x\). M1 ft for plotting at least 2 of their points (any points plotted from their table must be plotted correctly) A1 for correct line between \(x = -2\) and \(x = 4\) (No table of values) M1 for at least 2 correct points with no more than 2 incorrect points M1 for at least 2 correct points (and no incorrect points) plotted OR line segment of \(y = \frac{1}{2}x + 5\) drawn A1 for correct line between \(x = -2\) and \(x = 4\) (Use of \(y = mx + c\)) M1 for line drawn with gradient of 0.5 OR line drawn with a \(y\) intercept of 5 M1 for line drawn with gradient of 0.5 AND with a \(y\) intercept of 5 A1 for correct line between \(x = -2\) and \(x = 4\) SC : B2 for the correct line from \(x = 0\) to \(x = 4\)
13 You can use this conversion graph to change between kilograms and pounds.
Daniel’s weight is 9 stone 6 pounds.
1 stone = 14 pounds.
What is Daniel’s weight in kilograms? (3)
Mark scheme
Answer
Mark
Notes
60
3
M1 for 9 × 14 + 6 (=132) M1 (dep) for full method to convert ‘132’ from lbs to kg using the graph or for ‘132’ ÷ 2.2 (=60) A1 for 59 – 62 OR M1 for reading off 14 lbs (= 6.2 − 6.5) and 6 lbs (= 2.4 − 2.9) M1 (dep) for 9 × ‘6.4’ + ‘2.75’ A1 for 59 – 62 [SC B2 for 66]
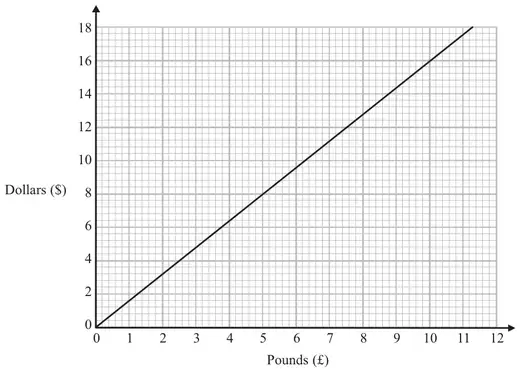
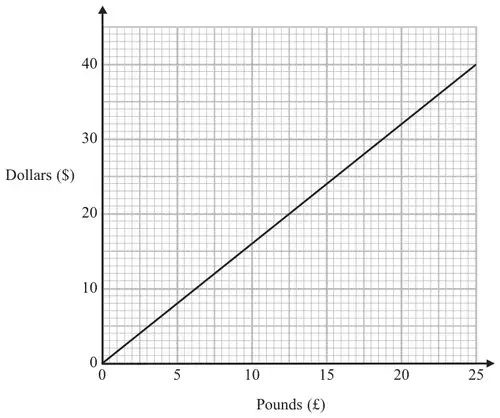
14 You can use this conversion graph to change between pounds (£) and dollars ($).
(a) Use the conversion graph to change £5 to dollars. (1)
Ella has $200 and £800 Her hotel bill is $600
Ella pays the bill with the $200 and some of the pounds.
(b) Use the conversion graph to work out how many pounds she has left. (4)
Mark scheme (a)
Answer
Mark
Notes
8
1
B1 for 8 (.00)
Mark scheme (b)
Answer
Mark
Notes
550
4
M1 for \(600 - 200\) (= 400) M1 for correct method to convert ‘$400’ to £ M1 (dep on the previous M1) for 800 − ‘$400’ in £s A1 for value in the range 540 – 560 OR M1 for correct method to convert $600 and $200 to pounds M1 for ‘375’ − ‘125’ M1 (dep on the previous M1) 800 − ‘250’ A1 for a value in the range 540-560 OR M1 for correct method to convert £800 to dollars M1 for ‘1280’ + 200 − 600 M1 (dep on the previous M1) for attempt to convert ‘$880’ back to £ A1 for value in the range 540 – 560
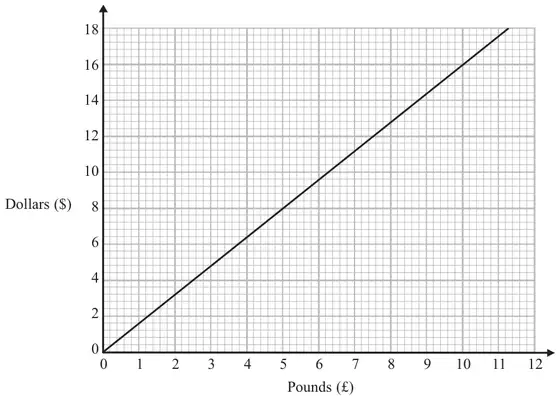
6 You can use this conversion graph to change between pounds (£) and dollars ($).
(a) Use the conversion graph to change £5 to dollars. (1)
Ella has $200 and £800 Her hotel bill is $600 Ella pays the bill with the $200 and some of the pounds.
(b) Use the conversion graph to work out how many pounds she has left. (4)
Mark scheme (a)
Answer
Mark
Notes
8
1
B1 for 8 (.00)
Mark scheme (b)
Answer
Mark
Notes
550
4
M1 for 600 – 200 ( = 400) M1 for correct method to convert ‘$400’ to £ M1 (dep on the previous M1) for 800 – ‘$400’ in £s A1 for value in the range 540 – 560 OR M1 for correct method to convert $600 and $200 to pounds M1 for ‘375’ – ‘125’ M1 (dep on the previous M1) 800 – ‘250’ A1 for a value in the range 540 – 560 OR M1 for correct method to convert £800 to dollars M1 for ‘1280’ + 200 – 600 M1 (dep on the previous M1) for attempt to convert ‘$880’ back to £ A1 for value in the range 540 – 560
(a) Complete the table of values for \(y = 2x + 5\)
\(x\)
\(-2\)
\(-1\)
0
1
2
\(y\)
1
5
(2)
(b) On the grid, draw the graph of \(y = 2x + 5\) for values of \(x\) from \(x = -2\) to \(x = 2\)(2)
Mark scheme (a)
Working
Answer
Mark
Notes
\(x\)
\(-2\)
\(-1\)
0
1
2
\(y\)
(1)
3
(5)
7
9
3, 7, 9
2
B2 for all three values correct in the table (B1 for 2 values correct)
Mark scheme (b)
Working
Answer
Mark
Notes
graph of \(y = 2x + 5\)
2
(From their table of values) M1 ft for plotting at least 2 of their points (any points from their table must be correctly plotted) A1 for correct line from \(x = -2\) to \(x = +2\)
(Use of \(y = mx + c\)) M1 for line drawn with gradient of 2 or line drawn with a \(y\) intercept of 5 and a positive gradient) A1 for correct line from \(x = -2\) to \(x = +2\)
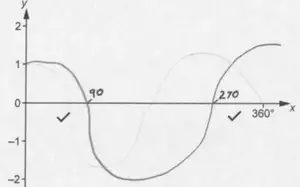
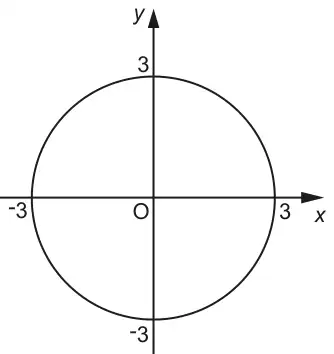
(a) On the grid, draw the graph of \(x^2 + y^2 = 4\) (2)
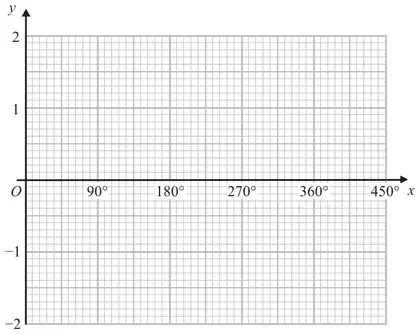
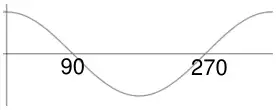
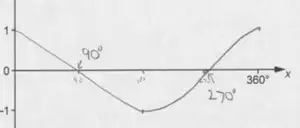
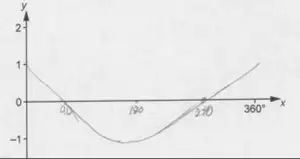
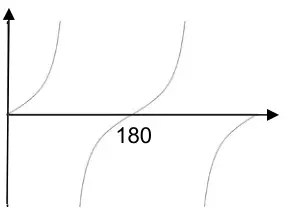
(b) On the grid, sketch the graph of \(y = \cos x\) for \(0^\circ \leqslant x \leqslant 360^\circ\) (2)
Mark scheme (a)
Answer
Mark
Notes
Circle, centre \(O\), radius 2
2
B2 cao (B1 for a circle radius 2 any centre or for a circle or part of a circle centre (0, 0) any radius)
Mark scheme (b)
Answer
Mark
Notes
Cosine curve crossing at (0, 1), (90, 0), (270, 0) and (360, 1)
2
B2 cao (ignore if sketch outside region) (B1 for a curve with correct intercepts but incorrect amplitude OR for a curve starting at (0,1) with correct amplitude but incorrect intercepts; curves must have a shape that approximates to a cosine curve)
M1 for a correct method to convert $100 to £, e.g. \(5 \times\) ‘12.50’ (= 62.50) (‘12.50’ is their reading from the graph at $20) M1 (dep) for ‘62.50’ − 60 A1 for £2.5(0) (units must be stated) OR M1 for correct method to convert £60 to $, e.g. \(3 \times 32\) (=96) or ft their answer to part (a) M1 (dep) for 100 − ‘96’ A1 for $4 (units must be stated)
21 On the grid, draw the graph of \(y = 3x - 2\) for values of \(x\) from \(-1\) to 3 (3)
Mark scheme
Working
Answer
Mark
Notes
x
−1
0
1
2
3
y
−5
−2
1
4
7
Straight line from (\(-1\), \(-5\)) to (3, 7)
3
(Table of values) M1 for at least 2 correct attempts to find points by substituting values of \(x\). M1 ft for plotting at least 2 of their points (any points plotted from their table must be correctly plotted) A1 for correct line between \(-1\) and 3
(No table of values) M2 for at least 2 correct points (and no incorrect points) plotted OR line segment of \(y = 3x - 2\) drawn (ignore any additional incorrect segments) (M1 for at least 3 correct points plotted with no more than 2 incorrect points) A1 for correct line between \(-1\) and 3
(Use of \(y = mx + c\)) M2 for line segment of \(y = 3x - 2\) drawn (ignore any additional incorrect segments) (M1 for line drawn with gradient of 3 OR line drawn with a \(y\) intercept of \(-2\) and a positive gradient) A1 for correct line between \(-1\) and 3
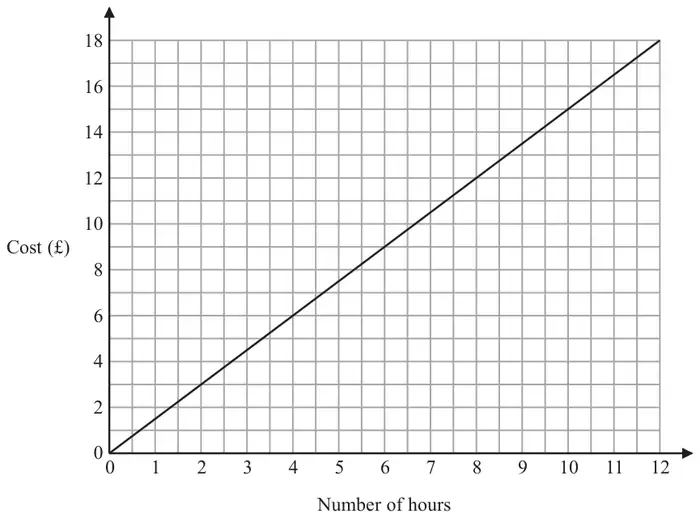
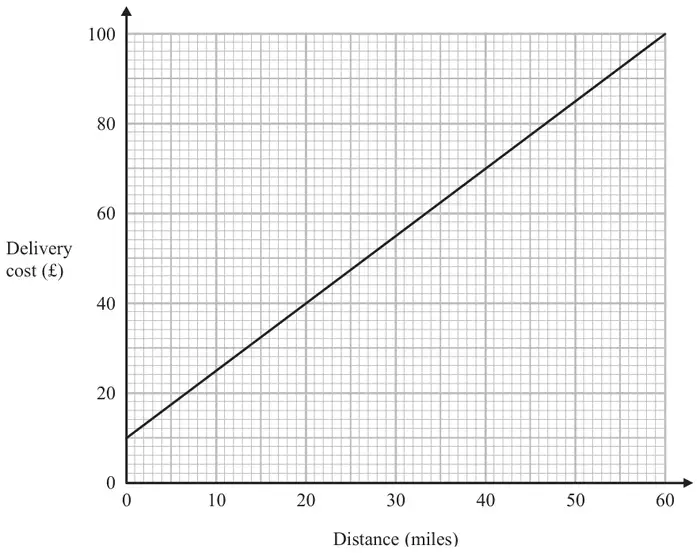
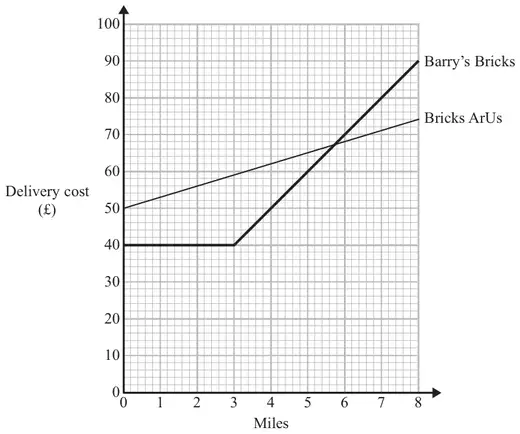
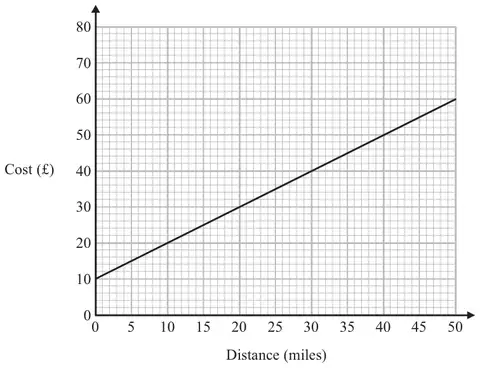
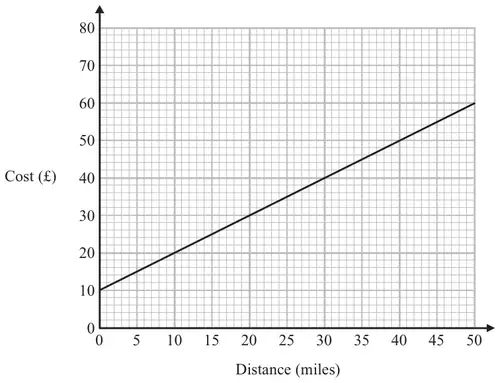
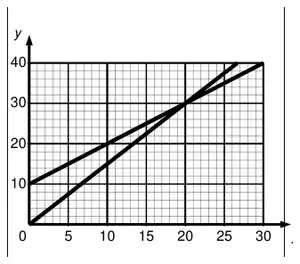
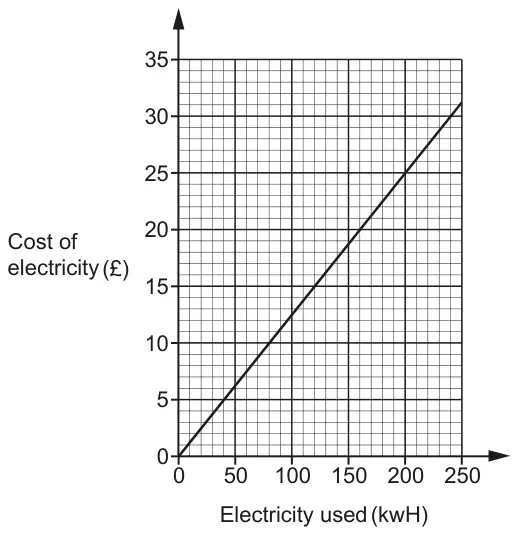
*18 Bill uses his van to deliver parcels. For each parcel Bill delivers there is a fixed charge plus £1.00 for each mile.
You can use the graph to find the total cost of having a parcel delivered by Bill.
(a) How much is the fixed charge? (1)
Ed uses a van to deliver parcels. For each parcel Ed delivers it costs £1.50 for each mile. There is no fixed charge.
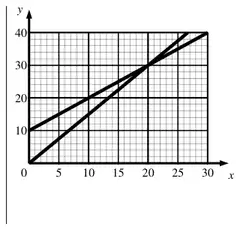
(b) Compare the cost of having a parcel delivered by Bill with the cost of having a parcel delivered by Ed. (3)
Mark scheme (a)
Answer
Mark
Notes
10
1
B1 cao
Mark scheme (b)
Working
Answer
Mark
Notes
Miles
0
10
20
30
40
50
Ed
0
15
30
45
60
75
Bill
10
20
30
40
50
60
Ed is cheaper up to 20 miles, Bill is cheaper for more than 20 miles
3
M1 for correct line for Ed intersecting at (20,30) ±1 sq tolerance or \(10 + x = 1.5x\) oe C2 (dep on M1) for a correct full statement ft from graph eg. Ed cheaper up to 20 miles and Bill cheaper for more than 20 miles (C1 (dep on M1) for a correct conclusion ft from graph eg. cheaper at 10 miles with Ed; eg. cheaper at 50 miles with Bill eg. same cost at 20 miles; eg for £5 go further with Bill or A general statement covering short and long distances eg. Ed is cheaper for shorter distances and Bill is cheaper for long distances)
OR M1 for correct method to work out Ed’s delivery cost for at least 2 values of \(n\) miles where \(0 \lt n \leqslant 50\) or for correct method to work out Ed and Bill’s delivery cost for \(n\) miles where \(0 \lt n \leqslant 50\) C2 (dep on M1) for 20 miles linked with £30 for Ed and Bill with correct full statement eg. Ed cheaper up to 20 miles and Bill cheaper for more than 20 miles (C1 (dep on M1) for a correct conclusion eg. cheaper at 10 miles with Ed; eg. cheaper at 50 miles with Bill eg. same cost at 20 miles; eg for £5 go further with Bill or A general statement covering short and long distances eg. Ed is cheaper for shorter distances and Bill is cheaper for long distances) SC: B1 for correct full statement seen with no working eg. Ed cheaper up to 20 miles and Bill cheaper for more than 20 miles QWC Decision and justification should be clear with working clearly presented and attributable
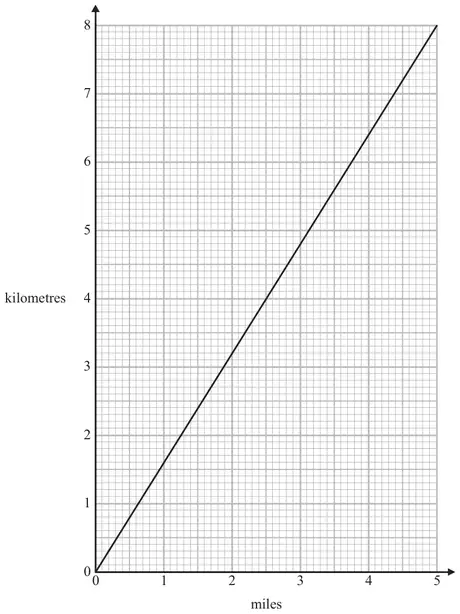
12 You can use the graph to change between miles and kilometres.
(a) Change 3 miles into kilometres. kilometres (1)
(b) Change 60 kilometres into miles. miles (2)
Mark scheme (a)
Answer
Mark
Notes
4.8
1
B1 for answer in range 4.6 – 5
Mark scheme (b)
Answer
Mark
Notes
37.5
2
M1 for a valid method eg reading from graph for 6 km then \(\times 10\) A1 for answer in range 35 – 40 OR M1 for use of conversion factor \(60 \times 5/8\) oe A1 for answer in range 35 – 40
4 On the grid, draw the graph of \(y = 3x - 2\) for values of \(x\) from \(-1\) to 3 (3)
Mark scheme
Working
Answer
Mark
Notes
\(x\)
\(-1\)
0
1
2
3
\(y\)
\(-5\)
\(-2\)
1
4
7
OR Using \(y = mx + c\) gradient = 3 \(y\) intercept = \(-2\)
Straight line from \((-1, -5)\) to \((3, 7)\)
3
(Table of values) M1 for at least 2 correct attempts to find points by substituting values of \(x\). M1 ft for plotting at least 2 of their points (any points plotted from their table must be correctly plotted) A1 for correct line between \(-1\) and 3 (No table of values) M2 for at least 2 correct points (and no incorrect points) plotted OR line segment of \(y = 3x - 2\) drawn (ignore any additional incorrect segments) (M1 for at least 3 correct points plotted with no more than 2 incorrect points) A1 for correct line between \(-1\) and 3 (Use of \(y = mx + c\)) M2 for line segment of \(y = 3x - 2\) drawn (ignore any additional incorrect segments) (M1 for line drawn with gradient of 3 OR line drawn with a \(y\) intercept of \(-2\) and a positive gradient) A1 for correct line between \(-1\) and 3
3 Bill uses his van to deliver parcels. For each parcel Bill delivers there is a fixed charge plus £1.00 for each mile.
You can use the graph to find the total cost of having a parcel delivered by Bill.
(a) How much is the fixed charge? (1)
Ed uses a van to deliver parcels. For each parcel Ed delivers it costs £1.50 for each mile. There is no fixed charge.
*(b) Compare the cost of having a parcel delivered by Bill with the cost of having a parcel delivered by Ed. (3)
Mark scheme (a)
Answer
Mark
Notes
10
1
B1 cao
Mark scheme (b)
Working
Answer
Mark
Notes
Miles
0
10
20
30
40
50
Ed
0
15
30
45
60
75
Bill
10
20
30
40
50
60
Ed is cheaper up to 20 miles, Bill is cheaper for more than 20 miles
3
M1 for correct line for Ed intersecting at (20,30) ±1 sq tolerance or \(10 + x = 1.5x\) oe C2 (dep on M1) for a correct full statement ft from graph eg. Ed cheaper up to 20 miles and Bill cheaper for more than 20 miles (C1 (dep on M1) for a correct conclusion ft from graph eg. cheaper at 10 miles with Ed ; eg. cheaper at 50 miles with Bill eg. same cost at 20 miles; eg for £5 go further with Bill OR A general statement covering short and long distances eg. Ed is cheaper for shorter distances and Bill is cheaper for long distances)
OR M1 for correct method to work out Ed’s delivery cost for at least 2 values of \(n\) miles where \(0 \lt n \leqslant 50\) OR for correct method to work out Ed and Bill’s delivery cost for \(n\) miles where \(0 \lt n \leqslant 50\) C2 (dep on M1) for 20 miles linked with £30 for Ed and Bill with correct full statement eg. Ed cheaper up to 20 miles and Bill cheaper for more than 20 miles (C1 (dep on M1) for a correct conclusion eg. cheaper at 10 miles with Ed ; eg. cheaper at 50 miles with Bill eg. same cost at 20 miles; eg for £5 go further with Bill OR A general statement covering short and long distances eg. Ed is cheaper for shorter distances and Bill is cheaper for long distances)
SC : B1 for correct full statement seen with no working eg. Ed cheaper up to 20 miles and Bill cheaper for more than 20 miles QWC: Decision and justification should be clear with working clearly presented and attributable
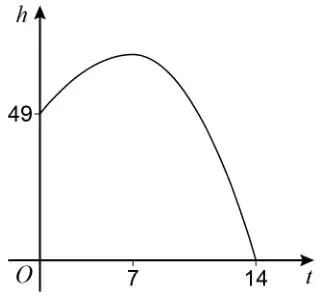
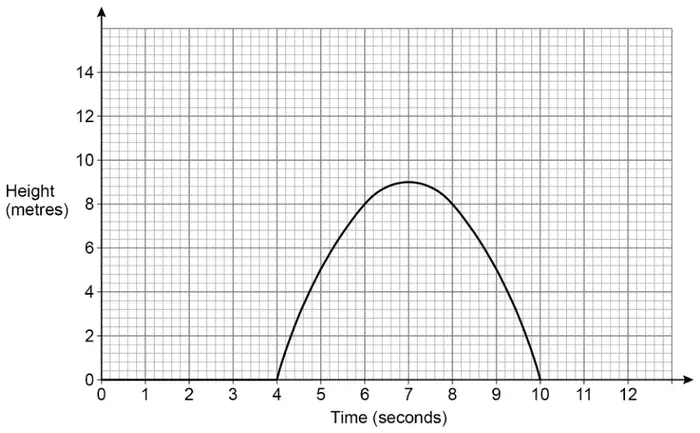
The height above ground level, \(h\), in metres, of the roller coaster is given by
\[h = -(t - 7)^2 + 49\]
where \(t\) is the time in seconds after the roller coaster starts.
Sam draws a graph of \(h\) against \(t\) for \(\quad 0 \leqslant t \leqslant 14\)
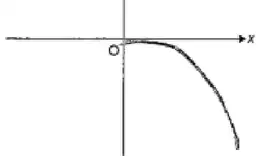
Make two criticisms of Sam’s graph. [2 marks]
Mark scheme
Answer
Mark
Comments
Any two from valid criticism about the \(h\)-intercept or valid criticism about the maximum point or valid criticism about the non-linear scaling on the horizontal axis
B2
eg graph should go through (0, 0) graph should intercept when \(h = 0\) \(y\)-intercept should be 0 eg the maximum point should be (7, 49) at \(t = 7\), \(h\) should be 49 eg 0, 7 and 14 should be evenly spaced B1 any one valid criticism
Additional guidance
Allow use of \(y\) for \(h\) or use of \(x\) for \(t\)
Each criticism may be implied by a correct, unambiguous graph drawn
11 Here is a table of values for the equation \(\quad y = 3x + 1\)
\(x\)
1
2
3
4
\(y\)
4
7
10
13
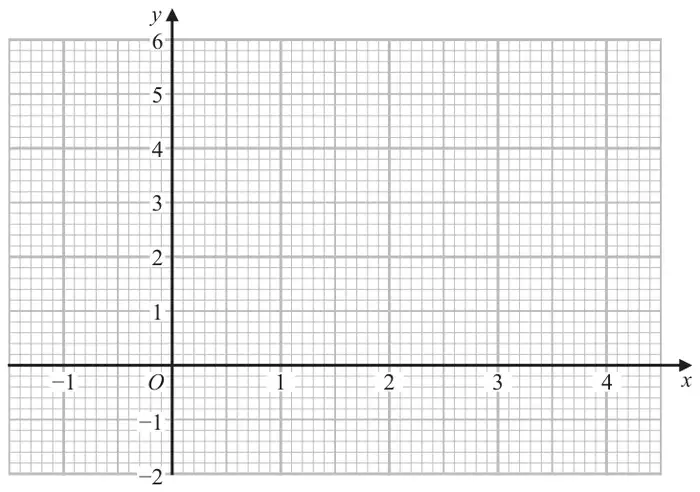
(a) Draw the graph of \(\quad y = 3x + 1 \quad\) for values of \(x\) from 1 to 4 [2 marks]
(b) Work out the value of \(y\) when \(\; x = 2.5\) [2 marks]
Mark scheme (a)
Answer
Mark
Comments
All 4 points plotted correctly with a straight line joining them
B2
\(\pm\)\(\dfrac{1}{2}\) square B1 at least two correct points plotted mark intention for straight line
Additional guidance
Ignore additional or incorrect points for B2 or B1
Ignore any line or curve extended outside the range
The correct position of the line implies correctly plotted points
Mark scheme (b)
Answer
Mark
Comments
Alternative method 1: uses the graph
Vertical line from \(x = 2.5\) to their straight line
M1
\(\pm\)\(\dfrac{1}{2}\) square implied by mark at correct point on graph or on vertical axis
their 8.5
A1ft
\(\pm\)\(\dfrac{1}{2}\) square ft their straight line graph if at least B1 awarded in (a)
Alternative method 2: substitutes into the equation
\(3 \times 2.5 + 1\)
M1
oe
8.5
A1
Alternative method 3: uses values from the table
\(\dfrac{7 + 10}{2}\)
M1
oe eg \(\dfrac{4 + 7 + 10 + 13}{4}\)
8.5
A1
Additional guidance
Alternative method 1 – must have a line in part (a)
Alternative method 1 A vertical line from the \(x\)-axis does not need to be drawn if the reading from the graph is correct within tolerance for their graph
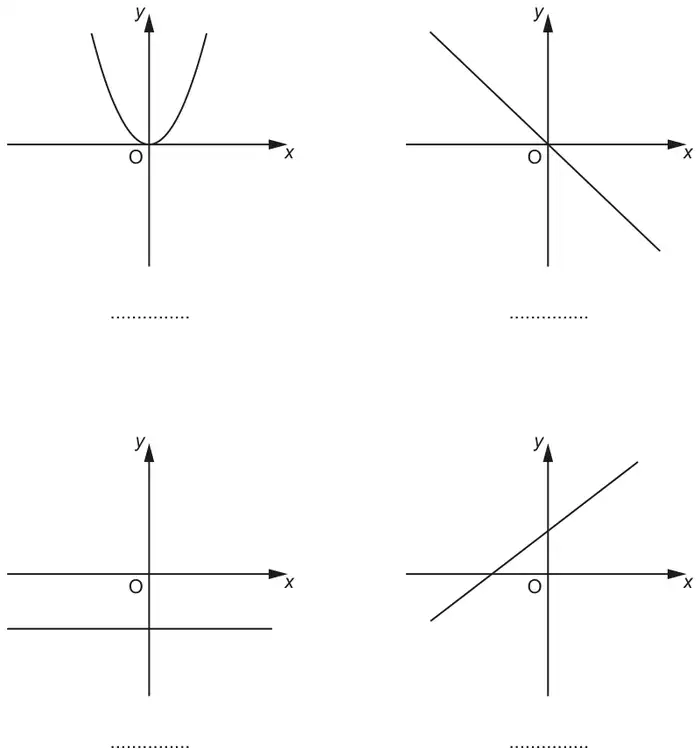
line \(\ldots\ldots\ldots\) and line \(\ldots\ldots\ldots\)
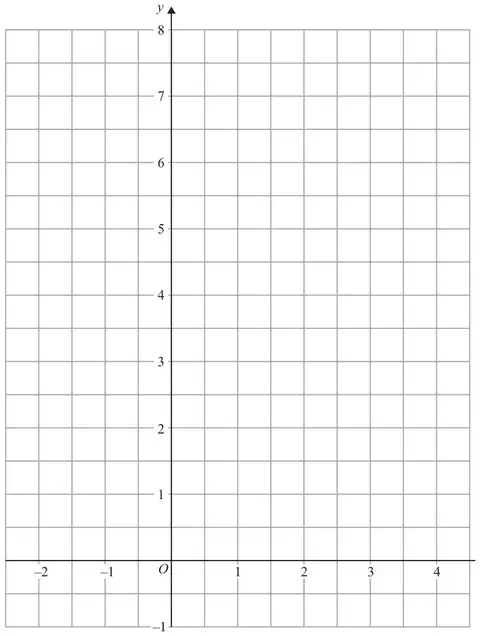
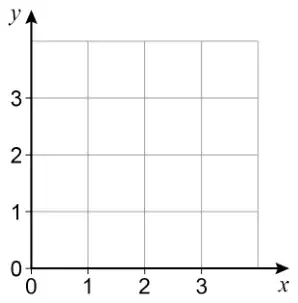
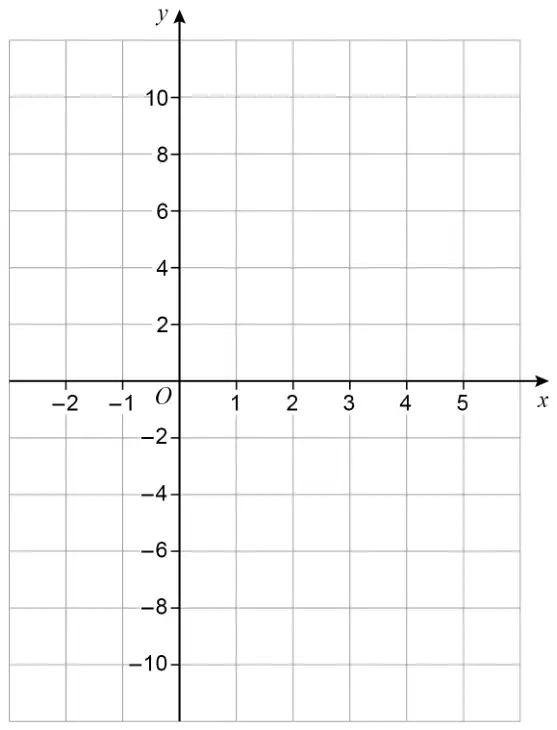
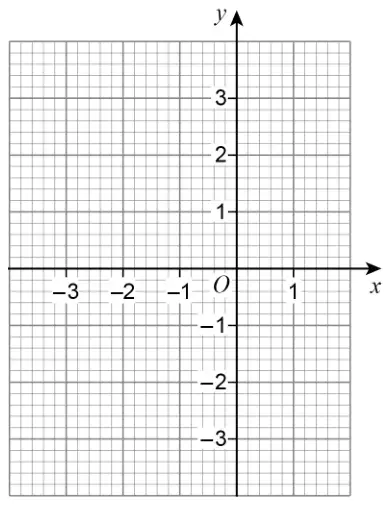
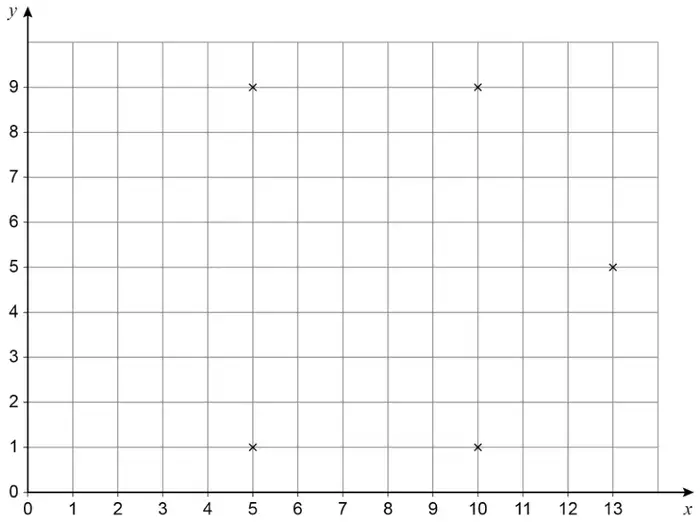
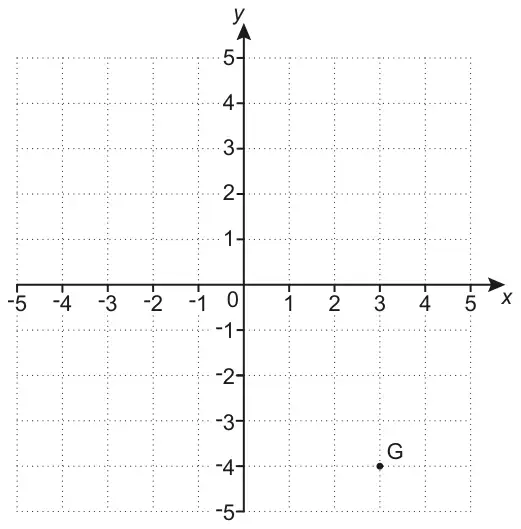
(b) Here is a different grid.
There are four points on this grid that each have
both coordinates that are whole numbers and \(x\)-coordinate \(+\) \(y\)-coordinate \(= 3\)
Plot the four points on the grid. [2 marks]
Mark scheme (a)
Answer
Mark
Comments
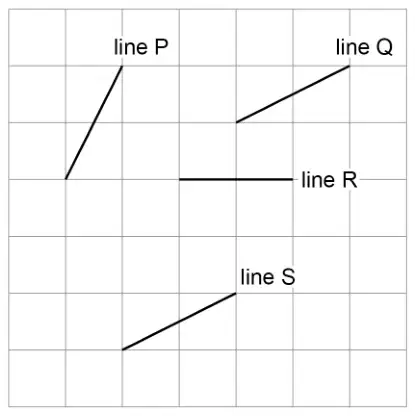
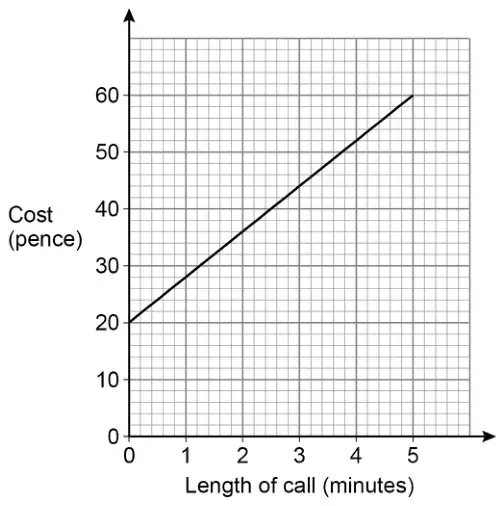
line Q and line S
B1
either order, may be indicated on the diagram
Mark scheme (b)
Answer
Mark
Comments
(0, 3), (1, 2), (2, 1) and (3, 0) plotted with no other points plotted on the grid
B2
B1 at least two of (0, 3), (1, 2), (2, 1) and (3, 0) plotted with up to two other points plotted on the grid or at least four points plotted that would lie on the line \(x + y = 3\) where each \(x\) and \(y\) are not all integers, with no other points plotted on the grid or all four correct coordinates given but not plotted, with no additional coordinates
Additional guidance
Mark intention
Line joining the four correct points with only the four correct points plotted
B2
Line connecting the four correct points but without points plotted
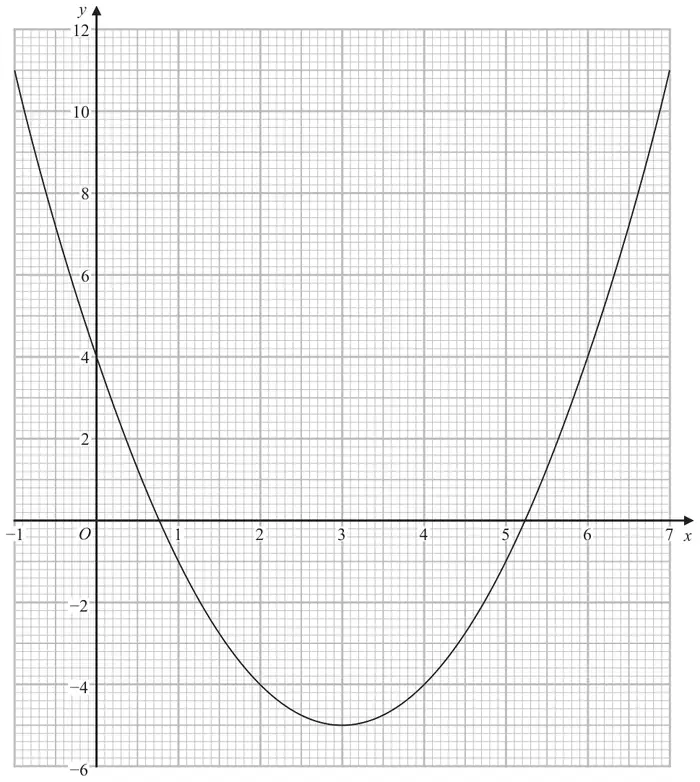
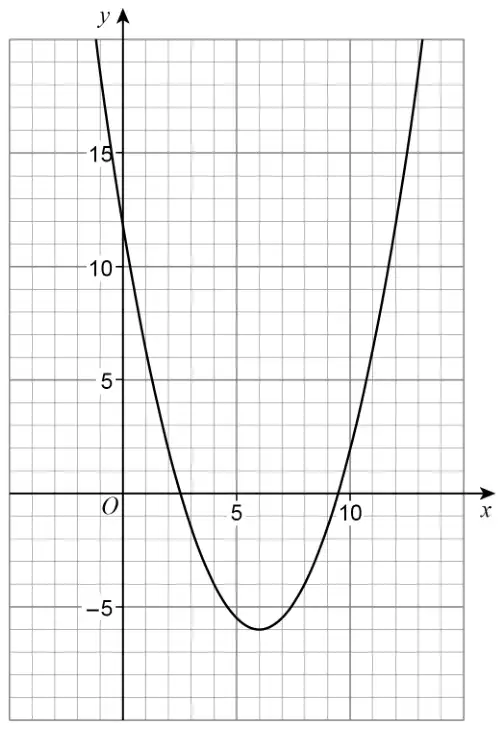
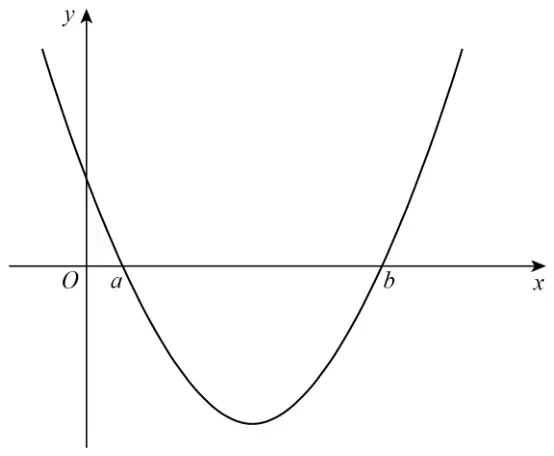
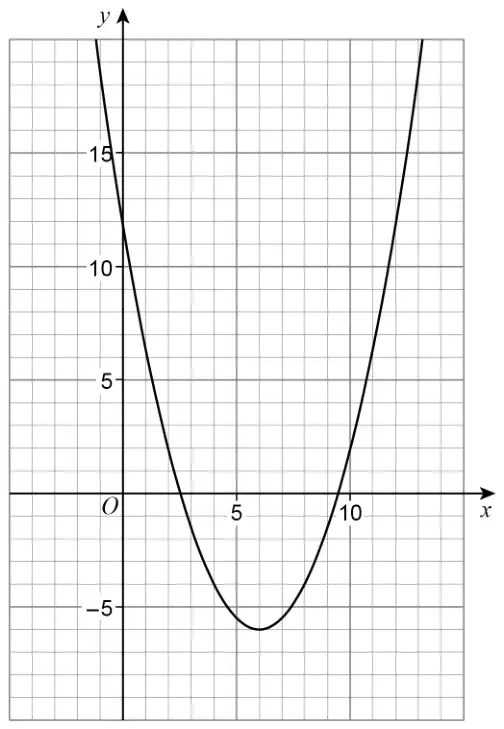
26 Here is the graph of \(\quad y = 0.5x^2 - 6x + 12\)
Use the graph to estimate the solutions of \(\quad 0.5x^2 - 6x + 12 = 0\) [2 marks]
Mark scheme
Answer
Mark
Comments
\((x =)\ [2.25, 2.75]\) and \((x =)\ [9.25, 9.75]\)
B2
B1 \((x =)\ [2.25, 2.75]\) or \((x =)\ [9.25, 9.75]\) or one or both values identified but not given in correct notation eg (2.5, 0) and/or (9.5, 0) or \(2.5 \lt x \lt 9.5\) or 2.5 and/or 9.5 written on the graph or in working
Additional guidance
\(x =\) can be \(x \approx\)
[2.25, 2.75] and/or [9.25, 9.75] with one extra value
B1
[2.25, 2.75] and/or [9.25, 9.75] with more than one extra value
B0
Answer from use of formula or completing the square
At least three of \(\dfrac{1}{2} \times 10 \times 3.2\) or 16 and \(\dfrac{1}{2} \times (3.2 + 5.8) \times 10\) or 45 and \(\dfrac{1}{2} \times (5.8 + 7.4) \times 10\) or 66 and \(\dfrac{1}{2} \times (7.4 + 6) \times 10\) or 67
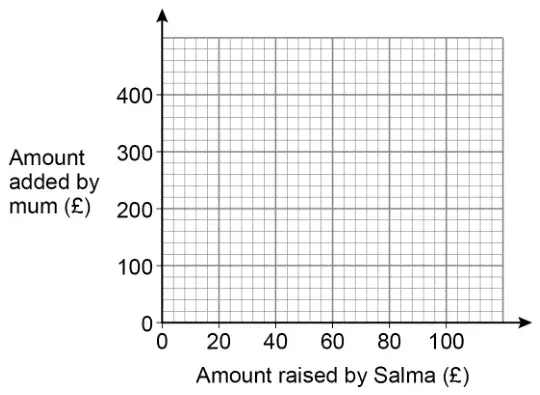
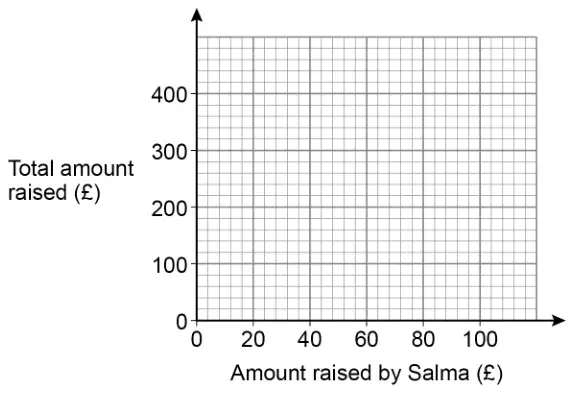
“Whatever amount you raise, I will add double that amount.”
Show this information by drawing a graph on each grid below. [2 marks]
Mark scheme
Answer
Mark
Comments
First graph is a straight line from (0, 0) to (100, 200) and second graph is a straight line from (0, 0) to (100, 300)
B2
B1 first graph is a straight line from (0, 0) to (100, 200) or second graph is a straight line from (0, 0) to (100, 300) or both graphs correct, but one or both does not reach to 0 or 100 on the horizontal axis or at least 3 correct points plotted on both graphs or B1ft first graph is an incorrect horizontal or increasing straight line to 100 on the horizontal axis, and second graph is a correct ft graph to 100 on the horizontal axis (must be joined)
Additional guidance
Ignore graphs to the right of 100 on the horizontal axes
B1ft can only be awarded if the graph fits onto the grid up to (100, 500)
9 Here is the graph of \(\quad y = 0.5x^2 - 6x + 12\)
Use the graph to estimate the solutions of \(\quad 0.5x^2 - 6x + 12 = 0\) [2 marks]
Mark scheme
Answer
Mark
Comments
\((x =)\) [2.25, 2.75] and \((x =)\) [9.25, 9.75]
B2
B1 \((x =)\) [2.25, 2.75] or \((x =)\) [9.25, 9.75] or one or both values identified but not given in correct notation eg \((2.5, 0)\) and/or \((9.5, 0)\) or \(2.5 \lt x \lt 9.5\) or 2.5 and/or 9.5 written on the graph or in working
Additional guidance
\(x =\) can be \(x \approx\)
[2.25, 2.75] and/or [9.25, 9.75] with one extra value
B1
[2.25, 2.75] and/or [9.25, 9.75] with more than one extra value
B0
Answer from use of formula or completing the square
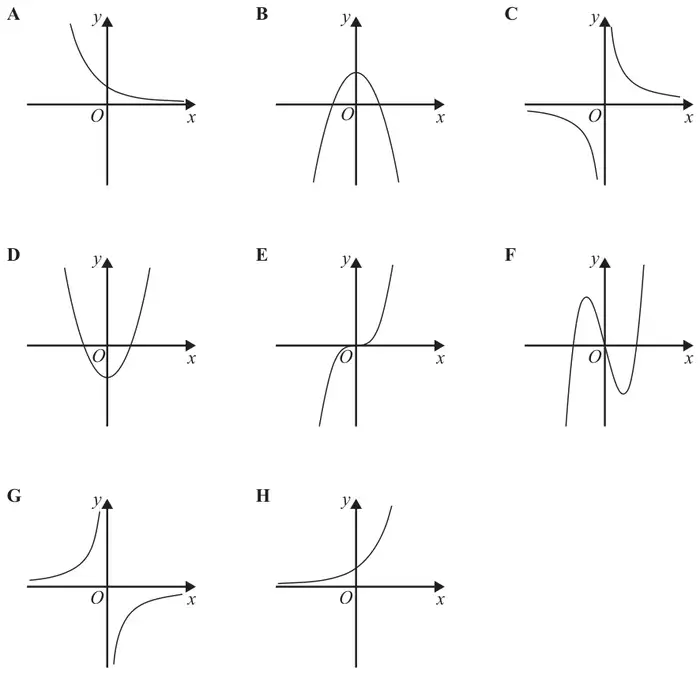
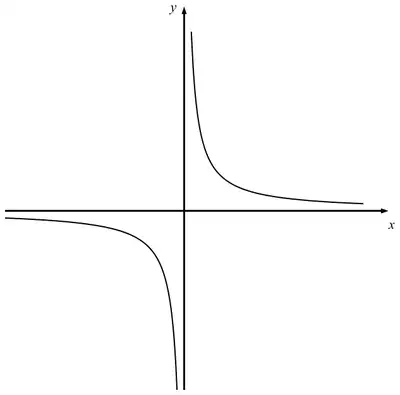
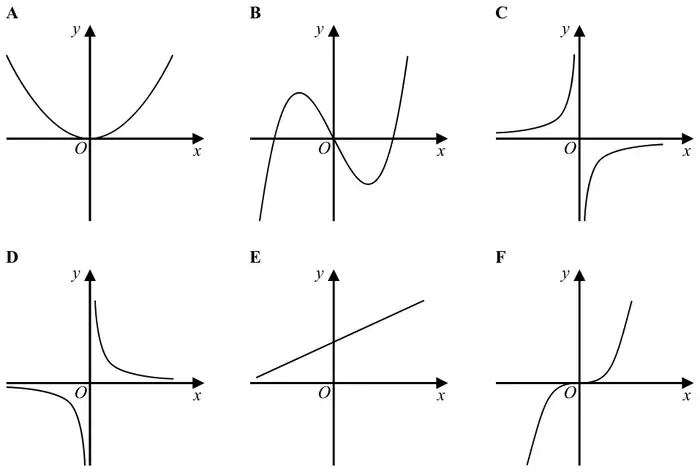
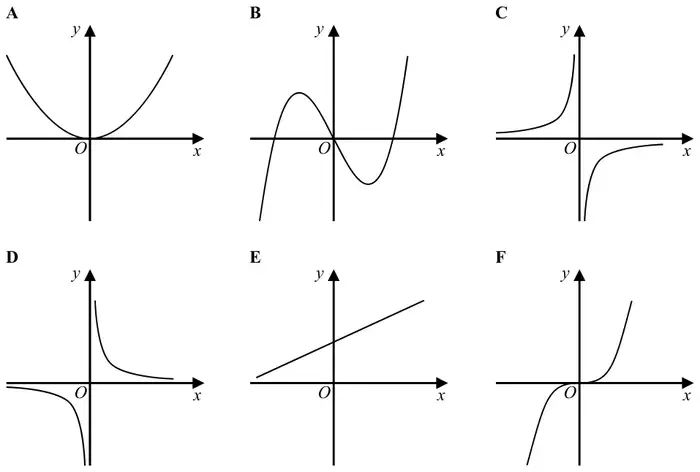
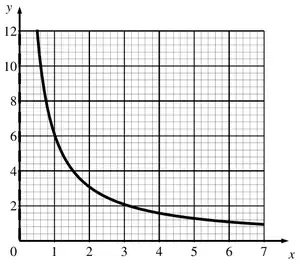
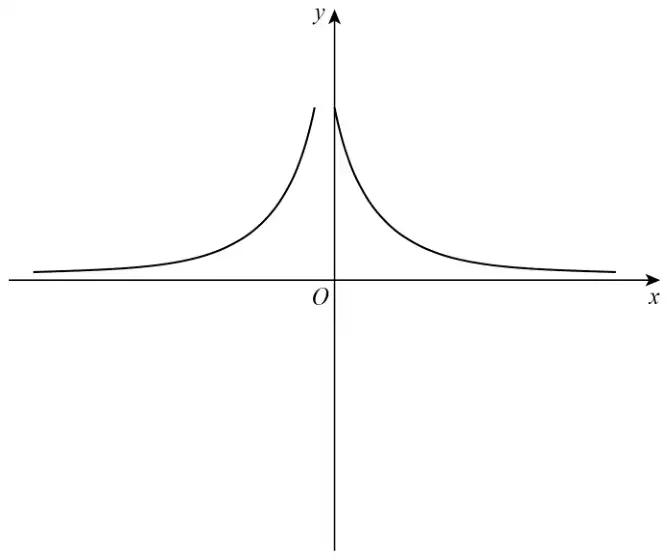
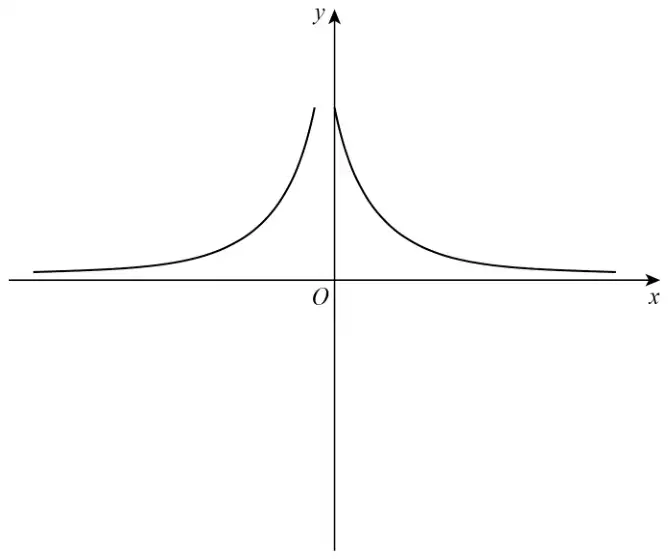
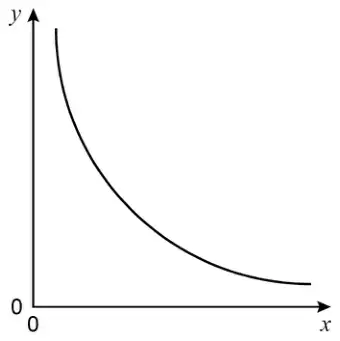
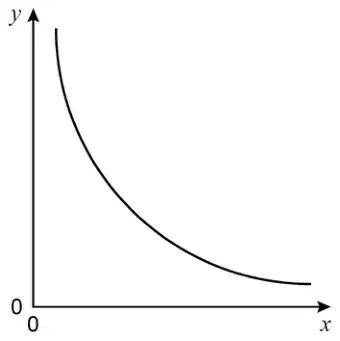
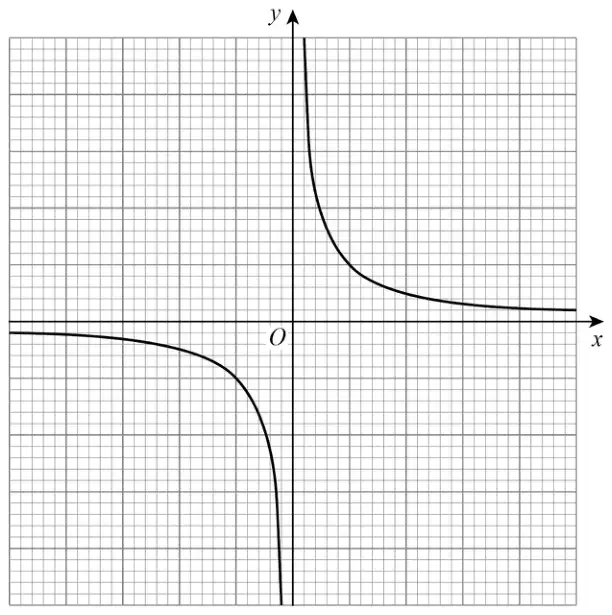
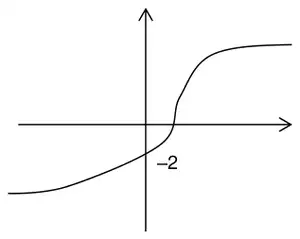
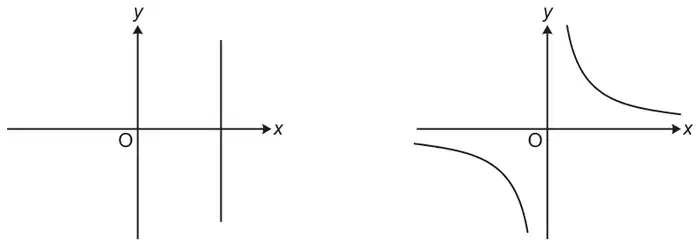
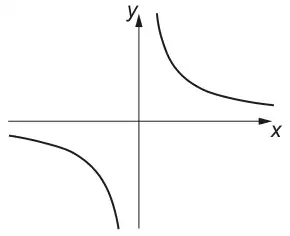
23 Erika tries to sketch the graph \(\quad y = \dfrac{1}{x} \quad\) with \(\;x \neq 0\)
Make two different criticisms of her sketch. [2 marks]
Mark scheme
Answer
Mark
Comments
Any two from: Reference to graph passing through point where \(x = 0\) Reference to graph being incorrect for negative \(x\) values Reference to the graph stopping before the end of the axes/axis
B2
B1 any one correct reference eg the graph touches the \(y\)-axis eg the graph to the left of the \(y\)-axis should be below the \(x\)-axis eg the graph should go to the ends of the axes
Additional guidance
Ignore non-contradictory, irrelevant responses alongside a correct response
Draws correct graph
B2
Draws graph with one section correct for positive values of \(x\) or negative values of \(x\)
B1 for that section
‘It isn’t the graph of \(y = \dfrac{1}{x}\)’ scores B0, but B1 may still be scored for the other criticism
‘There are no numbers on the axes’ scores B0, but B1 may still be scored for the other criticism
Mark for graph touching \(y\)-axis
You cannot have \(x = 0\)
B1
The line in the top right should be moved to the right
B1
It says \(x\) doesn’t \(= 0\) but it (the sketch) does
B1
One line is touching the \(y\)-axis
B1
The lines should be symmetrical
B0
You cannot have \(y = 0\)
B0
One line is touching the \(y\)-axis but the other isn’t
B0
Mark for negative values being in the wrong quadrant
There shouldn’t be anything in the top-left section
B1
There should be something in the bottom-left section
B1
It is the graph of \(y = \dfrac{1}{x^2}\)
B1
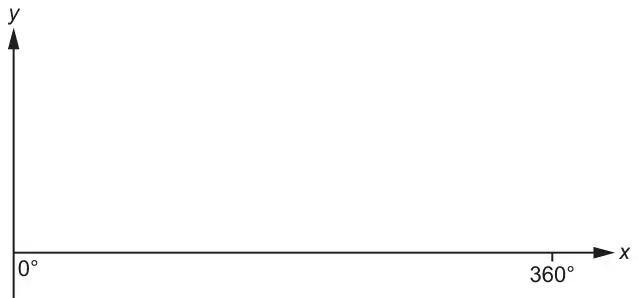
It should have rotational symmetry
B1
It should be symmetrical about \(y = x\)
B1
It should be symmetrical about \(y = -x\)
B1
It should be symmetrical
B0
One should be negative
B0
The bit on the left is wrong
B0
The negative values are plotted incorrectly
B0
Reference to the graph stopping before the end of the axes
9 Erika tries to sketch the graph \(\quad y = \dfrac{1}{x} \quad\) with \(\ x \neq 0\)
Make two different criticisms of her sketch. [2 marks]
Mark scheme
Answer
Mark
Comments
Any two from: Reference to graph passing through point where \(x = 0\) Reference to graph being incorrect for negative \(x\) values Reference to the graph stopping before the end of the axes/axis
B2
B1 any one correct reference eg the graph touches the \(y\)-axis eg the graph to the left of the \(y\)-axis should be below the \(x\)-axis eg the graph should go to the ends of the axes
Additional guidance
Ignore non-contradictory, irrelevant responses alongside a correct response
Draws correct graph
B2
Draws graph with one section correct for positive values of \(x\) or negative values of \(x\)
B1 for that section
‘It isn’t the graph of \(y = \dfrac{1}{x}\)’ scores B0, but B1 may still be scored for the other criticism
‘There are no numbers on the axes’ scores B0, but B1 may still be scored for the other criticism
Mark for graph touching \(y\)-axis
You cannot have \(x = 0\)
B1
The line in the top right should be moved to the right
B1
It says \(x\) doesn’t \(= 0\) but it (the sketch) does
B1
One line is touching the \(y\)-axis
B1
The lines should be symmetrical
B0
You cannot have \(y = 0\)
B0
One line is touching the \(y\)-axis but the other isn’t
B0
Mark for negative values being in the wrong quadrant
There shouldn’t be anything in the top-left section
B1
There should be something in the bottom-left section
B1
It is the graph of \(y = \dfrac{1}{x^2}\)
B1
It should have rotational symmetry
B1
It should be symmetrical about \(y = x\)
B1
It should be symmetrical about \(y = -x\)
B1
It should be symmetrical
B0
One should be negative
B0
The bit on the left is wrong
B0
The negative values are plotted incorrectly
B0
Reference to the graph stopping before the end of the axes
For eg \(40 - 24 = 16\) condone \(24 - 40 = 16\) or \(24 - 40 = -16\)
Condone incorrect use of equals sign eg \(1.2 \times 20 = 24 + 16 = 40\) or \(1.2 \times 20 = 24 - 40 = 16\)
B1
Correct response with irrelevant work
B1
16 from two different ways with one way incorrect is choice eg \(1.2 \times 20 = 24\) and \(40 - 24 = 16\) and \(20 \div 1.2 = 16\)
B0
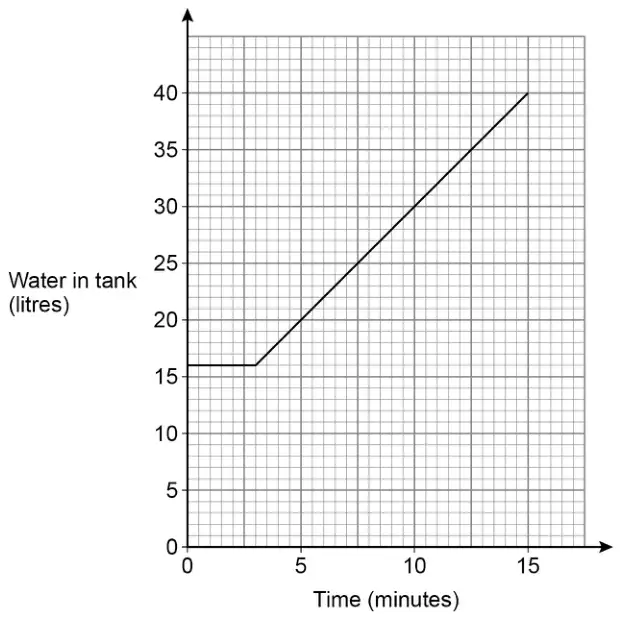
Mark scheme (b)
Answer
Mark
Comments
3
B1
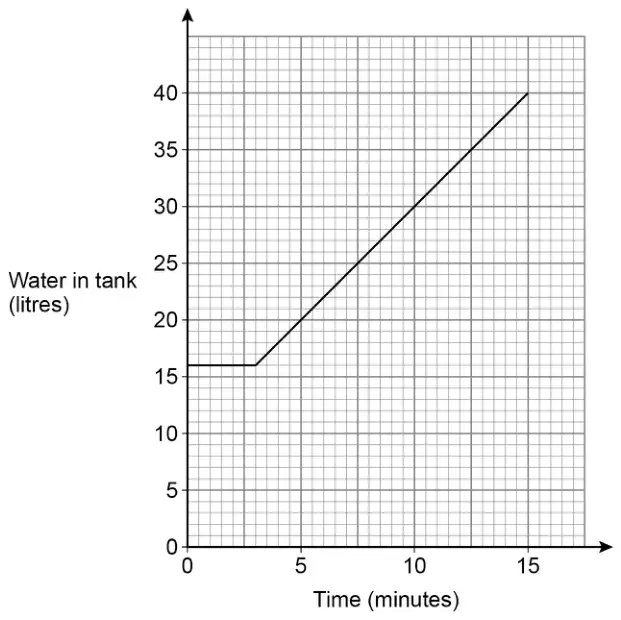
Correct method for gradient eg \(\dfrac{40 - 16}{15 - \text{their } 3}\) or \(\dfrac{24}{12}\)
M1
oe eg \(\dfrac{30 - 25}{10 - 7.5}\) or \(\dfrac{10}{5}\) or \(40 - 38\)
2
A1ft
correct or ft their 3
Additional guidance
Note that their 3 can be used to work out the rate but does not have to be
Values seen on graph must be used correctly eg 24 and 12 seen on the graph is M0 unless subsequently used correctly in attempt to work out the gradient
A1ft answers must be to 1 dp or better eg 3.5 \(\dfrac{40 - 16}{15 - 3.5}\) 2.1 (accept 2.08…)
B0 M1 A1ft
After B0 the method may be implied (use \(\dfrac{40 - 16}{15 - \text{their } 3}\) to check) eg 6 2.7 (accept 2.66…)
B0 M1A1ft
If the report is blank, 3 and 2 must be unambiguously identified in working to be acceptable
The \(x\)-values in the table make a linear sequence.
The \(y\)-values in the table make a different linear sequence.
(a) Complete the table. [2 marks]
(b) Draw a straight line passing through the points (0, 3), (2, 7) and (4, 11) [2 marks]
(c) Use the graph to work out the value of \(y\) when \(\;x = 3\) [1 mark]
Mark scheme (a)
Answer
Mark
Comments
\((x =)\) 10 and \((y =)\) 15
B2
B1 \((x =)\) 10 or \((y =)\) 15
Additional guidance
\(x\)
0
2
4
6
8
10
\(y\)
3
7
11
15
19
23
B2
Mark scheme (b)
Answer
Mark
Comments
Straight line from (0, 3) to (4, 11)
B2
B1 at least two of (0, 3), (2, 7) and (4, 11) plotted or straight line from (0, 3) to (2, 7) or straight line from (2, 7) to (4, 11) \(\pm\dfrac{1}{2}\) square
Additional guidance
B2 or B1 may be awarded for a straight line without points plotted
Mark intention
Ignore line drawn after (4, 11)
Two points plotted with the same \(x\)-coordinate is choice unless the line is drawn through one of the points
Mark scheme (c)
Answer
Mark
Comments
9
B1ft
correct or ft their line in (b) \(\pm\dfrac{1}{2}\) square
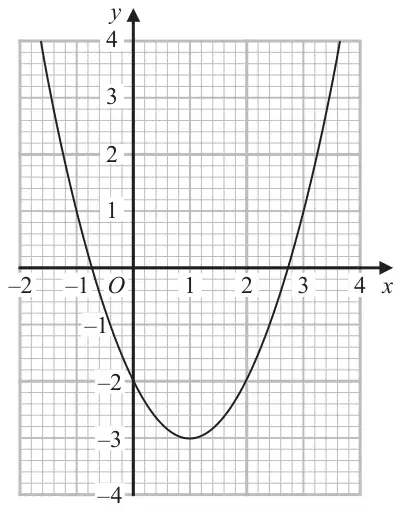
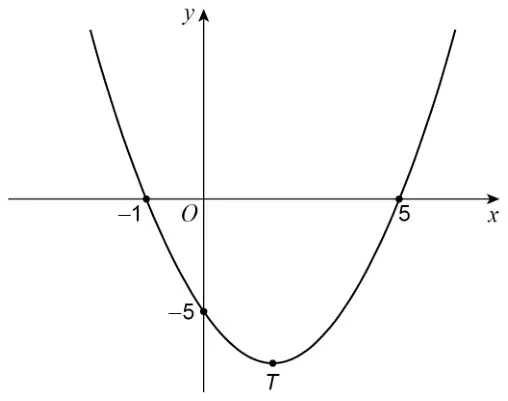
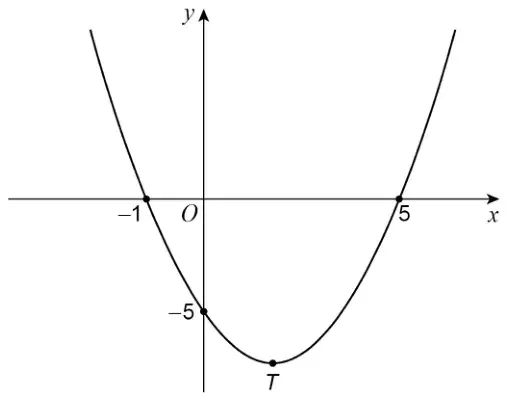
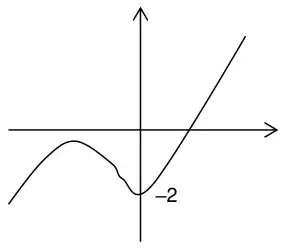
23 Here is a sketch of the curve \(\quad y = x^2 - 4x - 5\)
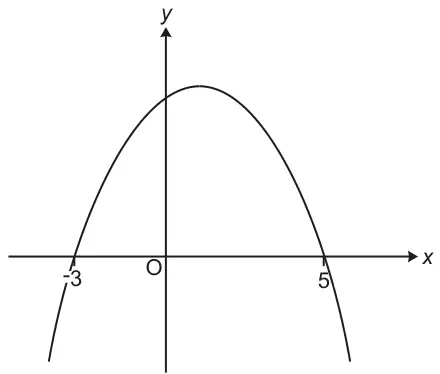
(a) Write down the two roots of \(\quad x^2 - 4x - 5 = 0\) [1 mark]
(b) Work out the coordinates of \(T\), the turning point of the curve. [2 marks]
Mark scheme (a)
Answer
Mark
Comments
\(-1\) and 5
B1
either order
Additional guidance
Ignore \(x =\) written before answers
\((-1, 0)\) or \((5, 0)\)
B0
Mark scheme (b)
Answer
Mark
Comments
\((2, -9)\)
B2
B1 \(x = 2\) or \((2, \ldots)\) or \(y = -9\) or \((\ldots, -9)\) or \((x - 2)^2 - 9\) B1ft correct \(y\)-coordinate for their \(x\)-coordinate with \(x \ne -1\), 0 or 5 SC1 \((-9, 2)\)
Additional guidance
If answer line is blank, check diagram for indication of \(x\) or \(y\) values
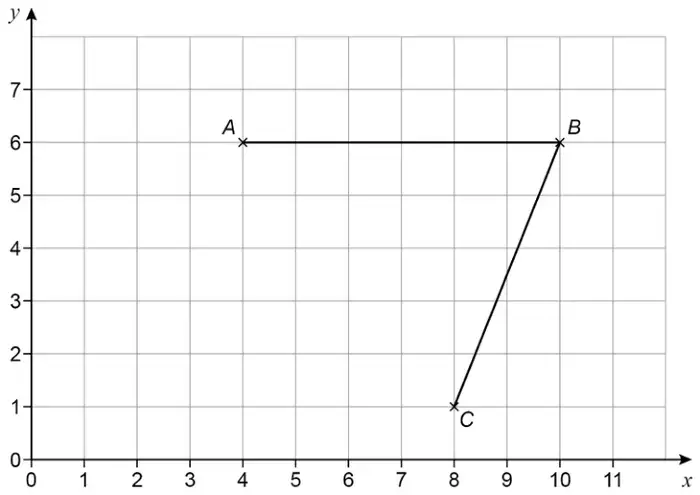
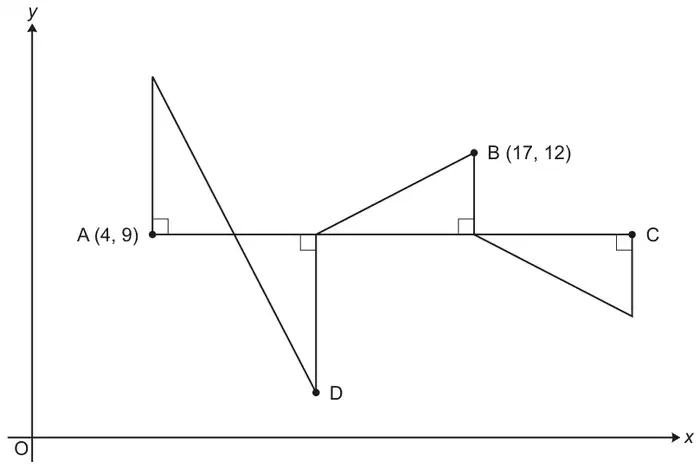
(b) Write down the coordinates of the midpoint of \(AB\). [1 mark]
(c) \(D\) is the point on the grid that makes \(ABCD\) a parallelogram.
Work out the coordinates of \(D\). [1 mark]
(d) Write down the equation of the line passing through \(A\) and \(B\). [1 mark]
Mark scheme (a)
Answer
Mark
Comments
(8, 1)
B1
accept \((\overset{x}{8},\ \overset{y}{1})\)
Additional guidance
\((8x, 1y)\)
B0
Mark scheme (b)
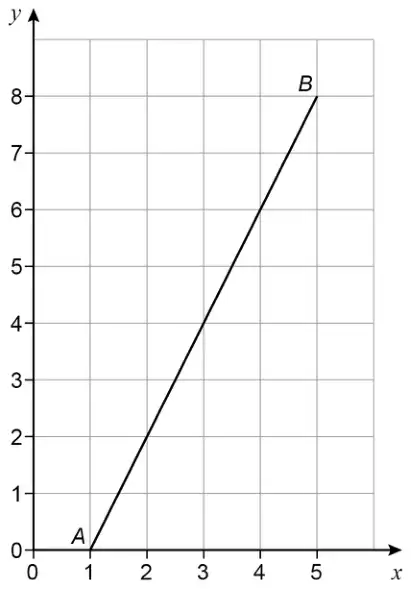
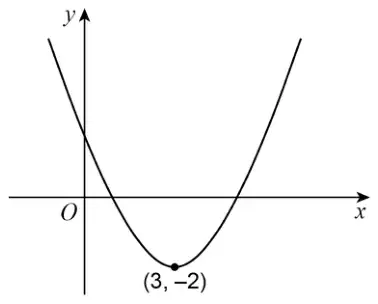
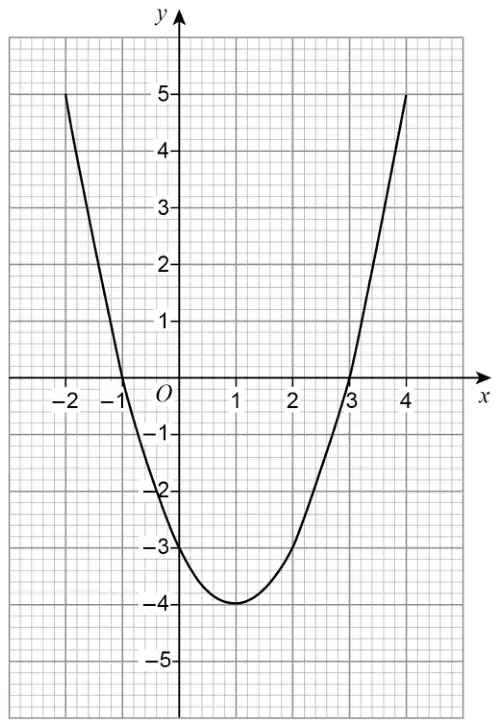
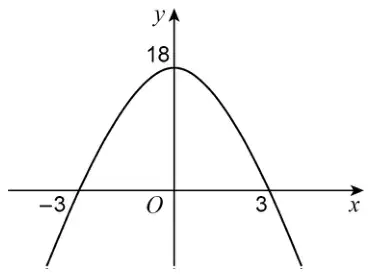
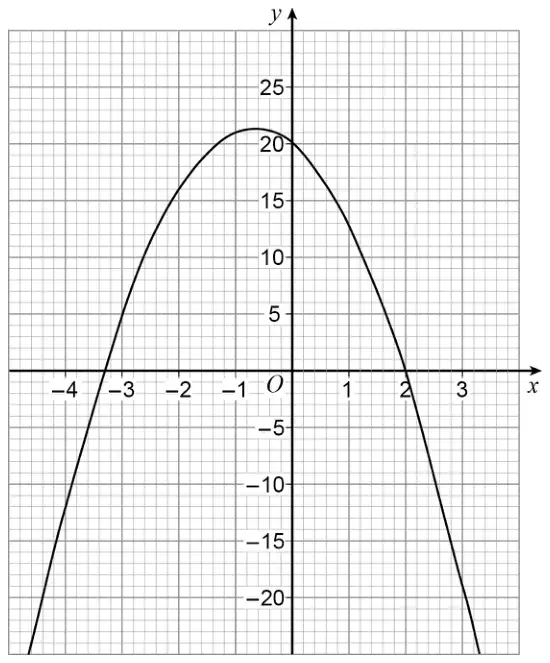
Answer
Mark
Comments
(7, 6)
B1
accept \((\overset{x}{7},\ \overset{y}{6})\)
Additional guidance
\((7x, 6y)\)
B0
Mark scheme (c)
Answer
Mark
Comments
(2, 1)
B1
accept \((\overset{x}{2},\ \overset{y}{1})\)
Additional guidance
\((2x, 1y)\)
B0
If two or more parts have \((x, y)\) as \((y, x)\) then give the first 0 and condone the other(s) eg1 (a) (1, 8) (b) (6, 7) (c) (1, 2) eg2 (a) (1, 8) (b) (7, 6) (c) (1, 2) eg3 (a) (1, 8) (b) (6, 10) (c) (1, 2) eg4 (a) (8, 1) (b) (6, 7) (c) (1, 2)
6 Here is a sketch of the curve \(\quad y = x^2 - 4x - 5\)
(a) Write down the two roots of \(\quad x^2 - 4x - 5 = 0\) [1 mark]
(b) Work out the coordinates of \(T\), the turning point of the curve. [2 marks]
Mark scheme (a)
Answer
Mark
Comments
\(-1\) and 5
B1
either order
Additional guidance
Ignore \(x =\) written before answers
(\(-1\), 0) or (5, 0)
B0
Mark scheme (b)
Answer
Mark
Comments
(2, \(-9\))
B2
B1 \(x = 2\) or (2, …) or \(y = -9\) or (…, \(-9\)) or \((x - 2)^2 - 9\) B1ft correct \(y\)-coordinate for their \(x\)-coordinate with \(x \ne -1\), 0 or 5 SC1 (\(-9\), 2)
Additional guidance
If answer line is blank, check diagram for indication of \(x\) or \(y\) values
The costs of phone calls up to 5 minutes are represented by the graph.
(a) Write down the fixed charge. [1 mark]
(b) Work out the charge per minute. [2 marks]
(c) Work out the cost of a phone call lasting 7 minutes. [2 marks]
Mark scheme (a)
Answer
Mark
Comments
20
B1
Mark scheme (b)
Answer
Mark
Comments
\(28 - 20\) or \(\dfrac{36 - 20}{2}\) or \(\dfrac{44 - 20}{3}\) or \(\dfrac{52 - 20}{4}\) or \(\dfrac{60 - 20}{5}\) or correct calculation using any two points, eg \(\dfrac{60 - 44}{2}\) or \(2 \times 4\)
M1
8
A1
Additional guidance
\((60 \div 5 =)\ 12\)
M0A0
Mark scheme (c)
Answer
Mark
Comments
Alternative method 1
their \(20 + 7 \times\) their 8
M1
oe
76
A1ft
correct answer or ft their values in (a) and (b)
Alternative method 2
\(60 + 2 \times\) their 8
M1
oe
76
A1ft
correct answer or ft their values in (b)
Additional guidance
For Alt 2, they may read off any cost for \(n\) minutes (from 1 to 5) and add on \((7 - n) \times\) their (b) for M1. A1 or A1ft may follow from their working
25 Here is a sketch of a speed-time graph for the first part of a journey.
The total distance for the journey is 130 kilometres.
How far is left to travel? [4 marks]
Answer in km
Mark scheme
Answer
Mark
Comments
Alternative method 1
Correct method to work out any viable distance, eg \(\dfrac{1}{2} \times \dfrac{5}{60} \times 102\) or 4.25 (first section) or \(102 \times \dfrac{40}{60}\) or 68 (second section) or \(\dfrac{1}{2}(102 + 96) \times \dfrac{15}{60}\) or \(96 \times \dfrac{15}{60}\) and \(\dfrac{1}{2} \times 6 \times \dfrac{15}{60}\) or 24 and 0.75 or 24.75 (third section) or \(\dfrac{1}{2}\left(\dfrac{40}{60} + \dfrac{45}{60}\right) \times 102\) or 72.25 (first and second sections)
M1
Correct method to work out all parts of distance, eg \(\dfrac{1}{2} \times \dfrac{5}{60} \times 102\) or 4.25 and \(102 \times \dfrac{40}{60}\) or 68 and \(\dfrac{1}{2}(102 + 96) \times \dfrac{15}{60}\) or 24.75
M1dep
97 scores M1M1
\(130 -\) their whole distance or \(130 - 97\)
M1dep
eg \(130 -\) their \(4.25 -\) their \(68 -\) their 24.75 dep on M2
33
A1
Alternative method 2
Correct method to work out \(60 \times\) any viable distance, eg \(\dfrac{1}{2} \times 5 \times 102\) or 255 (first section) or \(102 \times 40\) or 4080 (second section) or \(\dfrac{1}{2}(102 + 96) \times 15\) or \(96 \times 15\) and \(\dfrac{1}{2} \times 6 \times 15\) or 1440 and 45 or 1485 (third section) or \(\dfrac{1}{2}(40 + 45) \times 102\) or 4335 (first and second sections)
M1
Correct method to work out \(60 \times\) all parts of distance, eg \(\dfrac{1}{2} \times 5 \times 102\) or 255 and \(102 \times 40\) or 4080 and \(\dfrac{1}{2}(102 + 96) \times 15\) or 1485
M1dep
5820 implies M1M1
\(130 -\) their whole distance or \(130 - \dfrac{5820}{60}\) or \(130 - 97\)
M1dep
eg \(130 - \dfrac{\text{their } 255 + \text{their } 4080 + \text{their } 1485}{60}\) dep on M2
33
A1
Additional guidance
Accept fractions used as decimals correct to 2 dp or better
26 The number of items, \(n\), made in 1 hour by a machine is given by \(\quad n = \dfrac{60}{t}\)
\(t\) is the time in minutes the machine takes to make one item.
The value of \(t\) changes for different types of item.
(a) On the grid below, draw the graph of \(\quad n = \dfrac{60}{t} \quad\) for values of \(t\) from 1 to 4 [2 marks]
(b) The machine takes 3 minutes 30 seconds to make one item.
Use your graph to estimate the value of \(n\). [2 marks]
Mark scheme (a)
Answer
Mark
Comments
Plots the points (1, 60), (2, 30), (3, 20) and (4, 15)
M1
\(\pm \dfrac{1}{2}\) small square
Correct smooth curve through correct four points
A1
\(\pm \dfrac{1}{2}\) small square
Additional guidance
Ignore any calculations and mark the graph only
Points cannot be implied by a bar chart or vertical line graph, but condone crosses at the top of a vertical line graph for M1 and the correct curve superimposed for M1A1
For M1, ignore the curve outside the domain \(1 \leqslant t \leqslant 4\) For A1, whether or not the curve extends outside the domain \(1 \leqslant t \leqslant 4\) it must not have a positive gradient at any point
If there is no curve, for M1 there must be no other points with \(x\)-coordinate 1, 2, 3 or 4
The curve should be a single line with no feathering
Unless it affects the shape of the curve (in which case A1 cannot be awarded), ignore incorrect evaluations of \(60 \div\) a non-integer value eg \(60 \div 1.5 = \ldots\)
Mark scheme (b)
Answer
Mark
Comments
Vertical line from \(3\dfrac{1}{2}\) minutes to their graph
M1
\(\pm \dfrac{1}{2}\) small square implied by mark at correct place on the graph or on the vertical axis (but not on the horizontal axis) or by correct reading from their graph
Correct reading from their graph for \(t = 3.5\)
A1ft
ft their graph \(\pm \dfrac{1}{2}\) small square
Additional guidance
Correct reading for their graph, with or without evidence of using graph
M1A1
No graph in (a)
M0A0
To score any marks, their graph must be decreasing in the domain \(1 \leqslant t \leqslant 4\), but may be a straight line or series of connected straight lines
Answer from \(60 \div 3.5\) with no graph, or which does not match graph
23 Here is a sketch of the curve \(\quad y = 2^x\)
On the axes above, sketch the curve \(\quad y = 3^x\) [2 marks]
Mark scheme
Answer
Mark
Comments
Correct curve
B2
B2 correct curve must be correct shape and pass through (0, 1) and be in correct position relative to \(y = 2^x\) B1 correct shape and pass through (0, 1)
Additional guidance
Correct curve must be an exponential graph
Correct position must be above \(\ y = 2^x\ \) for \(x > 0\) below \(\ y = 2^x\ \) for \(x < 0\)
temperature in degrees Fahrenheit (\(F\)) and temperature in degrees Celsius (\(C\)).
(a) Use the graph to convert 40 degrees Fahrenheit into degrees Celsius. [1 mark]
At one temperature, \(T\),
the number of degrees Celsius is double the number of degrees Fahrenheit.
The graph of \(\quad C = 2F \quad\) can be drawn to help find this temperature.
(b) On the grid above, draw the graph of \(\quad C = 2F \quad\) for values of \(F\) from \(-25\) to 25
You may use the table to help you. [2 marks]
\(F\)
\(-25\)
\(C\)
\(-50\)
(c) Use your graph to estimate the value of \(T\). Give your answer in degrees Celsius. [2 marks]
Mark scheme (a)
Answer
Mark
Comments
[4, 5]
B1
Mark scheme (b)
Answer
Mark
Comments
Correct ruled straight line from \((-25, -50)\) to \((25, 50)\)
B2
\(\pm \dfrac{1}{2}\) small square ignore ends of line outside \([-25, 25]\)
B1 two correct points added to the table or at least two correct points plotted or correct line too short but crosses 2 horizontal centimetre squares
Additional guidance
The correct points in the table or on the graph may be outside \([-25, 25]\) eg \((100, 200)\) and \((-100, -200)\) in the table
B1
For B1, do not count a point as correct if another point has the same \(x\)-coordinate, otherwise ignore extra points that are incorrect
The B1 for points plotted cannot be implied by a line – you must see eg crosses or dots
Ignore incorrect points in the table if B1 or B2 gained elsewhere
Mark scheme (c)
Answer
Mark
Comments
Correct reading of \(C\) coordinate of intersection of their graph with the given graph
B2ft
ft their intersection from any line or curve \(\pm \dfrac{1}{2}\) small square B1 line drawn horizontally from point of intersection to vertical axis or \(F\) coordinate of intersection given
Additional guidance
Their line does not intersect given line or they have no line
B0
If their graph intersects given line at more than one point and they give all the \(C\) coordinates of the intersections
B1
If their line is correct the answer should be approximately \(-25\)
If their line is correct the \(F\) coordinate should be approximately \(-12\)
Both their \(-25\) and their \(-12\) given eg correct line seen and \((-25, -12)\) or \((-12, -25)\)
10 The number of items, \(n\), made in 1 hour by a machine is given by \(\quad n = \dfrac{60}{t}\)
\(t\) is the time in minutes the machine takes to make one item.
The value of \(t\) changes for different types of item.
(a) On the grid below, draw the graph of \(\quad n = \dfrac{60}{t} \quad\) for values of \(t\) from 1 to 4 [2 marks]
(b) The machine takes 3 minutes 30 seconds to make one item.
Use your graph to estimate the value of \(n\). [2 marks]
Mark scheme (a)
Answer
Mark
Comments
Plots the points (1, 60), (2, 30), (3, 20) and (4, 15)
M1
\(\pm \dfrac{1}{2}\) small square
Correct smooth curve through correct four points
A1
\(\pm \dfrac{1}{2}\) small square
Additional guidance
Ignore any calculations and mark the graph only
Points cannot be implied by a bar chart or vertical line graph, but condone crosses at the top of a vertical line graph for M1 and the correct curve superimposed for M1A1
For M1, ignore the curve outside the domain \(1 \leqslant t \leqslant 4\) For A1, whether or not the curve extends outside the domain \(1 \leqslant t \leqslant 4\) it must not have a positive gradient at any point
If there is no curve, for M1 there must be no other points with \(x\)-coordinate 1, 2, 3 or 4
The curve should be a single line with no feathering
Unless it affects the shape of the curve (in which case A1 cannot be awarded), ignore incorrect evaluations of \(60 \div\) a non-integer value eg \(60 \div 1.5 = \ldots\)
Mark scheme (b)
Answer
Mark
Comments
Vertical line from \(3\dfrac{1}{2}\) minutes to their graph
M1
\(\pm \dfrac{1}{2}\) small square implied by mark at correct place on the graph or on the vertical axis (but not on the horizontal axis) or by correct reading from their graph
Correct reading from their graph for \(t = 3.5\)
A1ft
ft their graph \(\pm \dfrac{1}{2}\) small square
Additional guidance
Correct reading for their graph, with or without evidence of using graph
M1A1
No graph in (a)
M0A0
To score any marks, their graph must be decreasing in the domain \(1 \leqslant t \leqslant 4\), but may be a straight line or series of connected straight lines
Answer from \(60 \div 3.5\) with no graph, or which does not match graph
8 On the axes, sketch the curve \(\quad y = x^3 - 2\)
You must show the coordinates of the \(y\)-intercept. [2 marks]
Mark scheme
Answer
Mark
Comments
Fully correct curve and point \((0, -2)\) indicated
B2
B1 fully correct curve or partially correct curve with point \((0, -2)\) indicated
Additional guidance
A partially correct curve must start in the 3rd quadrant and finish in the 1st quadrant, passing through the 4th quadrant not include a section with negative gradient
A fully correct curve must have all the properties of a partially correct curve have only a decreasing gradient to the left of the \(y\)-axis have only an increasing gradient to the right of the \(y\)-axisCondone a positive gradient at the \(y\)-intercept Condone straight line segments at each end of the curve
Fully correct curve with \(y\)-intercept labelled \(-2\)
B2
Partially correct curve with \(y\)-intercept labelled \(-2\)
B1
\(y\)-intercept labelled \((-2, 0)\) is incorrect and can score a maximum of B1
Ignore any numbers on the axes other than the \(y\)-intercept
\(y\)-intercept \((0, -2)\) stated does indicate the point \((0, -2)\)
Unlabelled notches do not indicate the point \((0, -2)\)
A table of values does not indicate the point \((0, -2)\)
Graph consisting only of straight lines
B0
A fully correct curve but point \((0, -2)\) is not indicated
B1
Partially correct curve with point \((0, -2)\) indicated
B1
Fully correct curve with point \((0, -2)\) indicated
B2
Partially correct curve with point \((0, -2)\) indicated
B1
Curve includes a negative gradient so not partially correct
Work out one possible pair of coordinates of the other vertex. [2 marks]
Mark scheme
Answer
Mark
Comments
(2, 5) or (8, 5)
B2
B1 correct point indicated on grid or \((x, 5)\) or \((2, y)\) or \((8, y)\), where \(x\) can be \(x\) or blank or any number other than 13 and \(y\) can be \(y\) or blank or any number
Additional guidance
Mark answer line first, then if no marks scored, check grid for B1 plot
No tolerance on values of 2 or 8 for B2 but allow half a square tolerance on plotting for B1
During the first 6 seconds her speed increases at a constant rate. During the last 8 seconds her speed increases at a different constant rate. Her speed at 14 seconds is 2 m/s more than her speed at 6 seconds.
Here is a sketch of her speed-time graph.
Not drawn accurately
(a) Work out her acceleration during the last 8 seconds.
State the units of your answer. [2 marks]
(b) When Izzy finishes the 80-metre race, her speed is \(v\) m/s
Work out the value of \(v\). [4 marks]
Mark scheme (a)
Answer
Mark
Comments
0.25 or \(\dfrac{1}{4}\) or \(\dfrac{2}{8}\)
B1
m/s2 or ms−2 or m/s/s or \(\dfrac{\text{m}}{\text{s}^2}\)
B1
oe eg metres per second per second SC2 acceleration and unit not in m/s2 eg 25 cm/s2 or 3240 km/h2
Additional guidance
\(\dfrac{2}{14 - 6}\) with no further simplification
(1st) B0
Mark scheme (b)
Answer
Mark
Comments
Alternative method 1
\(\dfrac{1}{2} \times 6 \times (v - 2)\) or \(\dfrac{1}{2} \times (14 - 6) \times (v + v - 2)\) or \((14 - 6) \times (v - 2)\) or \(\dfrac{1}{2} \times (14 - 6) \times 2\) or 8
M1
oe partial area any letter
\(\dfrac{1}{2} \times 6 \times (v - 2)\) \(+\; \dfrac{1}{2} \times (14 - 6) \times (v + v - 2)\) or \(3(v - 2) + 8(v - 2) + 8\) or \(11v - 14\)
M1dep
oe full area in one variable eg \(14 \times v - \dfrac{1}{2} \times 6 \times (v - 2)\) \(-\; \dfrac{1}{2} \times 2 \times (6 + 14)\) implies M2
\(\dfrac{1}{2} \times 6 \times (v - 2)\) \(+\; \dfrac{1}{2} \times (14 - 6) \times (v + v - 2) = 80\) or \(94 \div 11\)
A1
oe full area in one variable equated to 80
8.5(4…) or 8.55 or \(\dfrac{94}{11}\) or \(8\dfrac{6}{11}\)
A1
Alternative method 2
\(\dfrac{1}{2} \times 6 \times x\) or \(\dfrac{1}{2} \times (14 - 6) \times (x + x + 2)\) or \((14 - 6) \times x\) or \(\dfrac{1}{2} \times (14 - 6) \times 2\) or 8
M1
oe partial area \(x\) is the speed at 6 seconds any letter
\(\dfrac{1}{2} \times 6 \times x\) \(+\; \dfrac{1}{2} \times (14 - 6) \times (x + x + 2)\) or \(3x + 8x + 8\) or \(11x + 8\)
M1dep
oe full area in one variable eg \(14 \times (x + 2) - \dfrac{1}{2} \times 6 \times x\) \(-\; \dfrac{1}{2} \times 2 \times (6 + 14)\) implies M2
\(\dfrac{1}{2} \times 6 \times x\) \(+\; \dfrac{1}{2} \times (14 - 6) \times (x + x + 2) = 80\) or \(72 \div 11\) or 6.5(4…) or 6.55 or \(\dfrac{72}{11}\) or \(6\dfrac{6}{11}\)
A1
oe full area in one variable equated to 80
8.5(4…) or 8.55 or \(\dfrac{94}{11}\) or \(8\dfrac{6}{11}\)
14 Lee wants to draw the graph of \(\quad y = x \quad\) for values of \(x\) from \(-5\) to 5
Here is his graph.
Make two different criticisms of his graph. [2 marks]
Criticism 1
Criticism 2
Mark scheme
Answer
Mark
Comments
The graph only goes from \(x = -4\) to \(x = 4\) and the graph shown is \(y = -x\) up to 0
B2
oe
B1 one correct criticism
SC1 correct graph drawn from \(x = -5\) to \(x = 5\)
Additional guidance
For one criticism, accept eg it doesn’t reach 5 / 5 not plotted / it doesn’t start at –5 only starts at –4 / only reaches 4 it should go to (5, 5) / (5, 5) not plotted / (–5, –5) not plotted it isn’t long enough
B1
Do not accept eg it isn’t finished (–5, 5) not plotted
B0
For the other criticism, accept eg it’s the wrong line up to 0 it’s the wrong equation for the first part \(y\) does not equal \(x\) at the beginning it should go through (–4, –4) / (–5, –5) not plotted / (–1, –1) should be plotted it should be / it’s not a straight line it shouldn’t be a V-shape worked out the negative numbers wrong / no negative \(y\)-coordinates he should have plotted … and correct table of values
B1
Do not accept eg it isn’t correctly drawn / it isn’t \(y = x\) / the points are plotted wrong it should be symmetrical / it shouldn’t be symmetrical one line should go below the \(x\)-axis
B0
NB (–5, –5) should be plotted is valid for either (but not both) criticisms
B1
Both criticisms may be in one answer space
Ignore irrelevant statements but any additional statements must be correct eg It goes from –4 to 5 not –5 to 5
\(\left(\dfrac{6 + 0}{2}, \dfrac{0 + 6}{2}\right)\) or (3, 3)
M1
coordinates of \(M\)
gradient \(OM = 1\) (and \(y = x\)) or (0, 0) and (3, 3) (and \(y = x\))
A1
must see correct working for M1
Mark scheme (d)
Answer
Mark
Comments
\(x^2 + x^2 = 36\) or \(2x^2 = 36\) or \(y^2 + y^2 = 36\) or \(2y^2 = 36\) or (–)\(6 \cos 45°\) or (–)\(6 \sin 45°\)
M1
oe equation
(–)\(\sqrt{\dfrac{36}{2}}\) or (–)\(\sqrt{18}\) or (–)\(3\sqrt{2}\) or (–)\(\dfrac{6\sqrt{2}}{2}\) or (–)\(\dfrac{6}{\sqrt{2}}\)
M1
\(\left(-\sqrt{18}, -\sqrt{18}\right)\) or \(\left(-3\sqrt{2}, -3\sqrt{2}\right)\) or \(\left(-\dfrac{6\sqrt{2}}{2}, -\dfrac{6\sqrt{2}}{2}\right)\) or \(\left(-\dfrac{6}{\sqrt{2}}, -\dfrac{6}{\sqrt{2}}\right)\)
He walked from home to the shop at a constant speed in 10 minutes. He stayed at the shop for 5 minutes. He walked home at a constant speed in 8 minutes.
Anil drew this distance-time graph to represent his journey.
Make two criticisms of his graph. [2 marks]
Mark scheme
Answer
Mark
Comments
Valid criticism referring to the line from (0, 0) to (10, 1)
B1
eg there shouldn’t be a curve need to be specific about the line shape, it is not sufficient to simply say it is wrong
Valid criticism referring to the line from (15, 1)
B1
oe eg he never goes 2 km from home
Additional guidance
Criticisms can be in either order
A correct diagram takes precedence over statements, otherwise ignore diagram
For first B1:
The first part is curved
B1
The curve should be a straight line
B1
He has drawn a curve for constant speed
B1
The line is curved which shows his speed was not consistent/constant
B1
He’s not going at a constant speed to the shop (correct referral to graph)
B1
All lines should be straight
B1
Constant speed should be a diagonal/straight line
B1
The line shouldn’t curve
B1
The constant speed should be [a sloping straight line sketched]
B1
The curved line shows he decreased speed
B1
It should be a straight line from 0 to 10
B1
It should be a straight line at the start
B1
A distance-time graph shouldn’t have curves
B0
It should be a straight line ( ‘It’ seems to be referring to the whole graph)
B0
The curved line shows he increased and decreased speed
B0
He was walking at a range of speeds, so not consistent (referral to whole graph)
B0
The constant speed is drawn incorrectly (how?)
B0
The lines should be curved or straight, not both
B0
The curve should be a line of best fit
B0
It should be a straight line from 0 to 15 (it should be to 10)
B0
The curve is wrong (how?)
B0
For 2nd B1:
The line should go down at the end
B1
He isn’t walking home, he’s walking further away
B1
He has walked away from home when he hasn’t
B1
The line should go back to the bottom of the graph
B1
The graph should return to zero
B1
The last part should be decreasing (instead of increasing)
B1
The line for him walking home should have negative gradient
B1
The graph shows he didn’t walk home
B1
The line for him walking home should have negative correlation
B0
The line for the journey home goes the wrong way
B0
The graph does not show his journey home
B0
His house is 2 km away from the shop
B0
The line should be decreasing instead of increasing (which line?)
(a) Meera is using a graphical method to solve \(\quad 2x^2 - 3x = 0\)
She draws the graph of \(\quad y = 2x^2 \quad\) and a straight line graph on the same grid.
Here is the graph of \(\quad y = 2x^2\)
Complete her method to solve \(\quad 2x^2 - 3x = 0\) [2 marks]
(b) Levi is solving \(\quad 2x^2 + 5x = 0\)
He uses this method.
\[\begin{aligned} 2x^2 + 5x &= 0 && \text{subtract } 5x \text{ from both sides} \\ 2x^2 &= -5x && \text{divide both sides by } x \\ 2x &= -5 && \text{divide both sides by } 2 \\ x &= -2.5 && \end{aligned}\]
Evaluate his method and his answer. [2 marks]
Mark scheme (a)
Answer
Mark
Comments
Draws \(y = 3x\) and (\(x =\)) [−0.1, 0.1] and (\(x =\)) [1.4, 1.6]
B2
B1 Draws \(y = 3x\) or states \(y = 3x\) \(\pm\dfrac{1}{2}\) square tolerance for drawing graph Graph must be seen for \(x\) values from 0 to 1.5
Additional guidance
Ignore any \(y\) values seen
Solutions from a non-graphical method
B0
Ignore other lines drawn on grid
Mark scheme (b)
Answer
Mark
Comments
Full evaluation of method and answer
B2
eg1 Cannot divide by \(x\) as it could be zero eg2 Should have factorised and then he would have also found that \(x = 0\) eg3 Should have used the formula and then he would have also found that \(x = 0\) eg4 Should have used a graphical method then he would have also found that \(x = 0\) eg5 Should have completed the square then he would have also found that \(x = 0\)
B1 Partial evaluation eg1 \(x = 0\) has been omitted eg2 Should have factorised eg3 Should have used the formula eg4 Should have drawn a graph eg5 Only found one solution eg6 Cannot divide by zero
Additional guidance
For B2 there needs to be an evaluation of the method and an indication that \(x = 0\) has been omitted from the answer
For the first 30 minutes her average speed is 40 miles per hour. She then stops for 15 minutes. She then completes the journey at an average speed of 60 miles per hour. The total journey time is 1 hour.
(a) Draw a distance-time graph for her journey. [3 marks]
(b) Write down the average speed for the total journey. [1 mark]
Mark scheme (a)
Answer
Mark
Comments
Joins (0, 0) to (30, 20)
B1
Line does not need to be straight but must start and finish at correct points and not be decreasing Mark intention
Horizontal line for 15 minutes from their (30, 20)
B1ft
Mark intention
Line with gradient 1 or a curve from their (45, 20) and stops at 60 minutes or stops at top edge of grid or higher but not beyond 60 minutes
B1ft
A curve must not be decreasing and must start and finish at two points that could be joined by a line with gradient 1 Condone a horizontal or vertical line from 60 minutes Mark intention
Additional guidance
B3
Allow any horizontal line between 30 minutes and 45 minutes if first part of journey is blank eg
B0B1
Do not allow second mark if their first line is followed by a drop back towards the horizontal axis before she stops eg
B1B0 (top two graphs) B0B0 (lower graph)
If there are more than 3 lines or curves, assume the last part is the part where she completes her journey eg
B1B0B1ft
If their (45, 20) is too high to fit a line of gradient 1 ending at 60 minutes, allow the final line to stop at the top of the grid or higher, but not beyond 60 minutes eg
B0B1ftB1ft
Points but no lines
B0
Ignore any lines that could be working for part (a) or part (b)
Mark scheme (b)
Answer
Mark
Comments
35
B1ft
Correct or ft total distance travelled for their graph at 60 minutes
Additional guidance
35 from any or no graph
B1
If their graph extends beyond 60 minutes, read off at 60 minutes for ft
Follow through total distance travelled eg (a)
(b) answer 25
B0ft
(b) answer 55
B1ft
Ignores the stationary parts
B0
Do not follow through a graph above the grid at 60 eg (a)
18 Nick sketches the graph of \(\quad y = 0.5^x \quad\) for \(\;x \geqslant 0\)
Make one criticism of his sketch. [1 mark]
Mark scheme
Answer
Mark
Comments
Valid criticism
B1
eg (\(y =\)) 0.5 should be (\(y =\)) 1 \(y = 0.5\) should be when \(x = 1\) When \(x = 0 \;\; y = 1\) 0.5 is incorrect Crosses \(y\) axis in wrong place Graph should start at 1 \(0.5^0 = 1\)
For the first 30 minutes her average speed is 40 miles per hour.
She then stops for 15 minutes.
She then completes the journey at an average speed of 60 miles per hour.
The total journey time is 1 hour.
(a) Draw a distance-time graph for her journey. [3 marks]
(b) Write down the average speed for the total journey. [1 mark]
Mark scheme (a)
Answer
Mark
Comments
Joins (0, 0) to (30, 20)
B1
Line does not need to be straight but must start and finish at correct points and not be decreasing Mark intention
Horizontal line for 15 minutes from their (30, 20)
B1ft
Mark intention
Line with gradient 1 or a curve from their (45, 20) and stops at 60 minutes or stops at top edge of grid or higher but not beyond 60 minutes
B1ft
A curve must not be decreasing and must start and finish at two points that could be joined by a line with gradient 1 Condone a horizontal or vertical line from 60 minutes Mark intention
Additional guidance
B3
Allow any horizontal line between 30 minutes and 45 minutes if first part of journey is blank eg
B0B1
Do not allow second mark if their first line is followed by a drop back towards the horizontal axis before she stops eg
B1B0 (first two) B0B0 (third)
If there are more than 3 lines or curves, assume the last part is the part where she completes her journey eg
B1B0B1ft
If their (45, 20) is too high to fit a line of gradient 1 ending at 60 minutes, allow the final line to stop at the top of the grid or higher, but not beyond 60 minutes eg
B0B1ftB1ft
Points but no lines
B0
Ignore any lines that could be working for part (a) or part (b)
Mark scheme (b)
Answer
Mark
Comments
35
B1ft
Correct or ft total distance travelled for their graph at 60 minutes
Additional guidance
35 from any or no graph
B1
If their graph extends beyond 60 minutes, read off at 60 minutes for ft
Follow through total distance travelled eg (a)(b) answer 25 (b) answer 55
B0ft B1ft
Ignores the stationary parts
B0
Do not follow through a graph above the grid at 60 eg (a)(b) answer 55
21 The graph of a function is drawn on the grid for \(0 \leqslant x \leqslant 4\).
(a) Work out the average rate of change of the function between \(x = 1\) and \(x = 3\). [2]
(b) Use the graph to estimate the gradient of the function at \(x = 2.5\). You must show working to support your estimate. [4]
Mark scheme (a)
Answer
Marks
Part marks and guidance
3.8 – 4.2 nfww
2
M1 for \(\dfrac{\textit{their}\,15 - \textit{their}\,7}{3 - 1}\) oe
condone \(6.8 \leqslant\) their\(7 \leqslant 7.2\) and \(14.8 \leqslant\) their\(15 \leqslant 15.2\) e.g \(\frac{14.8 - 7.2}{3 - 1} = 3.8\) This part cannot be answered with a tangent at \(x = 2\).
Mark scheme (b)
Answer
Marks
Part marks and guidance
Ruled tangent drawn at \(x = 2.5\)
B1
Tangent should not cross the curve, should touch at \(x = 2.5\) (condone slight daylight between tangent and curve) and condone running along the curve slightly. Ignore any tangent at \(x = 2\) for this part.
using two points on their tangent at \(x = 2.5\)
M1
this might be in the form of a triangle or two points clearly identified or in a calculation
The remaining 3 marks depend on a reasonable ruled attempt at a tangent clearly at \(x = 2.5\) so B0 M1 M1 A1FT is possible.
use of \(\dfrac{\textit{difference in } y}{\textit{difference in } x}\)
M1
M1 for attempting to divide vertical distance by horizontal distance on their tangent at \(x = 2.5\) even if the readings are inaccurate
accurate calculation from their tangent
A1FT
The final mark (A1) is easily checked for accuracy by using the ‘ruler’ which is lined up on the tangent and extended as far as possible, calculate the gradient, or translate the ruler to put one end on the origin, and use a tolerance of ± 0.2 and if their figure is within range award A1
20 A container takes 8 minutes to be filled with water.
The graph shows the rate of flow, in litres per minute, of the water into the container during the 8 minutes.
Not to scale
(a) Show that 126 litres of water flows into the container between 0.5 minutes and 7.5 minutes. [1]
(b) Work out the average rate of flow, in litres per minute, of water into the container during the 8 minutes. [4]
Mark scheme (a)
Answer
Marks
Part marks and guidance
18 × (7.5 – 0.5) or 18 × 7
1
126/18 = 7 only scores if 7 is related to the context 126/7 = 18 only scores if 18 is related to the context
Mark scheme (b)
Answer
Marks
Part marks and guidance
16.87[5] or 16.88 or 16.9 oe
4
M3 for \(\frac{126 + 2 \times \frac{1}{2} \times 0.5 \times 18}{8}\) oe or M2 for \(126 + 2 \times \frac{1}{2} \times 0.5 \times 18\) oe may be implied by 135 or M1 for \([2\ \times]\ \frac{1}{2} \times 0.5 \times 18\) oe may be implied by 4.5 for one triangle or 9 for two triangles
If 0 scored, SC1 for \(\frac{126 + 2 \times 9}{8}\) or \(\frac{126 + 18}{8}\)
e.g. \(\frac{\frac{1}{2} \times (7 + 8) \times 18}{8}\)
e.g. \(\frac{1}{2} \times (7 + 8) \times 18\) or \(18 \times 8 - 2 \times \frac{1}{2} \times 0.5 \times 18\)
(a) On the axes below, sketch the graph \(y = -x^2\). [2]
(b) Write down a possible equation for the graph sketched below. [1]
Mark scheme (a)
Answer
Marks
Part marks and guidance
Correct shape and orientation, reasonable symmetry in y-axis, intent to pass through origin
2
M1 attempt at correct curve shape and orientation not necessarily through the origin
See Appendix Should be a single smooth curve that appears symmetrical by eye
For M1 condone translation in any direction, minor feathering and curvature errors
Plots should be curved and not straight-line segments
Appendix: Question 16a
2 marks: Correct shape and orientation, reasonable symmetry in y-axis, intent to pass through origin 1 mark: Attempt at correct curve shape and orientation not necessarily through the origin; condone translation in any direction, minor feathering and curvature errors
Plots should be curved and not straight-line segments
2 marks sym in y-axis, origin
2 marks sym in y-axis, origin, min feathering
2 marks reasonable.sym in y-axis, origin, min curvature
2 marks sym y-axis, origin, borderline feathering and min curvature
1 mark shape, not origin
1 mark Shape, not origin, minor curvature error
1 mark (best fit), shape, poor symmetry, origin, curvature issues
0 marks
Mark scheme (b)
Answer
Marks
Part marks and guidance
[\(y\) =] [\(k\)] \(\tan x\) where \(k \gt 0\)
1
Condone [y =][\(k\)] \(\tan x^\circ\), \(\tan\theta\) etc Do not accept [y =][\(k\)] tan, \(\tan y\), \(\tan\frac{o}{a}\), tan(a number) etc Ignore attempts at domain
10 Here is a table of values for \(y = x^2 - x - 8\).
\(x\)
-4
-3
-2
-1
0
1
2
3
4
\(y\)
12
4
-2
-6
-8
-8
-6
-2
4
(a) Draw the graph of \(y = x^2 - x - 8\) for \(-4 \leqslant x \leqslant 4\). [3]
(b) Write down the equation of the line of symmetry of the graph. [1]
(c) Use the graph to solve the equation \(x^2 - x - 8 = 0\). Give your answers to 1 decimal place. [2]
Mark scheme (a)
Answer
Marks
Part marks and guidance
correct curve within tolerance
3
B2 for 8 points accurately plotted or B1 for 5 points accurately plotted
tolerance \(\pm\frac{1}{2}\) small square radially for curve and points, some daylight between \(y = -8\) and curve, condone a wobbly curve and slight feathering or tram lines in no more than 3 sections but no ruled lines and no dashed lines
Mark scheme (b)
Answer
Marks
Part marks and guidance
\(x = 0.5\) oe
1
Mark scheme (c)
Answer
Marks
Part marks and guidance
–2.3 or –2.4 3.3 or 3.4
2
B1 for either answer SC1 for an answer to more than 1 dp in each of –2.4 to –2.3 and 3.3 to 3.4
If 1 scored FTtheir curve for 2 marks or if 0 scored FTtheir curve for 1 or 2 marks or for SC1
tolerance \(\pm\frac{1}{2}\) small square radially
(a) Sketch the graph of \(y = 8^x\). Indicate any values where the graph crosses the axes. [2]
(b) Sketch the graph of \(y = \cos x\) for \(0^\circ \leqslant x \leqslant 360^\circ\). Indicate any values where the graph crosses the \(x\)-axis. [2]
Mark scheme (a)
Answer
Marks
Part marks and guidance
Correct sketch with \(y\) – intercept 1 indicated
2
B1 for increasing exponential curve with no ruled sections
or for any sketch with a single \(y\) – intercept at 1
For 2 marks, condone curve touching but not crossing \(x\)- axis For 2 marks or B1 mark intention For 2 marks no ruled sections
See AG
Additional guidance: Question 22(a)
Example A
Correct shape, mark intention passes through \(y = 1\) 2 marks
Example B
Correct shape B1
Example C
\(y\) – intercept at 1 B1
Example D
Ruled wrong shape B0
Mark scheme (b)
Answer
Marks
Part marks and guidance
Correct sketch of \(y = \cos x\) with 90 and 270 indicated and starting at 1 on \(y\)-axis
2
B1 for cos shape graph with period 360 starting at (0, \(k\)), \(k \gt 0\) and amplitude \(k\) Or for cos shape graph starting at (0, 1) with amplitude 1 and with a period a factor of 360 Or for cos shape graph with period 360 with 90 and 270 indicated where graph crosses \(x\) - axis
For 2 marks mark intention
e.g. \(y = 2\cos x\) For B1 allow poor curvature, mark intention
(a) The graph shows the speed of an object during the first 20 seconds of its motion.
Calculate the distance travelled by the object during the 20 seconds. [3]
(b) The graph shows the distance travelled by an object during the first 4 seconds of its motion.
(i) Work out the average speed of this object between 2 and 4 seconds. [2]
(ii) Use the graph to estimate the speed of this object at 3 seconds. You must show working to support your estimate. [3]
(iii) What happens to the speed of this object during these 4 seconds of motion. Explain how you know. [1]
Mark scheme (a)
Answer
Marks
Part marks and guidance
162
3
M2 for \(\frac{1}{2} \times (\textit{their}7 + 20) \times \textit{their}12\) oe or M1 for one relevant area e.g. \(\frac{1}{2} \times \textit{their}8 \times \textit{their}12\) or their7 × their12 or \(\frac{1}{2} \times \textit{their}5 \times \textit{their}12\)
e.g. M2 for \(\frac{1}{2} \times \textit{their}8 \times \textit{their}12 + \textit{their}7 \times \textit{their}12 + \frac{1}{2} \times \textit{their}5 \times \textit{their}12\) implied by 48 + 84 + 30
alternative method : M2 for \(\textit{their}12 \times 20 - \frac{1}{2} \times \textit{their}8 \times \textit{their}12 - \frac{1}{2} \times \textit{their}5 \times \textit{their}12\) or M1 for one relevant area e.g. their12 × 20 or \(\frac{1}{2} \times \textit{their}8 \times \textit{their}12\) or \(\frac{1}{2} \times \textit{their}5 \times \textit{their}12\)
implied by 240 – 48 – 30
Mark scheme (b)
Answer
Marks
Part marks and guidance
(i) 14
2
M1 for \(\frac{\textit{their}32 - \textit{their}4}{4 - 2}\) oe
Allow any two points on the line joining (2,4) and (4,32)
(ii) Ruled tangent drawn at 3 seconds
B1
Tangent – mark intention to touch the curve at 3 seconds(condone thin daylight at 3), ignore other lines, condone dotty/dashed and condone line on one side only. If tangent is ruled and their value is outside the range apply FT to their tangent use accuracy of 2 sf
14.0 – 16.0
B2dep
B2 dep on B1 correct or FT or M1 for rise ÷ run with values substituted
(iii) [the speed] increases oe [because] the gradient is steeper/greater oe
1
Accept any correct response, accept accelerates for increase, see appendix
Appendix: exemplar responses for Q18(b)(iii)
Response
Mark
Increases and gradient is steeper/greater
1
Accelerates as curve is getting steeper
1
Increases as the distance per second increases
1
Increases as the distance travelled in the same time increases
24 The \(x\)-coordinates of the intersections of the graphs of \(y = x^2 + ax + 7\) and \(y = 3x + b\) are the solutions to the equation \(x^2 + 8x + 13 = 0\).
Find the value of \(a\) and the value of \(b\). [3]
Mark scheme
Answer
Marks
Part marks and guidance
\(a = 11\) \(b = -6\)
3
B2 for \(a - 3 = 8\) or \(7 - b = 13\) or better or M1 for \(x^2 + ax + 7 = 3x + b\) oe
Sign change so solution between \(x = 3\) and \(x = 4\)
3
M2 for \(3^5 - 70 \times 3 - 150 = -117\) and \(4^5 - 70 \times 4 - 150 = 594\) or M1 for \(3^5 - 70 \times 3 - 150\) soi by −117 or \(4^5 - 70 \times 4 - 150\) soi by 594
Accept other values of \(x\) used between 3 and 4 (see table in part (b)). For full marks, the two values need to produce a sign change or values either side of 150 if using alternative method.
Examples just sufficient for third mark include: Change of sign −117 < 0 < 594 \(x = 3\) gives an answer < 0 and \(x = 4\) gives an answer > 0 Examples insufficient for third mark: so \(x\) lies between 3 and 4
Alternative method After \(x^5 - 70x = 150\) seen M2 for \(3^5 - 70 \times 3 = 33\) and \(4^5 - 70 \times 4 = 744\) A1 for 33 < 150 and 744 > 150 so solution between \(x = 3\) and \(x = 4\) OR M1 for \(3^5 - 70 \times 3\) soi by 33 or \(4^5 - 70 \times 4\) soi by 744
Alternative method SC3 for using an iterative equation that converges to a value in the range 3.25 and 3.35 and concluding statement that 3 < 3.25 to 3.35 < 4 oe or SC2 for using an iterative equation that converges to a value in the range 3.25 to 3.35
If within part (a) candidates refer to their working in part (b), award marks for this final alternative method.
Mark scheme (b)
Answer
Marks
Part marks and guidance
Examples: when \(x = 3.1\) \(y = -80[.7\ldots]\), so \(3.1 < p < 4\) when \(x = 3.5\) \(y = 130[.2\ldots]\), so \(3 < p < 3.5\) when \(x = 3.1\) \(y = -80[.7\ldots]\) and when \(x = 3.5\) \(y = 130[.2\ldots]\), so \(3.1 < p < 3.5\)
3
Dependent on achieving at least M2
M2 for one further value of \(y\) evaluated correctly, possibly rot or truncated to 2 or more sf, for a value of \(x\) such that \(3 < x < 4\)
OR
M1 for working shown to calculate one further value of \(y\) for a value of \(x\) such that \(3 < x < 4\)
Alternative method After \(x^5 - 70x = 150\) seen Award marks as for the main method, but with one evaluation being < 150 and the other being > 150
Note after SC considered in part (a): if SC2 was awarded then they must use a value of \(x\) that produces a smaller interval than \(3 < x <\) their \(x\)-value in (a) or their \(x\)-value in (a) \(< x < 4\)
If 0 scored, instead award SC1 or SC2 if evidence for M1 or M2 has not been credited in part (a)
Likely values: accept rot to 2+sf
\(x\)
\(x^5 - 70x\)
\(x^5 - 70x - 150\)
3.1
69.292
-80.708
3.2
111.544
-38.456
3.25
135.091
-14.909
3.26
140.004
-9.996
3.27
144.986
-5.014
3.28
150.038
0.038
3.29
155.16
5.16
3.3
160.354
10.354
3.31
165.62
15.62
3.32
170.958
20.958
3.33
176.369
26.369
3.34
181.854
31.854
3.35
187.414
37.414
3.4
216.354
66.354
3.5
280.219
130.219
3.6
352.662
202.662
3.7
434.44
284.44
3.75
479.077
329.077
3.8
526.352
376.352
3.9
629.242
479.242
A correct narrower range scores 0 unless accompanied by the relevant correct calculations. Calculations in support of \(x = 3\) or \(x = 4\) need not be repeated from part (a)
(b) Draw the graph of \(y = x^3 + 4x^2\) for \(-5 \leqslant x \leqslant 1\).
[3]
(c) The equation \(x^3 + 4x^2 = k\), where \(k\) is an integer, has exactly one solution for \(-5 \leqslant x \leqslant 1\).
Find the greatest possible value of \(k\). [1]
Mark scheme (a)
Answer
Marks
Part marks and guidance
3
1
Mark scheme (b)
Answer
Marks
Part marks and guidance
Correct curve
3
B2FT for 7 or 8 correct plots or B1FT for 5 or 6 correct plots
Use overlay as a guide Mark curve first accuracy ± 1mm, ½ small sq Condone slight feathering Condone ruled segment between \(x = -5\) and \(x = -4.5\) only If curve incorrect then mark plots accuracy ± 1mm If no plot, curve implies plot
Other acceptable answers include: [The sketch is a] reflection of \(y = \sin x\) [in the \(x\)-axis]; First turning point should be a maximum; \(\sin x\) has a maximum at 90 [and then a minimum at 270].
(ii) eg. \(y = -\sin x\)
1
Accept any other possibly correct equations such as: \(y = -k \sin x\) or \(y = \sin(-x)\) or \(y = k\cos(x + 90)\)
Use of \((0, 2)\) scores 0 but may be replaced with another point (ie do not treat as a choice)
Examples of intermediate steps
\(4 = 2k - 2^2 + 2\) then \(4 = 2k - 4 + 2\) is a sufficient int step or \(4 = 2k - 2\) is a sufficient int step or \(6 = 2k\) is a sufficient int step \(3 = k\)
Mark scheme (b)
Answer
Marks
Part marks and guidance
0.4 and 2.6
2
B1 for 0.4 or 2.6
or
M1 for line \(y = 3\) drawn or for \((0.4, 3)\) and \((2.6, 3)\) indicated
Line to cut curve twice Treat \(x = 3\) drawn or multiple horizontal lines as choice unless \(y = 3\) clearly chosen Condone good freehand line eg circled or lines drawn down to \(x\)-axis
19 The graph shows the velocity of a particle over the first 20 minutes of its motion.
Not to scale
Between 7 minutes and 15 minutes the velocity of the particle is \(v\) metres per minute. The average velocity of the particle over the 20 minutes is 11.55 metres per minute.
Find the value of \(v\). You must show your working. [5]
Mark scheme
Answer
Marks
Part marks and guidance
16.5 with correct working
5
M1 for 11.55 × 20 implied by 231
AND
M2 for \(\frac{1}{2}\)(20+(15 – 7)) × \(v\) implied by \(14v\) or \(\frac{28v}{2}\) or M1 for an attempt at area e.g. one of the three areas correct e.g. \(\frac{1}{2}\) × 7 × \(v\)
M1 for their 231 ÷ their 14 oe
If 0 or M1 scored, instead award SC2 for answer 16.5 with no or insufficient working
“Correct working” requires evidence of at least M1 AND M2
Condone letters other than \(v\) and working could be on the diagram.
in parts \(\frac{1}{2}\) × 7 × \(v\) + (15−7) × \(v\) + \(\frac{1}{2}\) ×(20−15) × \(v\) For M2 allow a proportionality argument e.g. \(\frac{1}{2}\) × 7 mins + (15 − 7) mins + \(\frac{1}{2}\) × (20 − 15) mins [= 14 mins at \(v\) m/min] their 231 is any number derived from 11.55 and implied by 0.825 and their 14 has got to be an attempt at the whole ‘area’ implied by e.g 20
condone the use of trials, we must see one at 16.5, award M2 for a trial at 16.5 and M1 for any other positive trial (see appendix)
Appendix: Question 19
Trials are for values of \(v\) and evaluate the area ÷20 so here are some :
Use of (0, 2) scores 0 but may be replaced with another point (ie do not treat as a choice)
Examples of intermediate steps
\(4 = 2k - 2^2 + 2\) then \(4 = 2k - 4 + 2\) is a sufficient int step or \(4 = 2k - 2\) is a sufficient int step or \(6 = 2k\) is a sufficient int step \(3 = k\)
Mark scheme (b)
Answer
Marks
Part marks and guidance
0.4 and 2.6
2
B1 for 0.4 or 2.6
or
M1 for line \(y = 3\) drawn or for (0.4, 3) and (2.6, 3) indicated
Line to cut curve twice Treat \(x = 3\) drawn or multiple horizontal lines as choice unless \(y = 3\) clearly chosen Condone good freehand line eg circled or lines drawn down to \(x\)-axis
7 Here is a table of values for \(y = \frac{6}{x} - 2x\).
\(x\)
\(-4\)
\(-3\)
\(-2\)
\(-1\)
1
2
3
4
\(y\)
6.5
4
1
\(-4\)
4
\(-1\)
\(-4\)
\(-6.5\)
(a) Draw the graph of \(y = \frac{6}{x} - 2x\) for \(-4 \leqslant x \leqslant 4,\ x \ne 0\).[3]
(b) Use your graph to find the positive solution of \(\frac{6}{x} - 2x = 0\).
Give your answer to 1 decimal place. [1]
Mark scheme (a)
Answer
Marks
Part marks and guidance
Two accurate curves
3
B2 for 7 or 8 points plotted accurately
or
B1 for 5 or 6 points plotted accurately
Ignore the curve beyond points but the curve must not cross or touch the \(y\)-axis
tolerance ± \(\frac{1}{2}\) small square from correct points radially
no excessive feathering, no ruled lines, no excessive ‘tram lines’
overlay gives guidance only
Mark scheme (b)
Answer
Marks
Part marks and guidance
A correct and accurate reading from their graph
1FT DEP.
Dep. on a graph in (a) with at least one positive solution and strict FTtheir curve.
If curve crosses \(x\)-axis between two grid lines accept either grid line value as correct answer If their curve has more than one positive solution accept any of their correct solutions
Do not accept answers to more than 1d.p., \(\sqrt{3}\) or answers clearly rounded from this. CONDONE whole numbers where appropriate e.g. 2 for 2.0 Do not accept 0 as positive.
(b) The line AB joins point A to point B. Point B is at \((2, 3)\).
Find the length of the line AB. [1]
(c) On the grid, draw the line \(x = 2\). [1]
(d) ABCD is a square that fits on the grid. Point C is on the line \(x = 2\).
Find the coordinates of point D. [2]
Mark scheme (a)
Answer
Marks
Part marks and guidance
\((-3, 3)\) plotted correctly
1
Use overlay if in doubt Take centre of mark as position If A used as plot, scores 1 if centre of A in correct position
Mark scheme (b)
Answer
Marks
Part marks and guidance
5
1
Mark scheme (c)
Answer
Marks
Part marks and guidance
Ruled vertical line \(x = 2\)
1
Accept good freehand and dashed line If more than one vertical line and no clear choice mark the worst, ignore line at \(x = -3\) If \(y = 2\) also drawn and not rejected, treat as choice Use overlay to check if in doubt At least 2 cm long. If line more than 2 cm then must be in overlay throughout length.
Mark scheme (d)
Answer
Marks
Part marks and guidance
\((-3, -2)\)
2
B1 for answer \((2, -2)\) or \((-3, -2)\) seen or plotted on grid If 0 scored, SC1 for answer \((-3, \ldots)\) or \((\ldots, -2)\)
21 The graph of \(y = \dfrac{1}{x - 2}\) is drawn on the grid for \(-2 \leqslant x \leqslant 6\).
(a) There are no values of \(x\) for which \(\dfrac{1}{x - 2} = k\).
Find the value of \(k\). [1]
(b)
(i)Use the graph to find approximate solutions to the equation \(\dfrac{1}{x - 2} = 3x - 1\). Give your answers to 1 decimal place. Show your working on the graph. [4]
(ii) Show algebraically that \(\dfrac{1}{x - 2} = 3x - 1\) has the same solutions as \(3x^2 - 7x + 1 = 0\). [4]
Mark scheme (a)
Answer
Marks
Part marks and guidance
[k = ] 0
1
Mark scheme (b)
Answer
Marks
Part marks and guidance
(b)(i)
\(y = 3x - 1\) ruled
M2
M1 for correct freehand or short line or for \(y = 3x - k\) ruled or \(y = ax - 1\) ruled but not \(y = -1\)
For M2 must cross curve twice Accuracy ± 1mm at (0, -1) and (1, 2)
0.1 to 0.3 and 2.1 to 2.3
A2
A1 for each After A0, SC1 for both values correct
Only award if M2 scored previously 0.15287… , 2.1804….
(b)(ii)
\(1 = (3x - 1)(x - 2)\)
M1
Allow recovery from missing brackets for M1 or ‘ = 1’
\(3x^2 - x - 6x + 2\)
B2
For correctly expansion of brackets B1 for 3 terms correct in expansion
For B2 accept \(3x^2 - 7x + 2\) For B1 \(-7x\) counts as two terms
The sketch shows the circle and two points, A and B, which lie on the circumference of the circle.
(a) Write down the coordinates of point A. [1]
(b) Point B has \(x\)-coordinate 3.
Find the exact value of the \(y\)-coordinate of point B. [3]
(c) Another point, C, lies on the circle and has a \(y\)-coordinate that is seven times its \(x\)-coordinate.
Find the two possible pairs of coordinates for point C. Give your answers in exact form. You must show your working. [5]
Mark scheme (a)
Answer
Marks
Part marks and guidance
(10, 0)
1
Mark scheme (b)
Answer
Marks
Part marks and guidance
\(-\sqrt{91}\)
3
B2 for \(\sqrt{91}\) or −9.539[…] or −9.54
or
B1 for 9.539[…] or 9.54
or
M1 for \(9 + y^2 = 100\) oe
± answers treat as choice
Mark scheme (c)
Answer
Marks
Part marks and guidance
\((\sqrt{2},\ 7\sqrt{2})\) and \((-\sqrt{2},\ -7\sqrt{2})\) with correct working
5
B4 for \((\sqrt{2},\ 7\sqrt{2})\) with correct working or \((-\sqrt{2},\ -7\sqrt{2})\) with correct working
or
M2 for \(x^2 + (7x)^2 = 100\) oe A1 for [\(x = \pm\)] \(\sqrt{2}\)
or
M1 for 7\(x\) seen
If 0 or 1 or 2 scored, instead award SC3 for answer \((\sqrt{2},\ 7\sqrt{2})\) and \((-\sqrt{2},\ -7\sqrt{2})\) with no working or insufficient working
If 0 or M1 scored, instead award SC2 for answer \((\sqrt{2},\ 7\sqrt{2})\) or \((-\sqrt{2},\ -7\sqrt{2})\) or for \(\left(\frac{5\sqrt{2}}{2}, \frac{35\sqrt{2}}{2}\right)\) and \(\left(-\frac{5\sqrt{2}}{2}, -\frac{35\sqrt{2}}{2}\right)\) with no working or insufficient working
If 0 scored, instead award SC1 for [\(x = \pm\)] \(\sqrt{2}\) or for \(\left(\frac{5\sqrt{2}}{2}, \frac{35\sqrt{2}}{2}\right)\) or \(\left(-\frac{5\sqrt{2}}{2}, -\frac{35\sqrt{2}}{2}\right)\) with no working
“Correct working” requires evidence of at least M2 Allow \(\sqrt{98}\) for \(7\sqrt{2}\)
16 A ball of dough is left to rise before it is baked. The graph shows the height of the ball of dough over the first 20 minutes.
(a) Work out the gradient of the line as a decimal, giving the units of your answer. Show how you work out your answer. [3]
(b) A baker works out the height of the ball of dough at the end of 25 minutes as 14 cm.
(i) Use your gradient to show that the baker could be correct. [2]
(ii) What assumption has the baker made? [1]
Mark scheme (a)
Answer
Marks
Part marks and guidance
0.2 or 0.19 to 0.20
2
M1 for \(\dfrac{3.8 \text{ to } 4}{20}\) oe
If 0 scored, SC1 for triangle with incorrect values marked and their \(\dfrac{\text{rise}}{\text{run}}\) or \(\dfrac{\text{rise}}{\text{run}}\) with answer in range \(0.18 \leqslant g \lt 0.19\)
e.g. \(\dfrac{1.9 \text{ to } 2}{10}\)
e.g. \(\dfrac{13}{20}\) with no triangle scores 0 e.g. \(\dfrac{13}{20}\) with 13 and 20 marked on triangle scores SC1 e.g \(\dfrac{2.1}{11.6}\) and answer 0.181... SC1
cm per minute or cm/min
1
Mark for units still available even if wrong gradient
Mark scheme (b)
Answer
Marks
Part marks and guidance
(i) \(5 \times\) their gradient
M1
FT their gradient which is a number
Alternative method M2 for \(25 \times (0.19\) to \(0.2) + 9\) with answer that rounds to 14 or M1 for 25 × their gradient + 9 with answer that does not round to 14
13 + their 1 giving answer that rounds to 14
M1
(ii) Continues to rise at same rate oe or Rises 0.2 cm every minute oe
1
FT their gradient if figures quoted
Must imply constant increase [in height] or continued pattern If figures used must be correct or from their gradient Accept The pattern continues oe The dough rises consistently oe The dough will rise I cm in 5 minutes
12 The graph shows the speed of a car during the first 40 seconds of a journey.
(a) Write down the acceleration of the car between 10 seconds and 25 seconds, in m/s2. [1]
(b) Work out the average speed of the car, in m/s, during the 40 seconds. You must show your working. [5]
Mark scheme (a)
Answer
Marks
Part marks and guidance
0
1
Mark scheme (b)
Answer
Marks
Part marks and guidance
12.37[5] or 12.38 or 12.4 all oe and with correct working
5
M3 for \(\frac{(15 + 40) \times 18}{2}\)
or
M2 for attempt at total area with one reading or one calculation error
or
M1 for one area calculation
AND
M1dep for their 495 ÷ 40
If 0 or 1 scored, instead award SC2 for answer 12.37[5] or 12.38 or 12.4 all oe with no working or insufficient working
If 0 scored SC1 for 495 with no working or insufficient working
“Correct working” requires evidence of at least M3
Areas may be found in stages e.g. M3 for \(\left(\frac{1}{2} \times 10 \times 18\right) + (15 \times 18) + \left(\frac{1}{2} \times 15 \times 18\right)\) implied by 90 + 270 + 135
e.g. use of 16 rather than 18 throughout is one error but both triangles incorrect is two errors
(b) Draw the graph of \(y = x^2 - 5\) for the values of \(x\) from \(-4\) to 3.
[3]
(c) Use the graph to solve the equation \(x^2 - 5 = 0\).
Give your answers to 1 decimal place. [2]
Mark scheme (a)
Answer
Marks
Part marks and guidance
11 \(-5\)
2
B1 for each
Mark scheme (b)
Answer
Marks
Part marks and guidance
Correct curve
3
B2ft for 7 or 8 points accurately plotted or B1ft for 5 or 6 points accurately plotted
Tolerance \(\pm\tfrac{1}{2}\) small square radially
Mark scheme (c)
Answer
Marks
Part marks and guidance
\(-2.3\) or \(-2.2\) 2.2 or 2.3
2 FT
Strict FT B1 for either FTtheir graph
If curve is between 2 grid lines accept either value as correct answer Do not accept answers to more than 1d.p. Do not allow \(\pm\sqrt{5}\) or answers with no graph
AND M1dep for \(y - 5 = \textit{their } \frac{12}{5}(x - (-12))\) oe
Dep on at least M1 oe e.g. \(5 = \textit{their } \frac{12}{5} \times -12 + c\) Do not allow M1 for e.g. grad \(-\frac{5}{12}\) used if the gradient is then changed subsequently to e.g. \(\frac{12}{5}\)
or M1dep for \(y = \textit{their } \frac{12}{5}x + c\)
Dep on at least M1 Allow ‘\(c\)’ or any value including 0
M2 for \(0 = -(-3)^2 - 3b + c\) and \(0 = -5^2 + 5b + c\) or M1 for \(y = -x^2 + bx + c\) or for \(0 = (-3)^2 - 3b + c\) and \(0 = 5^2 + 5b + c\)
Appendix: exemplar response for Q16(a)
Response
Judgement
Mark
\((x + 3)(x - 5)\) \(= x^2 - 2x - 15\) But the quadratic is upside down so it will be \(-x^2 + 2x + 15\) [there then was an arrow from the +15 to the intercept]
The response doesn’t quite fit the scheme but is thought worthy of full marks This line on its own scores M1 But this line makes it equivalent to the M2 and it also a correct expansion with + 15 The linking of +15 to the intercept is an added bonus
Mark scheme (b)
Answer
Marks
Part marks and guidance
The equation could be a multiple E.g. [\(y =\)] \(-k(x + 3)(x - 5)\) So the intercept could be a multiple of 15
2
B1 for giving an example in the form \(-k(x + 3)(x - 5)\) (where \(k > 0\), \(k \ne 1\), \(k\) need not be an integer) or stating that the intercept could be a multiple of 15
Allow full or part marks for a fully correct algebraic example E.g. [\(y =\)] \(-2(x + 3)(x - 5)\) would have a \(y\)-intercept of 30
8 Here is a table of values for \(y = x^2 + 2x - 2\).
\(x\)
−4
−3
−2
−1
0
1
2
\(y\)
6
1
−2
−3
−2
1
6
(a) Draw the graph of \(y = x^2 + 2x - 2\) for \(-4 \leqslant x \leqslant 2\).
[3]
(b) Write down the equation of the line of symmetry of the graph. [1]
(c) Use the graph to solve the equation \(x^2 + 2x - 2 = 0\). Give your answers to 1 decimal place. [2]
Mark scheme (a)
Answer
Marks
Part marks and guidance
accurate curve
3
B2 for 6 or 7 points accurately plotted or B1 for 4 or 5 points accurately plotted
tolerance \(\pm \frac{1}{2}\) small square radially for curve and points, condone a wobbly curve and slight feathering or tram lines in no more than 3 sections but no ruled lines
Mark scheme (b)
Answer
Marks
Part marks and guidance
\(x = -1\) oe
1
Mark scheme (c)
Answer
Marks
Part marks and guidance
−2.8 or −2.7 0.7 or 0.8
2
B1 for either If 0 or 1 scored FTtheir curve for 1 or 2 marks or SC1 for an answer in each of −2.8 to −2.7 and 0.7 to 0.8
tolerance \(\pm \frac{1}{2}\) small square radially
(b) Draw the graph of \(y = x^2 - 3\) for values of \(x\) from \(-3\) to 3.
[3]
(c) Use your graph to solve \(x^2 - 3 = 2\). [2]
Mark scheme (a)
Answer
Marks
Part marks and guidance
6 and \(-3\)
2
B1 for each
Mark scheme (b)
Answer
Marks
Part marks and guidance
Correct curve
3
B2FT for 6 or 7 correct plots B1FT for 4 or 5 correct plots
Tolerance \(\pm 1\) small square for plotting and curve through correct points. Condone slight feathering – must not be ruled If large blob for plot, check centre of blob
Mark scheme (c)
Answer
Marks
Part marks and guidance
\(-2.3\) to \(-2.2\) and 2.2 to 2.3
2FT
Strict FT B1 for either FT their graph
Tolerance \(\pm\tfrac{1}{2}\) a small square Do not allow exact answers or answers with no graph Do not FT from a straight line graph
If more than 2 intersections, B1 for each correct intersection on the answer line. If more than 2 answers, mark the worst.
(b) Draw the graph of \(y = \dfrac{6}{x}\) for \(-6 \leqslant x \leqslant 6\), \(x \ne 0\).
[3]
Mark scheme (a)
Answer
Marks
Part marks and guidance
−3
1
Mark scheme (b)
Answer
Marks
Part marks and guidance
Correct graph
3
Curves must not be joined or touch either axis
Mark in 50% zoom, use overlay, mark curve first For 3 marks, curve must pass through or touch circles on overlay Condone slight feathering, no ruled segments
B2FT for 7 or 8 correct plots Or B1FT for 5 or 6 correct plots
If curve incorrect, mark the plots use the overlay, plots must lie inside or touch circles. If large blob for plot, check centre of blob
(b) The graph of \(y = x + 1\) is shown on the grid.
On the same grid, use part (a) to draw the graph of \(y = x^2 - x\) for values of x from \({}^{-}2\) to 3.
[3]
(c) Write down the \(x\)-coordinates of the points where \(y = x^2 - x\) and \(y = x + 1\) cross. [2]
Mark scheme (a)
Answer
Marks
Part marks and guidance
2 0
2
B1 for each
Mark scheme (b)
Answer
Marks
Part marks and guidance
Correct curve
3
B2FT for all points correctly plotted or B1FT for 4 or 5 points correctly plotted
FT their values from the table in (a) for points but accept only the correct curve. Accuracy ± half small square Correct curve must have at least one square of daylight below \(x\)-axis at minimum point and not intended straight
Mark scheme (c)
Answer
Marks
Part marks and guidance
\({}^{-}[0].4\) and 2.4
2
Correct answer or FTtheir graph for both B1 for each
-0.45 to -0.35 and 2.35 to 2.45 FT from their line with half square accuracy (may be straight)
20 A pattern is made from four congruent right-angled triangles.
Not to scale
The line AC is parallel to the x-axis. The point A has coordinates (4, 9) and the point B has coordinates (17, 12).
Work out the coordinates of point C and point D. [5]
Mark scheme
Answer
Marks
Part marks and guidance
C (24, 9) D (10, 2)
5
B4 for three correct ordinates or B3 for two correct ordinates or B2 for one correct ordinate from 24, 10, 2 or for longer length of triangle = 7 soi or B1 for 9 as \(y\)-coordinate for C or for shorter length of triangle = 3 soi
OR
M1 for long = 17 – 4 – 2 × their short oe A1FT for C (4 + 2 × their short + 2 × their long, 9)) A1FT for D (4 + 2 × their short, 9 – their long)
For part marks, check ordinates first (may be on diagram if answer line blank) .If B2 or fewer check alt method and mark to candidates’ advantage
B4, B3, B2, B1 May be on diagram
For M1 and A1FT, their short and their long needs to be clear in working or on diagram
(a) The graph shows the speed of a vehicle during the first 40 seconds of motion.
Calculate the distance travelled by the vehicle during the 40 seconds. [3]
(b) The graph shows the distance travelled by a particle over 6 seconds.
(i) Work out the average speed of the particle between 2 and 4 seconds. [2]
(ii) Estimate the speed of the particle at 4 seconds. [4]
Mark scheme (a)
Answer
Marks
Part marks and guidance
975
3
M2 for \((\frac{40 + 25}{2}) \times 30\) oe or \(\frac{1}{2} \times 15 \times 30 + 25 \times 30\) or M1 for one relevant area e.g. \(\frac{1}{2} \times 15 \times 30\) or 25 × 30 or 40 × 30
(a) Write \(x^2 - 10x + 22\) in the form \((x - a)^2 - b\). [3]
(b) Sketch the graph of \(y = x^2 - 10x + 22\). Show clearly the coordinates of any turning points and the value of the \(y\)-intercept.[4]
Mark scheme (a)
Answer
Marks
Part marks and guidance
\((x - 5)^2 - 3\) final answer
3
B1 for \((x - 5)^2\) B2 FT for – 3 or M1 for \(22 - (-5)^2\) oe
M1 FT \(22 - (\textit{their}\ {-5})^2\) oe
Mark scheme (b)
Answer
Marks
Part marks and guidance
Correct sketch with TP at (5, −3) in 4th quadrant and \(y\) – intercept at (0, 22)
4
FT their (a) for TP M1 for U shaped curve B2FTdeptheir (a)for TP at (5, –3) in correct quadrant or B1FTdep for turning point at (\(k\), –3) or (5, \(k\)) soi FT for B2 or B1 dep on answer of form \((x - a)^2 - b\) in part (a), \(a, b \ne 0\)
B1 for \(y\) – intercept at 22 indicated
Be generous for the U shape condone broken line Values for \(y\) - intercept and TP must be shown but could be marked on axes. Mark intention Accept turning point = (5, –3)FT written in working provided no contradiction on sketch If point (5, –3)FT only plotted on graph in 4th quadrant and no sketch then B2 only
19 The graph of \(y = 2x^2 + 3x - 9\) is drawn below.
(a) Use the graph to solve \(2x^2 + 3x - 9 = 0\). [2]
(b) The equation \(2x^2 + x - 4 = 0\) can be solved by finding the intersection of the graph of \(y = 2x^2 + 3x - 9\) and the line \(y = ax + b\).
(i) Find the value of \(a\) and the value of \(b\). [2]
(ii) Hence use the graph to solve the equation \(2x^2 + x - 4 = 0\). [3]
Mark scheme (a)
Answer
Marks
Part marks and guidance
[x =] -3, 1.5
2
B1 for 1 correct
Mark scheme (b)
Answer
Marks
Part marks and guidance
(i) [a =] 2
[b =] -5
2
B1 for each or for \(2x - 5\) seen
(ii) \(y = 2x - 5\) or FT \(y = \textit{their}\ ax + \textit{their}\ b\) ruled on grid
M2
M2 and M1 apply to \(y = 2x - 5\) or FT \(y = \textit{their}\ ax + \textit{their}\ b\)
M1 for ‘correct’ \(y\)-intercept or for ‘correct’ gradient or for freehand or broken ‘correct’ line or for at least 3 ‘correct’ plots and no ‘incorrect’ plots
For M2 line must cross curve For M2 and M1, accuracy 1 small square at y-intercept (extended if necessary provided it fits on the grid) and gradient ±1 small square vertically for a run of 1 unit horizontally Do not FT if a = 0 or b = 0
3 The graph shows the cost of electricity with Company A.
(a) Use the information in the graph to estimate the cost of electricity for a customer who uses 450 kwH of electricity. [3]
(b) Company B charges 14.3 pence per kwH of electricity used.
If Company B’s cost of electricity was plotted on the same axes as Company A’s cost of electricity, which line would be steeper? Explain how you know. [3]
Mark scheme (a)
Answer
Marks
Part marks and guidance
55.5[0] to 57.[0] nfww
3
M1 for 1 kwH costs £0.125 oe soi
M1 for their 0.125 × 450 or cost × \(\frac{450}{\textit{their equivalent electricity use}}\)
OR
M1 for finding costs of electricity that sum to 450 kwH M1 for addition of these costs
(a) Write \(x^2 - 6x + 11\) in the form \((x - a)^2 + b\). [3]
(b) Sketch the graph of \(y = x^2 - 6x + 11\). Show clearly the coordinates of any turning points.[3]
Mark scheme (a)
Answer
Marks
Part marks and guidance
\((x - 3)^2 + 2\) final answer
3
B1 for \((x - 3)^2\) B2 FT for 2
or M1 for \(11 - (\textit{their} -3)^2\) If 0 scored, SC2 for final answer \((x - 3) + 2\)
FT can be implied, check \(11 - (\textit{their} -3)^2\)
Mark scheme (b)
Answer
Marks
Part marks and guidance
U shaped parabola with minimum value indicated in 1st quadrant at (3, 2)
3
FT U-shaped parabola with turning point at their (– \(a\), \(b\)) from part (a) dep on answer of form \((x + a)^2 + b\) where \(a \ne -3\) and/or \(b \ne 2\)
B1 for U shape curve
B1 for turning point at (3, \(k\)) or FT for turning point at (–\(a\), \(k\)) dep on answer of form \((x + a)^2 + b\) in part (a) B1 for turning point at (\(k\), 2) or FT for turning point at (\(k\), \(b\)) dep on answer of form \((x + a)^2 + b\) in part (a)
Be generous for the U shape condone broken line Sketch takes priority when marking Do not allow all 3 marks if (3, 2) indicated on U shaped parabola but TP on sketch is in wrong quadrant Values must be shown but could be marked on axes. Mark intention Accept turning point = (3, 2) written in working provided no contradiction on sketch
If point (3, 2) only plotted on graph and no sketch then B0B1B1
Notes
(corrected from the printed mark scheme: the form of the part (a) answer is printed as \((x + a)^2 - b\) in three places; it is \((x + a)^2 + b\), matching the turning point (–\(a\), \(b\)) and the answer \((x - 3)^2 + 2\))
19 The graph shows the distance travelled by a particle over 8 seconds.
Estimate the speed of the particle at 5 seconds. [4]
Mark scheme
Answer
Marks
Part marks and guidance
1.0 to 1.4 dep. on a tangent drawn
4
B3 for an answer within the given range with a slightly inaccurate tangent, i.e. touches curve in range \(t\) = 4.5 to 5.5 but not at \(t\) = 5 or an answer of 1.3 using a symmetric chord about \(t\) = 5 e.g. from (4, 2) to (6, 4.6).
OR
B2 for an answer from using a symmetric chord about \(t\) = 5, e.g. from (4, 2) to (6, 4.6), with at most one error
OR
M1 for an attempt to draw a tangent touching curve at \(t\) = 5
and
M2 for their distance ÷ their time e.g. (7.4 – 1.2) ÷ (8 – 3) or M1 for an attempt at their distance ÷ their time with one error or a correct attempt to find the gradient of their line which is not a tangent e.g. line from (0, 0) to (5, 3) which gives the average speed of \(\frac{3}{5}\) or 0.6
(b) Draw the graph of \(y = x^2 - 4x + 1\) for \(-1 \leqslant x \leqslant 5\).[3]
(c) On the same grid, draw the graph of \(y = 2x - 6\) for \(-1 \leqslant x \leqslant 5\). [3]
(d) Use your graphs to solve the equation \(x^2 - 4x + 1 = 2x - 6\).
Give your answers to 1 decimal place. [2]
Mark scheme (a)
Answer
Marks
Part marks and guidance
Completes table with
\(x\)
–1
0
1
2
3
4
5
\(y\)
6
1
–2
–3
–2
1
6
2
B1 for at least 2 correct values
Mark scheme (b)
Answer
Marks
Part marks and guidance
Correct curve
3
B2 for 6 or 7 points correctly plotted FT their table or B1 for 4 or 5 points correctly plotted FT their table
Tolerance ±2 mm for plotting and curve through the correct points. Strict marking of ‘smooth curve’ – must not be ruled or ‘feathered’
Mark scheme (c)
Answer
Marks
Part marks and guidance
Straight line passing through (0, –6) and (3, 0)
3
M2 for a correct unruled line or a straight line of gradient 2 or a straight line passing through (0, –6) or two correct points correctly stated or plotted or M1 for one correct point stated or plotted
\(x\)
–1
0
1
2
3
4
5
\(y\)
–8
–6
–4
–2
0
2
4
Mark scheme (d)
Answer
Marks
Part marks and guidance
1.6 and 4.4
2FT
B1 for each or both answers as decimals to a greater accuracy Correct answer or FT their straight line
Tolerance ±1 mm.
Do not allow exact answers \(3 + \sqrt{2}\) and \(3 - \sqrt{2}\)
19 The graph of \(y = x^3 - x^2 - 2\) is drawn on the grid.
(a) Use the graph to solve \(x^3 - x^2 - 2 = 0\). Give your answer correct to 1 decimal place. [1]
(b) The equation \(x^3 - x^2 + 5x - 6 = 0\) can be solved by finding the intersection of the graph of \(y = x^3 - x^2 - 2\) and the line \(y = ax + b\).
(i) Find the value of \(a\) and the value of \(b\). [2]
(ii) Hence, use the graph to solve the equation \(x^3 - x^2 + 5x - 6 = 0\). Give your answer correct to 1 decimal place. [3]
Mark scheme (a)
Answer
Marks
Part marks and guidance
1.7 cao
1
Mark at most accurate i.e. do not allow 1.65 = 1.7
Mark scheme (b)
Answer
Marks
Part marks and guidance
(i) [\(a\) =] –5 [\(b\) =] 4
2
B1 for each or for \(-5x + 4\) seen
(ii) Correct line ruled on grid
M2
Strict FT \(y =\) their \(ax\) + their \(b\) M1 for correct \(y\)–intercept (FTtheir \(b\)) or correct gradient (FTtheir \(a\)) or for freehand or broken ‘correct’ line FT \(y =\) their \(ax\) + their \(b\) or for at least 3 correct plots and no incorrect plots FT \(y =\) their \(ax\) + their \(b\)
For M2 line must cross curve For M2 or M1, accuracy ± 1 small square at \(y\) – intercept (extend line if necessary provided it fits on the grid) and gradient ± 1 small square vertically for a run of 1 unit horizontally Do not follow through if \(a = 0\) and/or \(b = 0\)
(b) On the grid below, draw the graph of \(y = 4x - 2\) for values of \(x\) from 0 to 4.
[2]
(c) The diagram below shows part of another straight line.
Find the equation of this straight line. [3]
Mark scheme (a)
Answer
Marks
Part marks and guidance
10
1
Mark scheme (b)
Answer
Marks
Part marks and guidance
Correct continuous ruled line from \(x = 0\) to \(x = 4\)
2
Tolerance 2 mm by eye B1 for 2 points correctly plotted FTtheir table
Mark scheme (c)
Answer
Marks
Part marks and guidance
\(y = -3x + 11\) oe
3
B2 for \(-3x + 11\) or \(y = mx + 11\) (\(m \ne -3\) or 0, \(m\) does not need to be numeric) or \(y = -3x + c\), (\(c\) can be 0, \(c\) does not need to be numeric)
OR
M1 for \(\dfrac{11 - -1}{0 - 4}\) oe
OR
B1 for \(mx + 11\), (where \(m \ne -3\) or 0, \(m\) does not need to be numeric) or \(-3x + c\) (where \(c \ne 11\), \(c\) can be 0, \(c\) does not need to be numeric).
(a) Write \(x^2 + 8x + 3\) in the form \((x + a)^2 - b\). [3]
(b) Sketch the graph of \(y = x^2 + 8x + 3\). Show clearly the coordinates of any turning points and the \(y\)-intercept.
[4]
Mark scheme (a)
Answer
Marks
Part marks and guidance
\((x + 4)^2 - 13\) final answer
3
B1 for \((x + 4)^2\)
B2FT for [+] 3 – their (a)\(^2\) after \((x +\) their \(a)^2\) correctly evaluated or B1 for [+] 3 – their \(a^2\) shown
If 0 scored, SC2 for final answer \((x + 4) - 13\)
FT can be implied eg \((x + 2)^2 - 1\) gets B2FT
Mark scheme (b)
Answer
Marks
Part marks and guidance
U shaped parabola with minimum value indicated in 3rd quadrant at (–4, –13) and intercepts positive \(y\) – axis at 3
4
FT U-shaped parabola with turning point at their \((-a, -b)\) from part (a) dep on answer of form \((x + a)^2 - b\) where \(a \ne 4\) and/or \(b \ne 13\)
Be generous for the U shape condone broken line TP values must be shown but could be marked on axes. Mark intention Sketch takes priority when marking Accept turning point = (– 4, –13) written in working or in table provided no contradiction on sketch
B1 for U shape curve B1 for their curve or line intercepts positive \(y\) – axis at 3
Must be stated on graph, 3 or (0, 3) Do not accept just in a table
B1 for turning point at \((-4, k)\) or FT for turning point at \((-a, k)\) dep on answer of form \((x + a)^2 - b\) in part (a) B1 for turning point at \((k, -13)\) or FT for turning point at \((k, -b)\) dep on answer of form \((x + a)^2 - b\) in part (a)
If point (– 4, –13) only plotted on graph and no sketch then can score these final 2 marks
9 The graph shows Sarah’s journey from her home to a shopping centre.
(a) State an assumption that has been made when the graph was drawn. [1]
(b) What is the distance from Sarah’s home to the shopping centre? [1]
(c) Between which two times did Sarah stop? Explain how the graph shows this. [2]
(d)
(i) Sarah stays at the shopping centre until 13:00. She then travels home without stopping. Her journey home takes 40 minutes.
Complete the graph to show this information. [3]
(ii) Work out Sarah’s average speed for her journey home. Give your answer in kilometres per hour. [3]
Mark scheme (a)
Answer
Marks
Part marks and guidance
She travels at constant speeds oe
1
Any incorrect statement invalidates the reasoning eg implying a constant speed for the entire journey SEE APPENDIX
Appendix
Exemplar responses for Q9a
Response
Mark
Her speed was the same (this does not imply the whole journey)
1
She stayed at a constant speed (BOD as doesn’t refer to whole journey)
1 BOD
Sarah drove at the same speed 2km from home all the way to the shopping centre.
1
The straight lines on the graph show steady speed.
1
She walked at the same pace (BOD, question doesn’t state form of transport)
1
She stayed at the same speed on the way to the shopping centre (implies whole journey)
0
That she was constantly moving and through no traffic. Therefore going at a constant speed. (The first sentence invalidates the reason)
0
She was going the same speed throughout. (implies whole journey so 0)
0
That she rest for 30 minutes after doing 30 minutes of her journey
0
She walked slowly at the beginning and fast at the end (doesn’t imply constant speed)
0
Her journey to the shopping centre would take less than 4 hours (reference to the size of the graph not relevant)
0
Her route did not alter. She went straight to the shopping centre (Incorrect)
0
When she left home she started off and then she goes into constant speed and then she accelerated. Or Sarah was at a constant acceleration. (reference to acceleration is wrong)
0
There was no traffic. (no indication of speed)
0
There are no major issues which cause delay. (Reference to conditions on the journey are irrelevant we need a comment about why we are drawing a straight line)
0
That Sarah did not stop off
0
Her journey is faster from 11:00 (true but nothing about constant speed)
0
She will leave exactly on time (answer MUST refer to constant speed)
0
Mark scheme (b)
Answer
Marks
Part marks and guidance
36
1
Mark scheme (c)
Answer
Marks
Part marks and guidance
10:30[am] and 11:00[am]
1
Accept. eg 11, 1100, 10 30, 10.30 Do not accept eg 11h, 10h30
distance from home stays the same or zero gradient oe
1
SEE APPENDIX
Appendix
Exemplar responses for Q9c
Response
Mark
It goes horizontally
1
Because it’s a straight line not moving up or down which means no distance is being made
1
A horizontal line with no gradient (BOD ‘no’ rather than ‘zero’)
1BOD
It has a flat part
1
The line which goes straight across which means she stopped (word ‘across’ is needed)
1
The distance stayed the same
1
The line during this time does not move in distance but the line still moves on the time showing she was stationary
1
The graph stays on the same level
1BOD
The line doesn’t carry on increasing it stays constant for half an hour. (BOD time referred to therefore ‘it’ must imply distance)
1
The line has no incline
1
Straight line which indicates when Sarah stopped
0
A straight line that does not increase (just ‘straight line’ is not enough – needs to imply distance hasn’t changed with time)
0
The straight parallel line (parallel to ‘time axis’ would be fine to score)
0
The consistent line between the two times meaning that she stopped for 30 minutes (‘consistent’ is not correct)
0
The slope on the graph shows that Sarah stopped (reference to, ‘no slope’ would score)
0
Not going up in a diagonal line and staying straight (‘straight across’ in this statement would be enough to score)
0
A steady line that does not go up (so could go down, horizontal not implied)
0
Mark scheme (d)
Answer
Marks
Part marks and guidance
(i) Horizontal line from (1140, 36) to (1300, 36)
1
Condone freehand line Ignore construction lines Mark endpoint as the vertex with their second line
Line from (their 1300, 36) to reach time axis after their 1300
1
Could be a curve provided no horizontal sections
If no/wrong horizontal section drawn assume (their 1300, 36) to be the start of their line with negative gradient
at (1340, 0) or FT (their 1300 + 40 mins, 0)
1
eg 2 marks for one line such as (1140, 36) to (1220, 0)
(ii) 54
3
M2 for \(\dfrac{36 \text{ or their (b)}}{40} \times 60\) oe or M1 for \(\dfrac{36 \text{ or their (b)}}{40}\) soi by 0.9 or for an equivalent distance to time ratio
8 The graph shows the speed of a cyclist during 20 seconds of a journey.
(a) Find the acceleration of the cyclist
(i) for the first 4 seconds [2]
(ii) between 4 seconds and 14 seconds. [1]
(b) Work out the distance travelled by the cyclist during the 20 seconds. [4]
Mark scheme (a)
Answer
Marks
Part marks and guidance
(i) 2
2
M1 for ‘rise’ ÷ ‘run’ e.g. 8 ÷ 4
(ii) 0
1
Mark scheme (b)
Answer
Marks
Part marks and guidance
150
4
M3 for complete area \(\left[\dfrac{4 \times 8}{2} + (10 \times 8) + \dfrac{(8 + 10) \times 6}{2}\right]\) or M2 for two areas \(\dfrac{4 \times 8}{2}\) oe, \((10 \times 8)\) oe, or \(\dfrac{(8 + 10) \times 6}{2}\) oe or M1 for one area \(\dfrac{4 \times 8}{2}\) oe, \((10 \times 8)\) oe, or \(\dfrac{(8 + 10) \times 6}{2}\) oe
For M2 combining a triangle and a rectangle into a trapezium \(\dfrac{(14 + 10) \times 8}{2}\) counts as “two areas”
Look for answers of 16, 80 and 54.
Allow M marks for calculations from other suitable splitting of the areas
5 This graph shows the cost of buying potatoes from a farm.
(a)
(i) How much does it cost to buy 70 kg of potatoes? [1]
(ii) What weight of potatoes can be bought for £38? [1]
(iii) The cost per kilogram of potatoes is the same for any weight of potatoes.
How much will it cost to buy 180 kg of potatoes from the farm? [3]
(b) This graph shows the annual profits, in thousands of pounds, of the farm between 2013 and 2017.
Describe one misleading feature of the graph. [1]
Mark scheme (a)
Answer
Marks
Part marks and guidance
(i) 28
1
Allow ±0.50
(ii) 95
1
Allow ±1
(iii) 72
3
Allow ±2 B1 for 1kg costs £0.40 soi M1their 0.4 \(\times\) 180 or their cost \(\times \dfrac{180}{\textit{their}\ \text{equivalent weight}}\) or M1 for finding costs of weights that sum to 180 kg M1 for addition of these costs
e.g. 10kg costs £4
e.g. 4 x \(\dfrac{180}{10}\)
Note: award M2 for e.g. cost of 60 kg \(\times\) 3 attempted
Mark scheme (b)
Answer
Marks
Part marks and guidance
one valid reason
1
Such as ‘the vertical scale is not linear’
e.g. vertical scale is wrong vertical scale does not start from 0
(b) Draw the graph of \(y = x^3 - 3x\) for \(-3 \leqslant x \leqslant 3\).[3]
(c) Use your graph to solve \(x^3 - 3x = 10\). [1]
Mark scheme (a)
Answer
Marks
Part marks and guidance
2
1
Mark scheme (b)
Answer
Marks
Part marks and guidance
Fully correct graph
3
B2FT for 7 correctly plotted points or B1FT for 5 or 6 correctly plotted points
Mark in 70% zoom, use overlay, mark curve first For 3 marks, curve must pass through or touch circles on overlay Condone ruled sections for \(-3 \leqslant x \leqslant -2\), \(-1 \leqslant x \leqslant 1\) and \(2 \leqslant x \leqslant 3\) . No vertical section on curve of more than 5 small squares must have min and max Condone slight feathering If curve incorrect, mark the plots use the overlay, plots must lie inside or touch circles. If large blob for plot, check centre of blob
13 The graph shows information about the speed of a vehicle during the final 50 seconds of a journey. At the start of the 50 seconds the speed is \(k\) metres per second. The distance travelled during the 50 seconds is 1.35 kilometres.
(a) Work out the average speed of the vehicle during the 50 seconds. Give your answer in metres per second.
........................................ m/s [2]
(b) Work out the value of \(k\). [5]
(c)
(i) Calculate the gradient of the graph in the final 10 seconds of the journey. [1]
(ii) Describe what this gradient represents. [2]
Mark scheme (a)
Answer
Marks
Part marks and guidance
27
2
M1 for 1350 ÷ 50 If 0 scored SC1 for answer figs 27
Mark scheme (b)
Answer
Marks
Part marks and guidance
30
5
B1 for 1350 M3 for 1350 = 40\(k\) + ½ ×10×\(k\) oe or M2 for 40\(k\) + ½ ×10×\(k\) oe or M1 for any attempt to find any relevant area under the graph
Condone figs 135 for M3 and variable other than \(k\)
Mark scheme (c)
Answer
Marks
Part marks and guidance
(i) –3
1FT
FT (–their (b) ÷ 10)
(ii) [Constant] deceleration oe
1
Condone acceleration The rate at which the speed changes
11 A company tests a new battery for an electric car. The distance the car travels, \(d\) km, and the charge left in the battery, \(C\) %, are measured.
Some measurements are shown in the table.
Distance travelled, \(d\) km.
0
50
100
150
Charge left in the battery, \(C\) %.
100
75
50
25
(a) Plot these values on the grid and use them to draw a straight line.
[2]
(b)
(i) Use your line to estimate the greatest distance the car will travel. [1]
(ii) What assumption is made when estimating the greatest distance? [1]
(c) For your line in part (a), find
(i) the gradient, [1]
(ii) the \(C\)-axis intercept. [1]
(d) Use your answers to part (c) to write down the equation of your graph.
Give your equation in the form \(C = ad + b\). [1]
(e)
(i) Use your equation to find the value of \(C\) when \(d = 210\). [2]
(ii) Comment on your answer. [1]
Mark scheme (a)
Answer
Marks
Part marks and guidance
4 points plotted and a ruled line joining
2
B1 for 3 points correctly plotted
Line at least between (0, 100) and (150, 25) Use overlay as guide. ½ square accuracy
Mark scheme (b)
Answer
Marks
Part marks and guidance
(i) 198 to 202
1
Do not FT their line
(ii) Battery usage remains the same or Battery can be used right to 0% or Trend or pattern continues
1
Accept For every 50 km it uses 25%
Mark scheme (c)
Answer
Marks
Part marks and guidance
(i) \(-\dfrac{1}{2}\) oe or \(-[0].5\)
1
Ignore units
(ii) 100
1
Accept 0, 100
Mark scheme (d)
Answer
Marks
Part marks and guidance
\(-\dfrac{1}{2}d + 100\)
1
FTtheir(c)(i)\(d\) + their(c)(ii)
Accept any letter for \(d\) (except \(c\))
Mark scheme (e)
Answer
Marks
Part marks and guidance
(i) \(-5\)
2
FTtheir(d) if linear in \(d\).
B1 for correct substitution of 210
Expect \(-\dfrac{1}{2} \times 210 + 100\) Accept any letter for \(d\) (except \(c\))
(ii) Impossible [as battery cannot have negative charge] oe
1
FTtheir(i) only if their equation gives negative outcome
10 This graph shows the world population, in billions, between 1951 and 2015.
Use the graph to estimate the average rate of growth of the world population between 1951 and 2015. Give suitable units for your answer. [3]
Mark scheme
Answer
Marks
Part marks and guidance
71 000 000 to 89 000 000 in figs or words
2
M1 for attempt to find ‘gradient’ using figures from the graph e.g. (7.4 – 2.6) ÷ (2015 – 1951)
Could be in billions Eg. (7 400 000 000 – 2 600 000 000) ÷ (2015 – 1951) For M1, condone incorrect conversion used consistently for both population figures.
(b) Draw the graph of \(y = x^2 + x - 4\) for \(-4 \leqslant x \leqslant 3\).[3]
(c) Use your graph to solve \(x^2 + x - 4 = 0\). [2]
(d) On the same grid, draw the graph of \(y = -2x - 1\) for \(-4 \leqslant x \leqslant 3\).
You may use the table if you wish.
\(x\)
−4
\(y\)
7
[3]
(e) Use your graphs to solve the equation \(x^2 + x - 4 = -2x - 1\). [2]
Mark scheme (a)
Answer
Marks
Part marks and guidance
8 −2 −2 8
2
B1 for any 2 correct
Mark scheme (b)
Answer
Marks
Part marks and guidance
correct curve which dips below the line \(y = -4\)
3
B2 for 6 or 7 points correctly plotted FTtheir table or B1 for 4 or 5 points correctly plotted FTtheir table
tolerance ± 2 mm for plotting and the curve through the correct points
Mark scheme (c)
Answer
Marks
Part marks and guidance
−2.7 to −2.5 1.5 to 1.7
2
B1 for each Correct answer or FT their graph
tolerance ± 2 mm
Mark scheme (d)
Answer
Marks
Part marks and guidance
correct ruled line
3
M2 for a correct unruled line or a line of gradient −2 or a line going through (0, −1) or two further correct points in the table or plotted or M1 for one point correctly plotted or one further correct point in the table
points are
\(x\)
−3
−2
−1
0
1
2
3
\(y\)
5
3
1
−1
−3
−5
−7
tolerance ± 2 mm
Mark scheme (e)
Answer
Marks
Part marks and guidance
−3.9 to −3.7 [0].7 to [0].9
2
B1 for each Correct answer or FTtheir straight line
20 The graph shows the speed, in metres per second, of a particle over the first four seconds of motion.
Use the graph to estimate the distance travelled by the particle in the four seconds. [2]
Mark scheme
Answer
Marks
Part marks and guidance
evidence of finding the area under the graph
M1
M1 for evidence of any correct method to find the area under the graph e.g. counting squares (numbers or dots in squares) or use of triangles, trapeziums or rectangles
(a) Sketch the graph of \(y = (x - 2)^2 - 3\). Show the coordinates of any turning points.
[3]
(b) The sketch shows part of a graph which has equation \(y = ax^2 + bx + c\).
Not to scale
Find the values of \(a\), \(b\) and \(c\). [5]
Mark scheme (a)
Answer
Marks
Part marks and guidance
U shaped parabola with minimum value indicated at (2, –3)
3
B1 for U shape curve
B1 for turning point at \((2, k)\) B1 for turning point at \((k, -3)\)
Be generous for the U shape condone broken line Values must be shown but could be marked on axes. Mark intention Accept turning point = (2, –3) written in working provided no contradiction on sketch If point (2, –3) only plotted on graph and no sketch then B0B1B1
Mark scheme (b)
Answer
Marks
Part marks and guidance
4, 16, 12
5
B4 for \(a = 4\) and \(b = 16\) OR B3 for \(c = 12\) and either \(a = 4\) or \(b = 16\) OR M1 for \((x + 3)(x + 1)\) seen isw A1 for \(x^2 + x + 3x + 3\) or better seen isw B1 for \(c = 12\)
OR B1 for \(c = 12\) soi
M1 for \((-1)^2a - 1b + 12 = 0\) oe and \((-3)^2a - 3b + 12 = 0\) oe
Alt method uses simultaneous equations with \(c = 12\) Allow recovery for omission of brackets if negatives correctly dealt with
15 The graph shows the speed, \(v\) metres per second (m/s), of a car at time \(t\) seconds.
(a) Find the speed of the car at \(t = 7\). [1]
(b) It is claimed that the car has accelerated from 0 to 60 miles per hour in the first 10 seconds. Does the graph support this claim? Show your reasoning.
Use 1 mile = 1.6 kilometres. [5]
(c) Use the graph to estimate the acceleration at \(t = 7\). [3]
(d) The speed of this car is directly proportional to the square of the time.
Find a formula linking \(v\) and \(t\). [3]
(e) Georgina says that the graph shows that the speed of the car will continue to increase after 10 seconds.
Make one comment to show that this statement is incorrect. [1]
Mark scheme (a)
Answer
Marks
Part marks and guidance
14 – 15
1
Mark scheme (b)
Answer
Marks
Part marks and guidance
30 from graph
B1
accept any correct method e.g.
Starting with their 30 (using mph) These method marks could be awarded in any order
Starting with 60 (using m/s) These method marks could be awarded in any order M1 × 1.6 soi by 96 M1 × 1000 soi M1 \(\div 60^2\) soi B1 for 30 from graph A1 for 26.6 to 26.7 and 30 so yes
(using km/hr) M1 for 60 × 1.6 soi by 96 B1 for 30 from graph Starting with their 30 These method marks could be awarded in any order M1 \(\times 60^2\) soi M1 ÷ 1000 soi A1 for 96 and 108 so yes
\(\times 60^2\) soi
M1
÷ 1000 soi
M1
÷ 1.6 soi
M1
67.5 so yes
A1
Mark scheme (c)
Answer
Marks
Part marks and guidance
Attempt at a tangent drawn at \(t = 7\)
B1
Accept answer as a fraction and tolerance on reading from graph ± ½ small square Gradient for M1 could be from a chord. Ignore any negative sign
4.0 to 4.5 oe
B2
M1 for an attempt at speed ÷ time, could be on the graph e.g. 30 ÷ 10 or their (a) ÷ 7 soi 2.07… or 2.14..
Mark scheme (d)
Answer
Marks
Part marks and guidance
\(v = kt^2\) where \(0.25 \leqslant k \leqslant 0.33\)
3
SC2 for \(v \propto kt^2\) where \(0.25 \leqslant k \leqslant 0.33\) or B1 for \(v = kt^2\) AND M1 for \(30 = k(10)^2\) or FT their reading from the graph for values of \(v\) and \(t\) or B1 for \(0.25 \leqslant k \leqslant 0.33\)
Condone use of other letters especially \(s\) for speed Can be implied by eg \(30 = k(10)^2\)
\(k\) could be a fraction e.g. \(\frac{15}{49}\)
Mark scheme (e)
Answer
Marks
Part marks and guidance
any correct comment e.g. graph only valid/information only available up to 10 secs or car will eventually reach max. speed
1
See appendix
Appendix: Exemplar responses for Q15(e)
Response
Mark
graph only valid/information only available up to 10 secs
1
car will eventually reach max. speed
1
It could stay at a constant speed
1BOD
It gains enough acceleration its speed becomes constant