
Higher November 2024 Paper 3 Q10
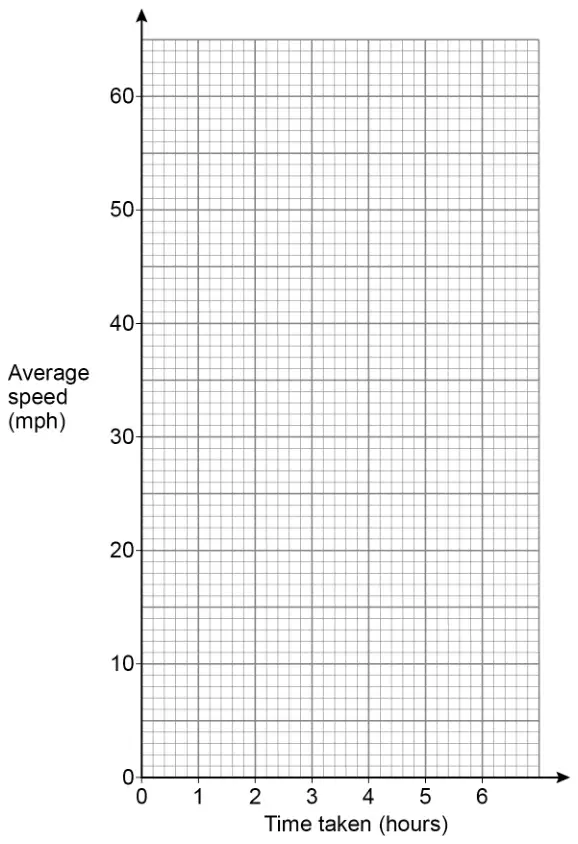
10 A car will travel 60 miles.
Draw a graph to show the average speed of the car for times taken between 1 hour and 6 hours.
You may use the table to help you. [3 marks]
| Time taken (hours) | 1 | 2 | 3 | 4 | 5 | 6 |
|---|---|---|---|---|---|---|
| Average speed (mph) | 60 | 30 | 10 |
| Answer | Mark | Comments |
|---|---|---|
| At least one of 20, 15 and 12 | M1 | may be seen in table or implied by correct point or curve passing through the correct point |
| Points plotted at (1, 60), (2, 30), (3, their 20), (4, their 15), (5, their 12) and (6, 10) | M1 | \(\pm\dfrac{1}{2}\) square implied by curve through these six points |
| Single smooth curve through the correct points | A1 |
Additional guidance
| Ignore curve before \(x = 1\) and after \(x = 6\) if it is decreasing and does not touch either axis | |
| Curve touches at least one axis | A0 |