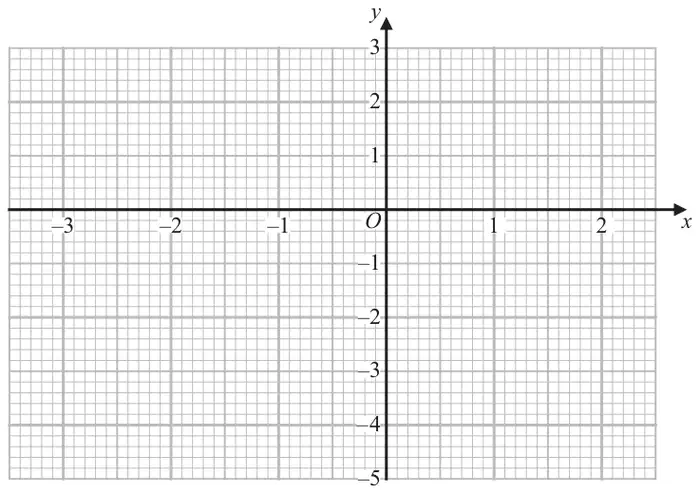
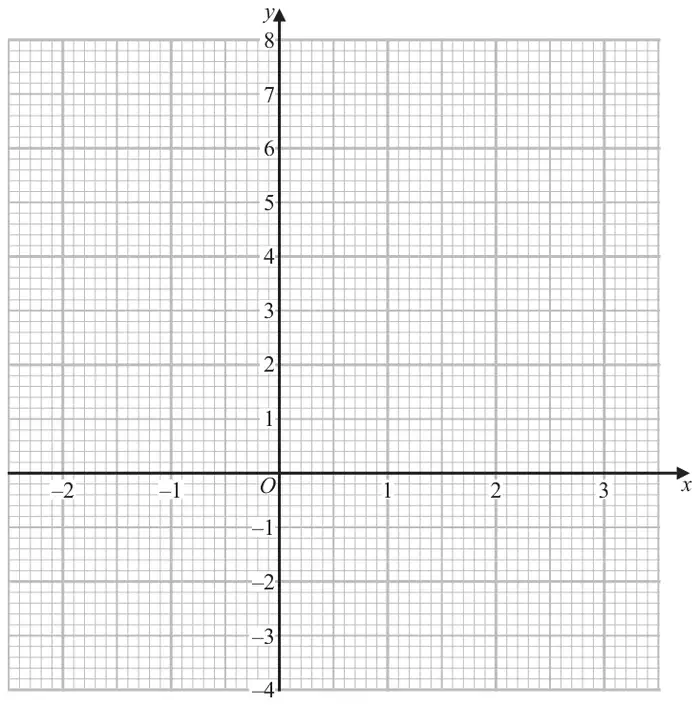
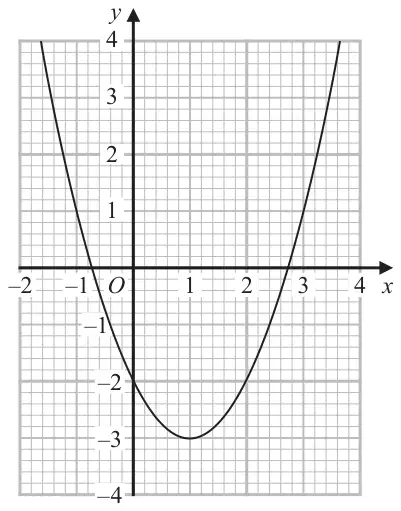
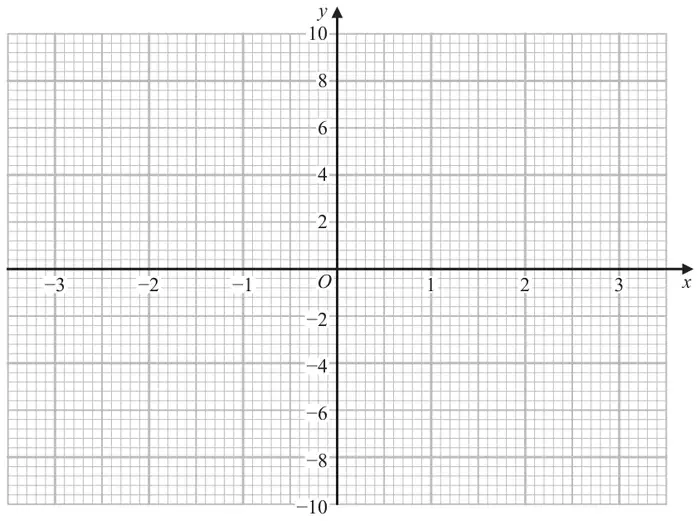
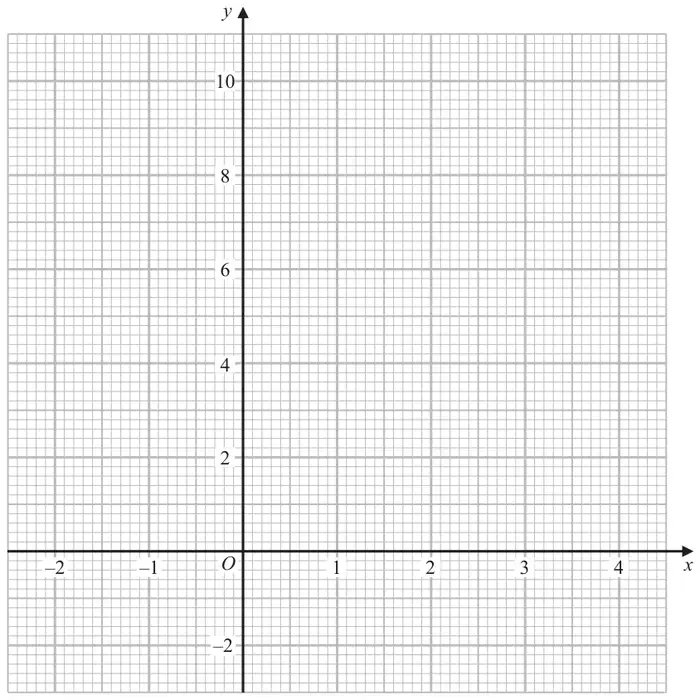
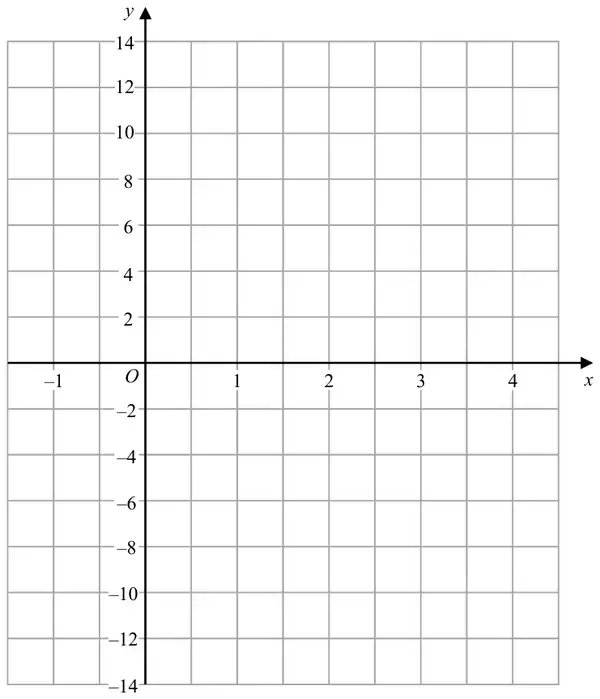
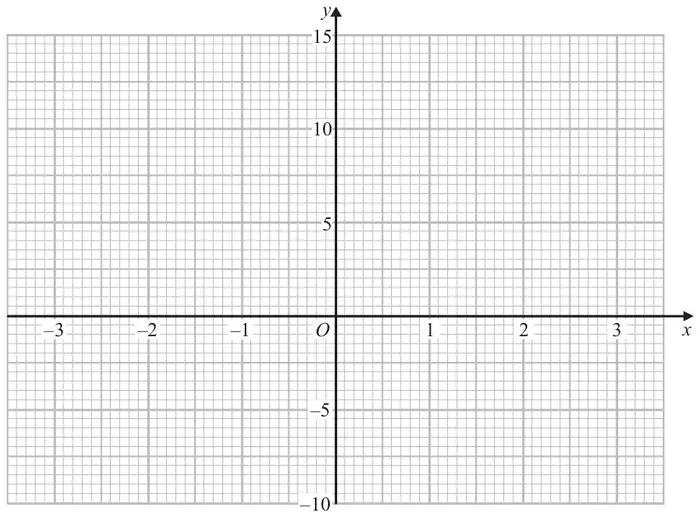
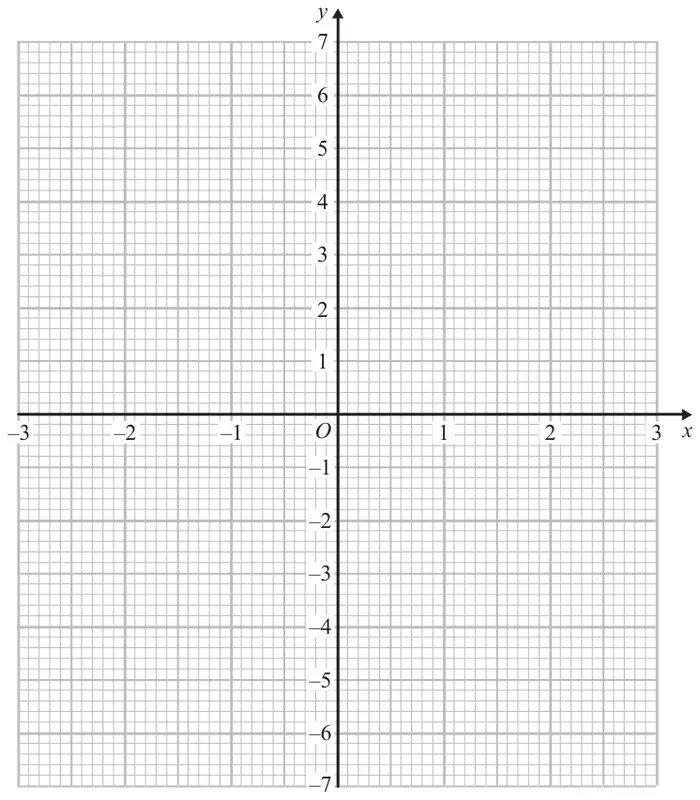
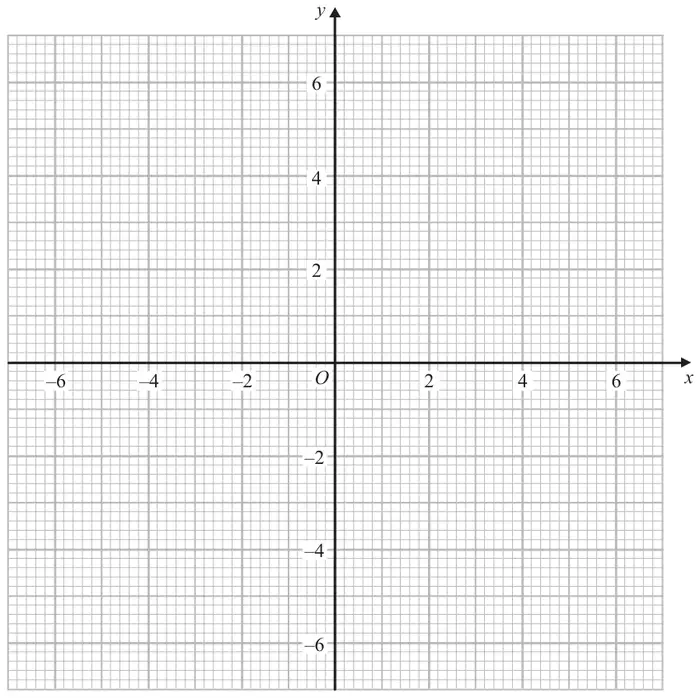
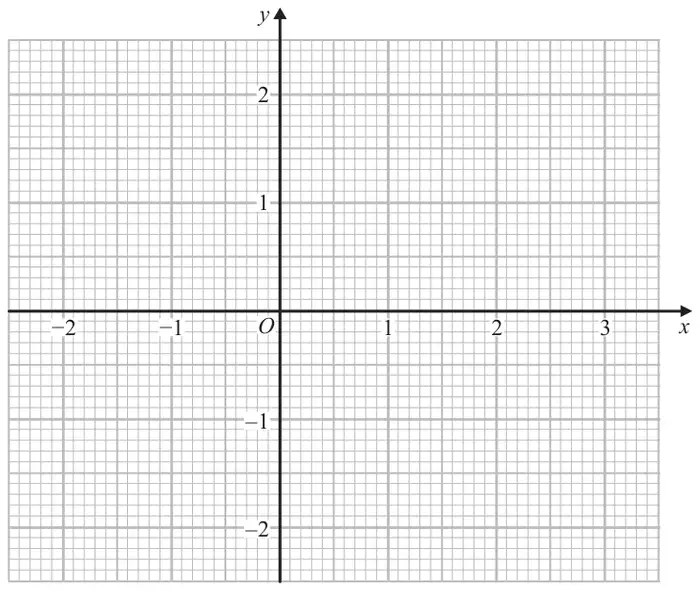
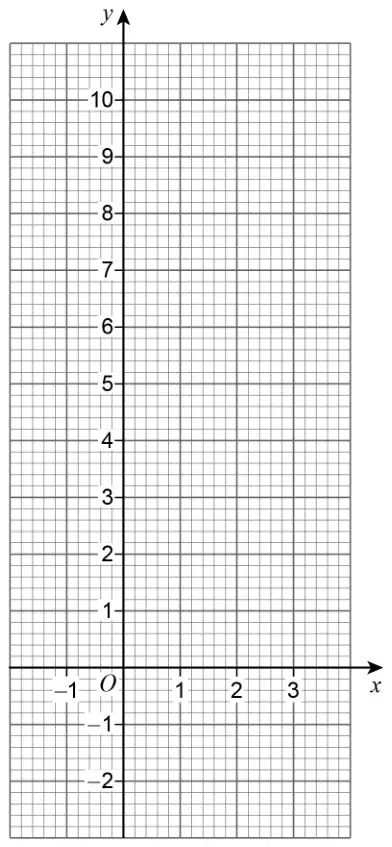
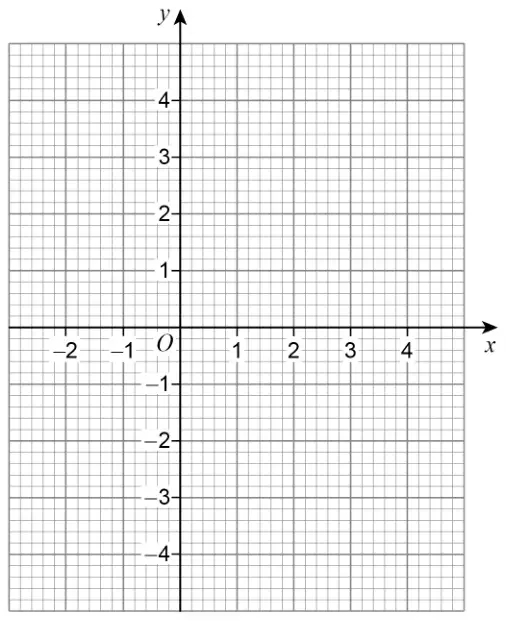
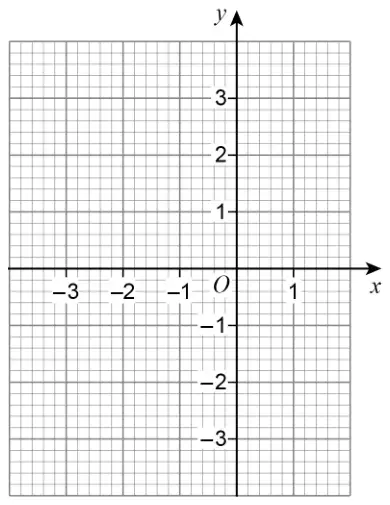
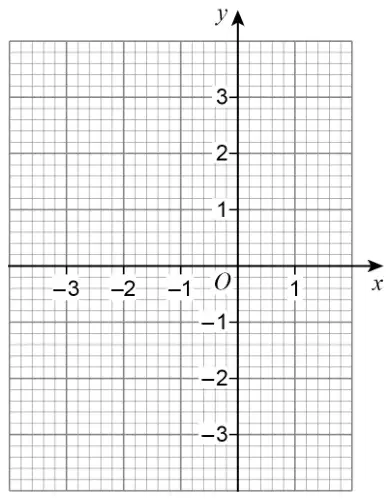
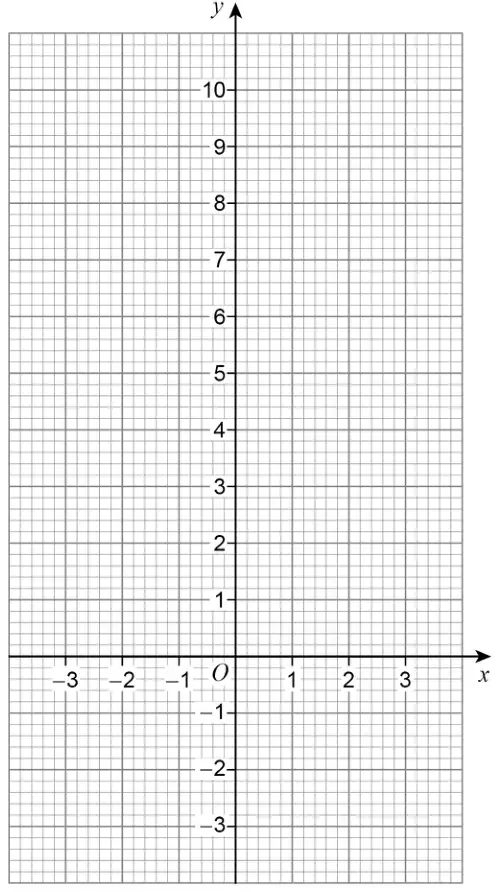
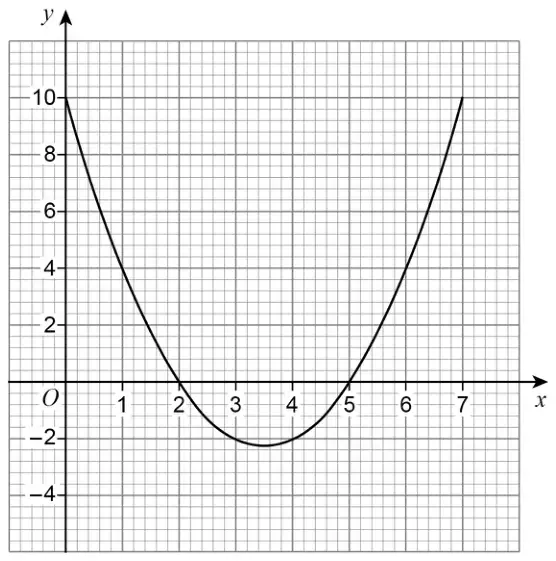
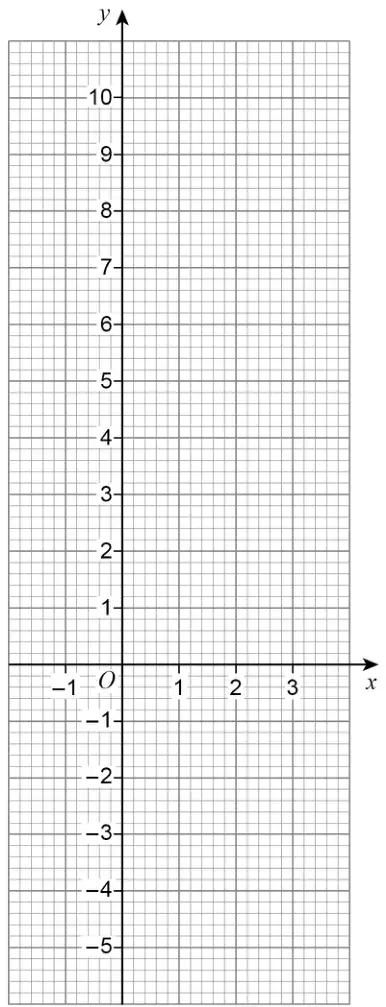
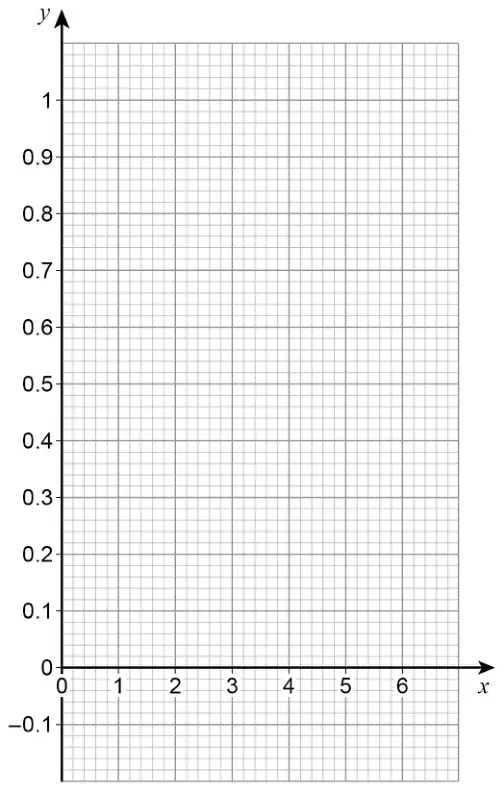
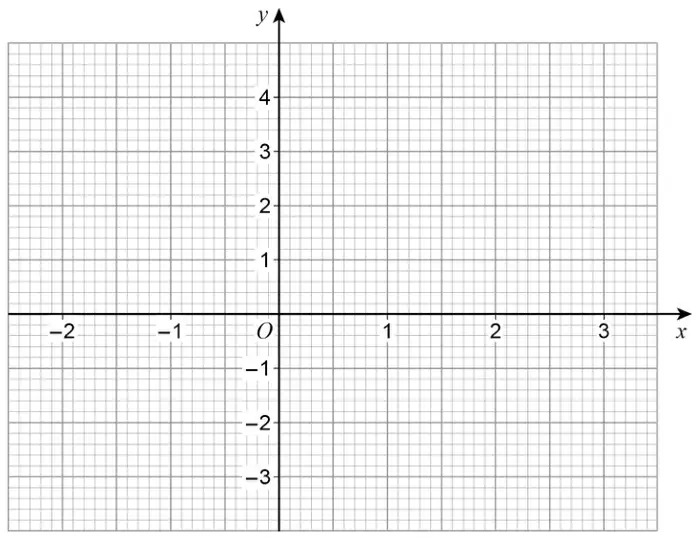
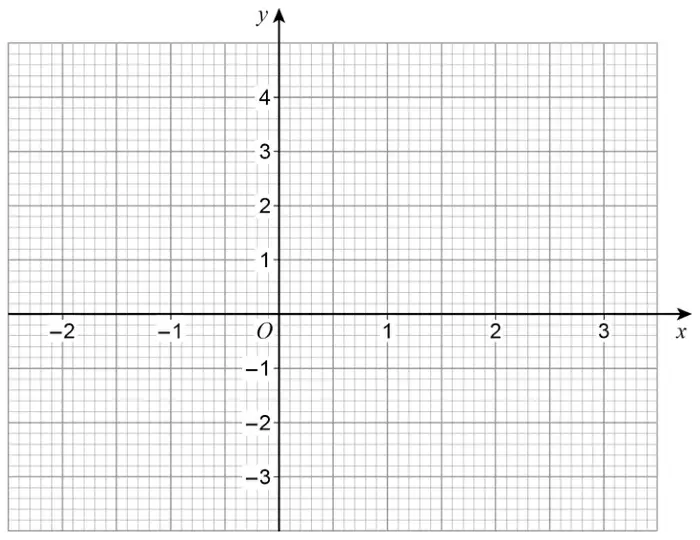
(a) Complete the table of values for \(y = x^2 + x - 4\)
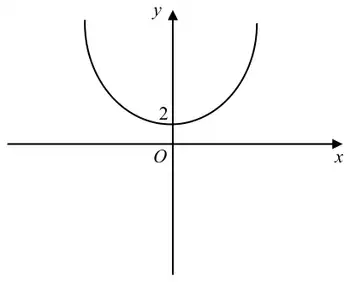
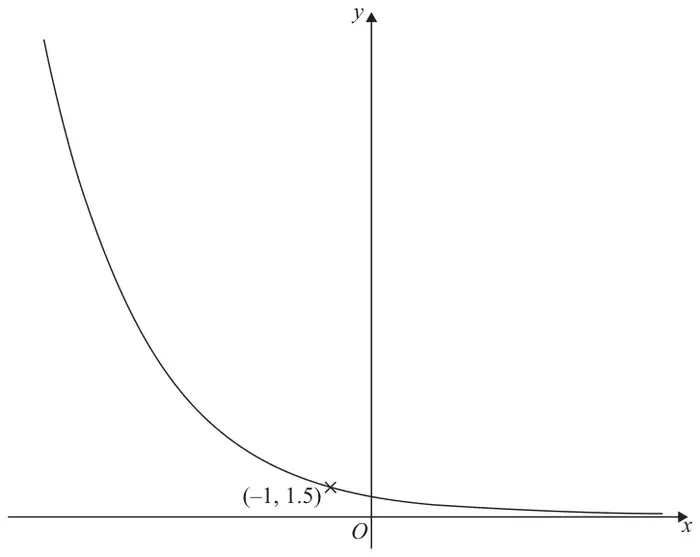
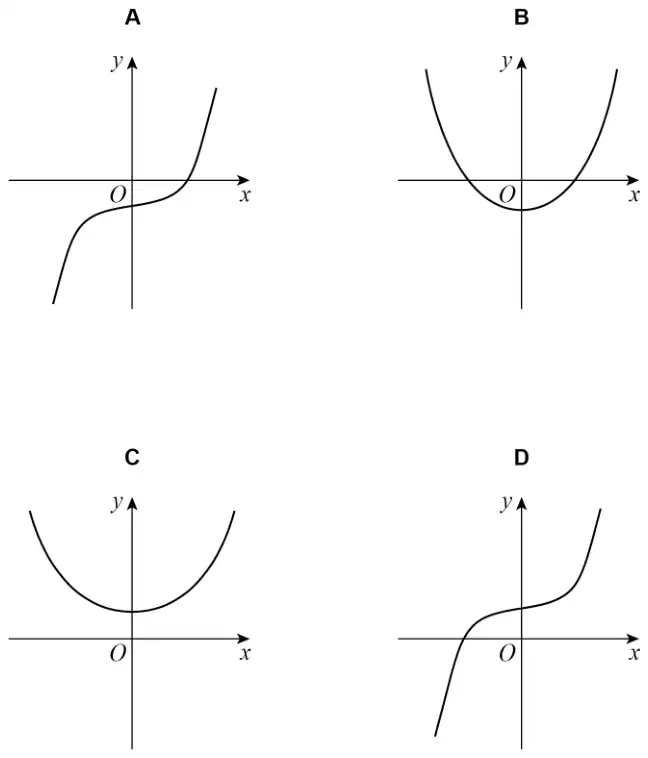
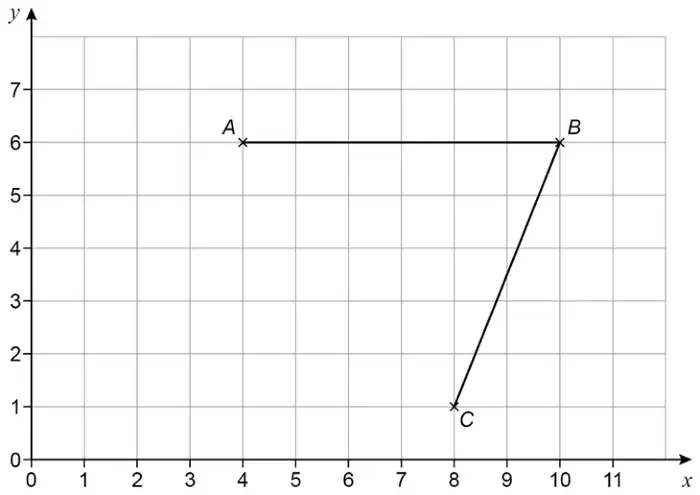
\(x\)
−3
−2
−1
0
1
2
\(y\)
2
−4
(2)
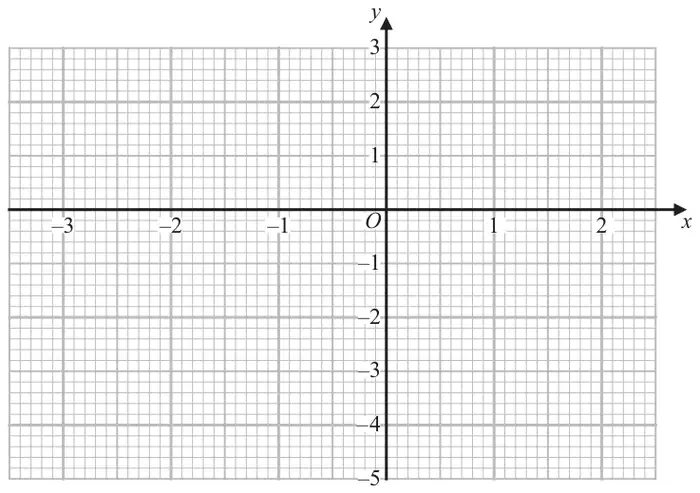
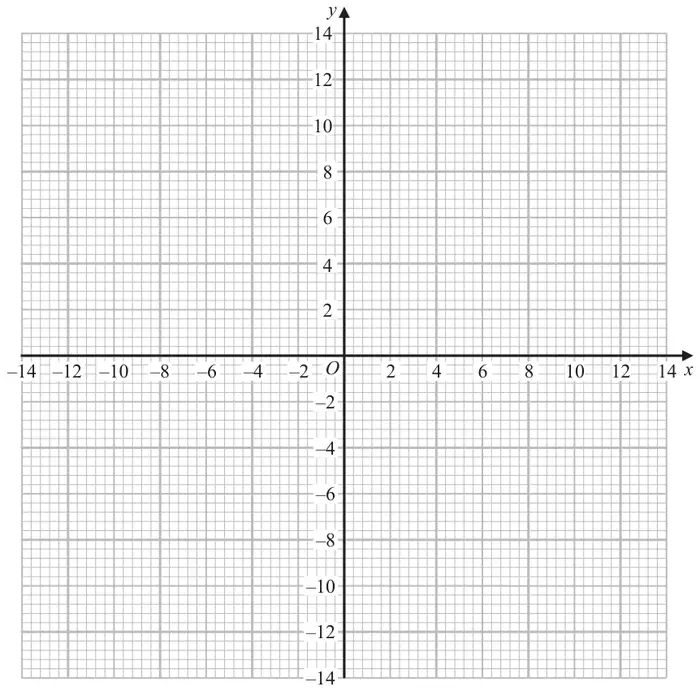
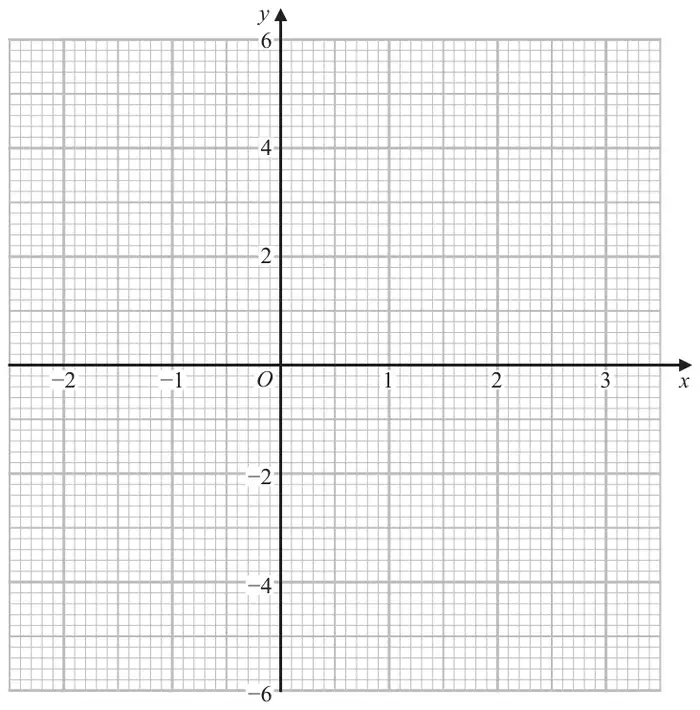
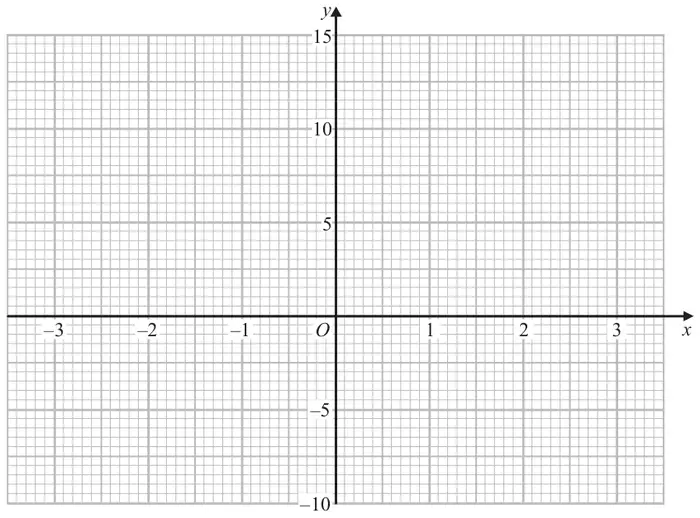
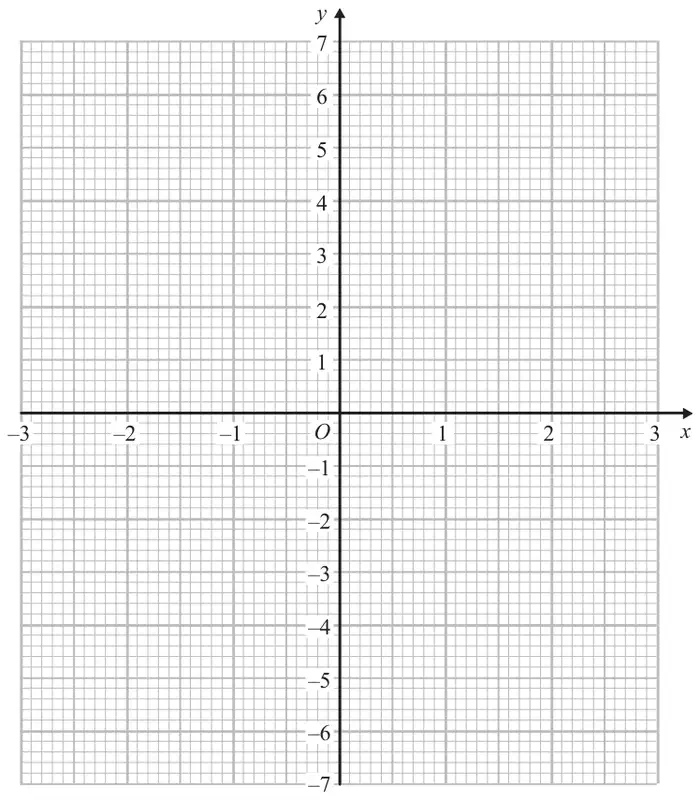
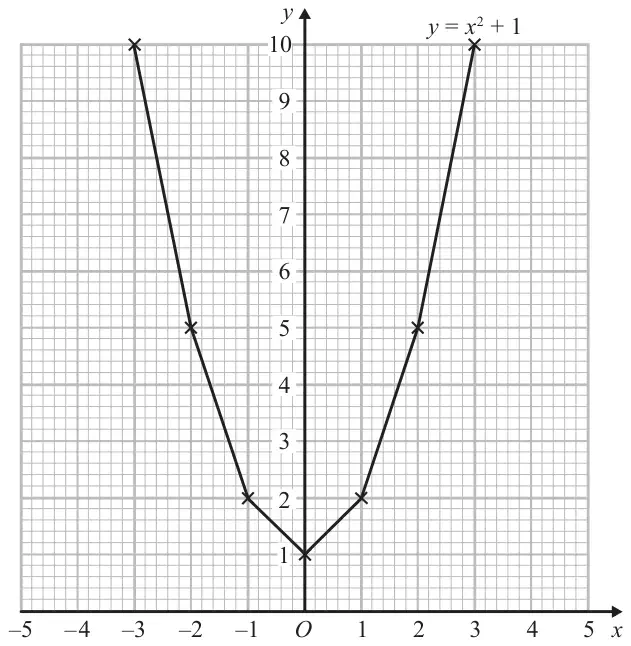
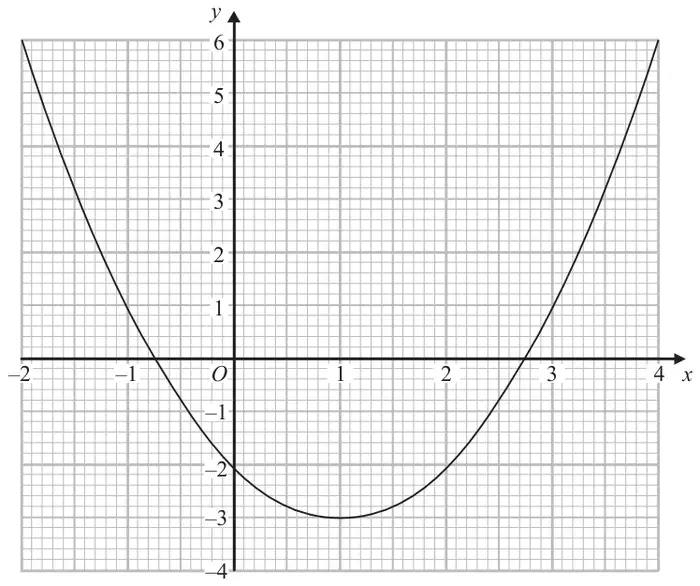
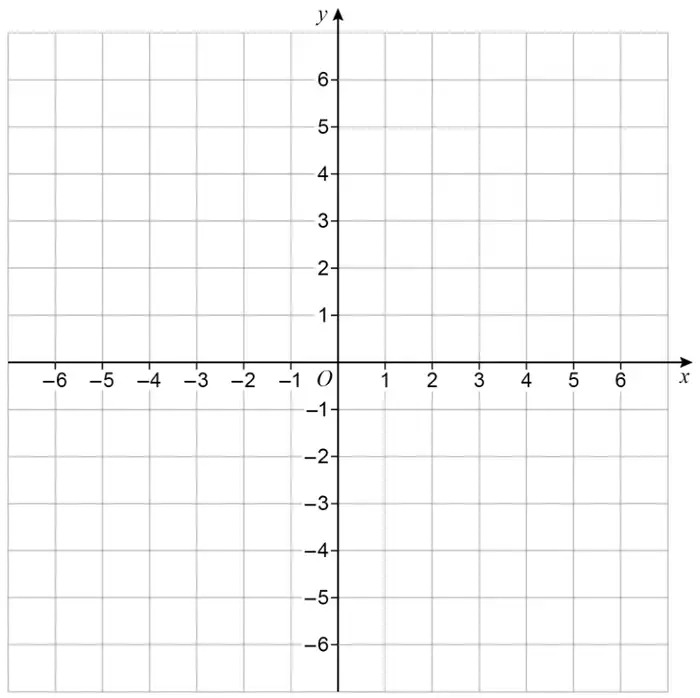
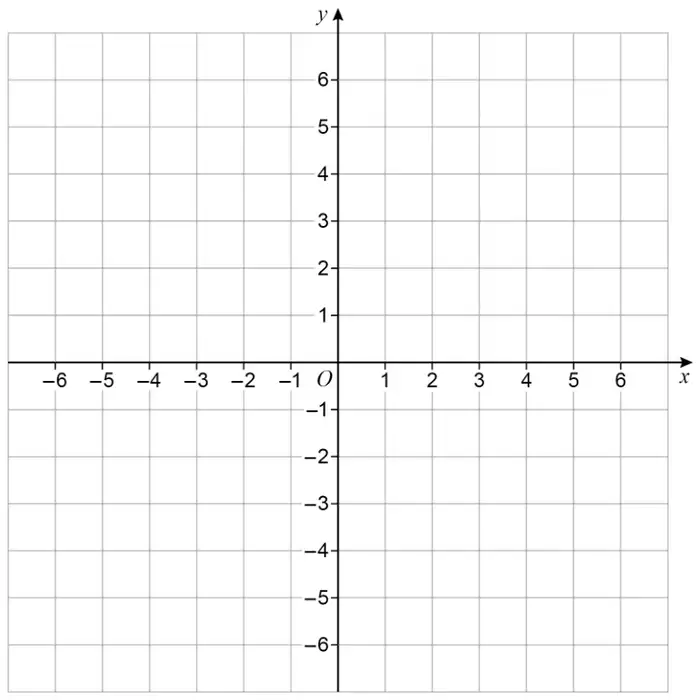
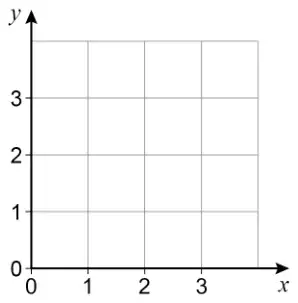
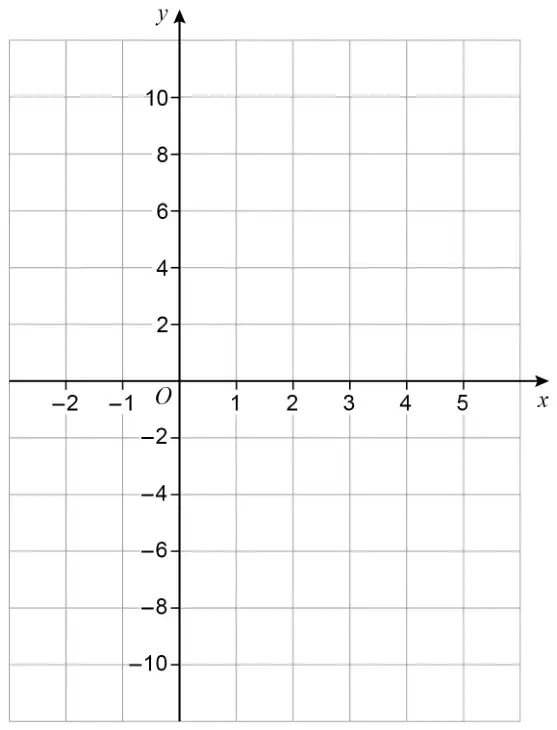
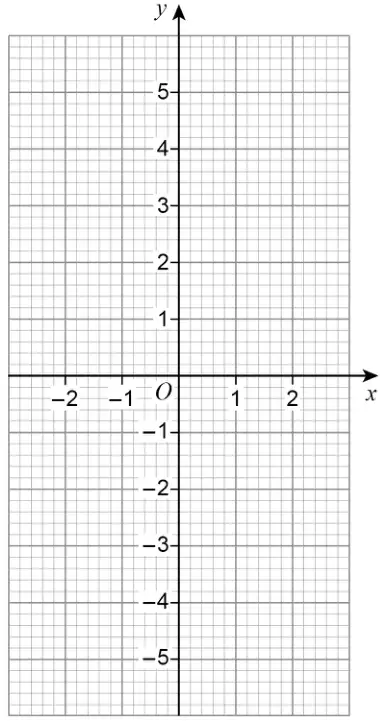
(b) On the grid, draw the graph of \(y = x^2 + x - 4\) for values of \(x\) from \(-3\) to 2(2)
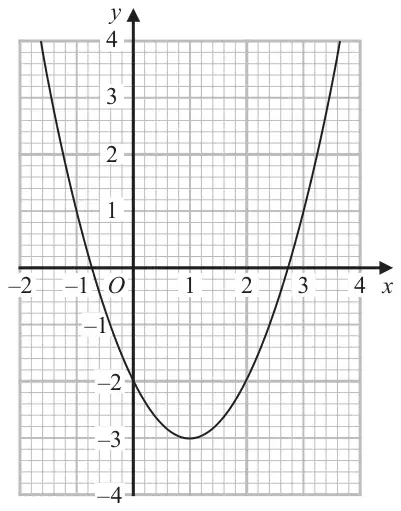
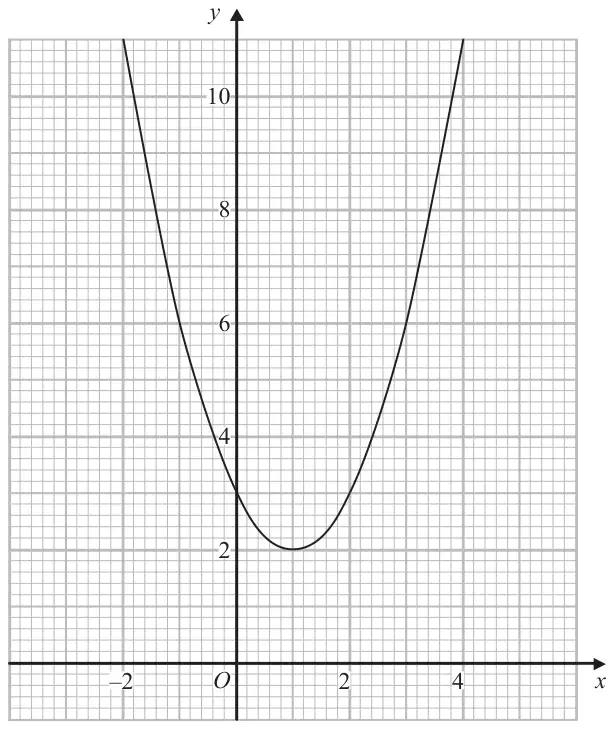
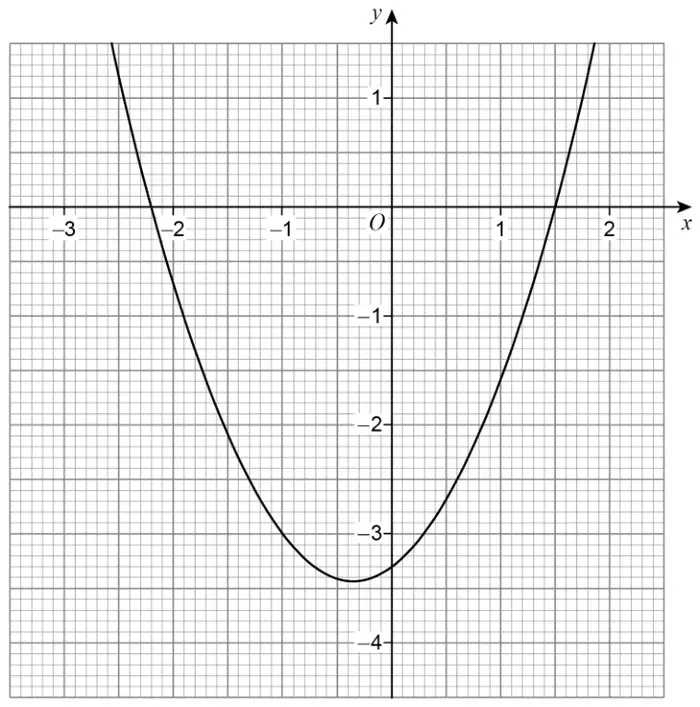
(c) Write down the coordinates of the turning point of the graph of \(y = x^2 + x - 4\) (1)
Mark scheme (a)
Answer
Mark
Mark scheme
\((2), -2, (-4), -4, -2, 2\)
B2
for all 4 values correct
(B1
for 2 or 3 correct values)
Mark scheme (b)
Answer
Mark
Mark scheme
Graph drawn
B2
for a fully correct graph
(B1
ft (dep on B1 in (a)) for plotting at least 5 of the points from their table correctly)
Additional guidance
Accept a freehand curve drawn that is not made of line segments Curve must not have a horizontal segment between \((-1, -4)\) and \((0, -4)\) Ignore anything drawn outside the required range
Mark scheme (c)
Answer
Mark
Mark scheme
\(-0.5, -4.25\)
B1
ft their graph with a single turning point or for \(x\) coordinate \(= -0.5\) and \(y\) coordinate \(= -4.25\) oe
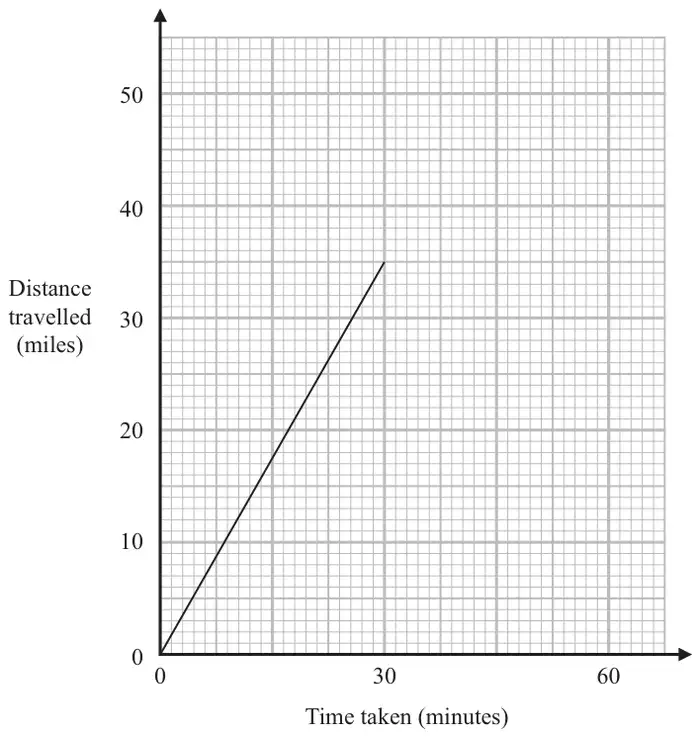
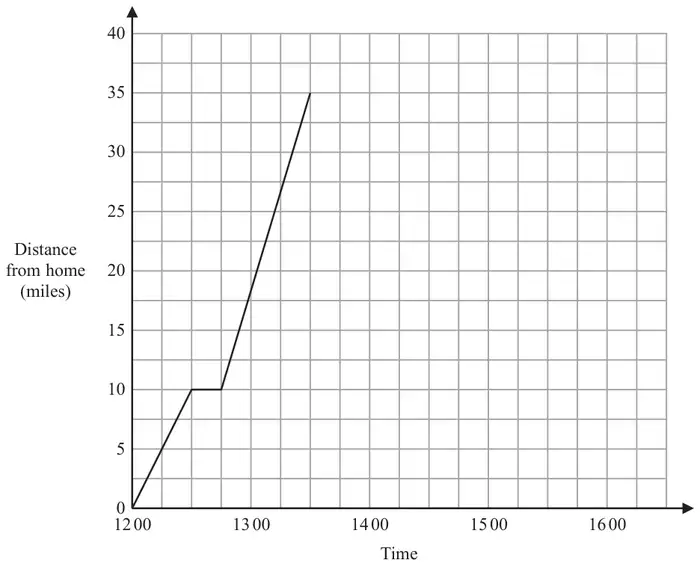
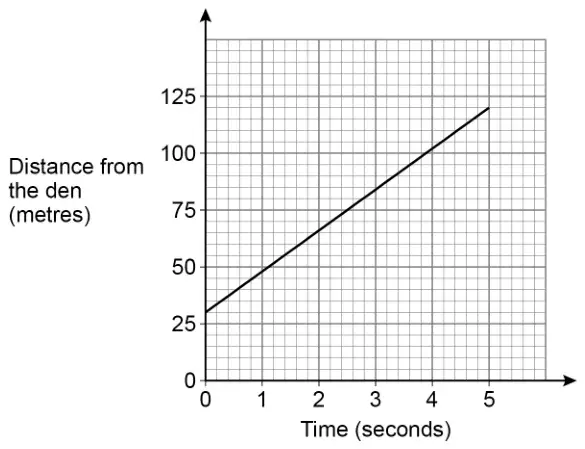
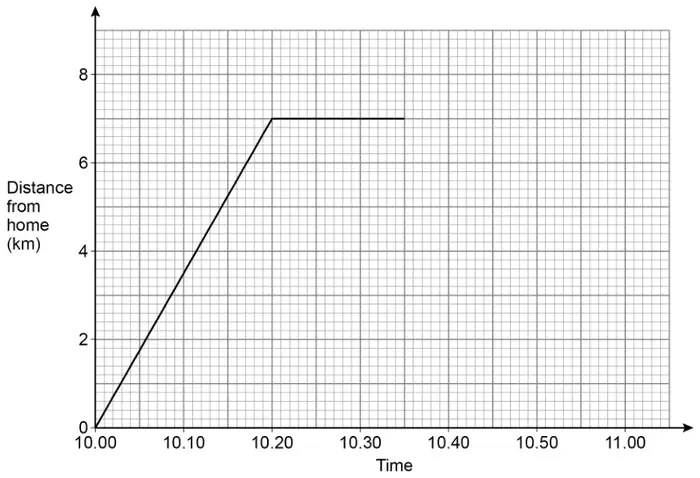
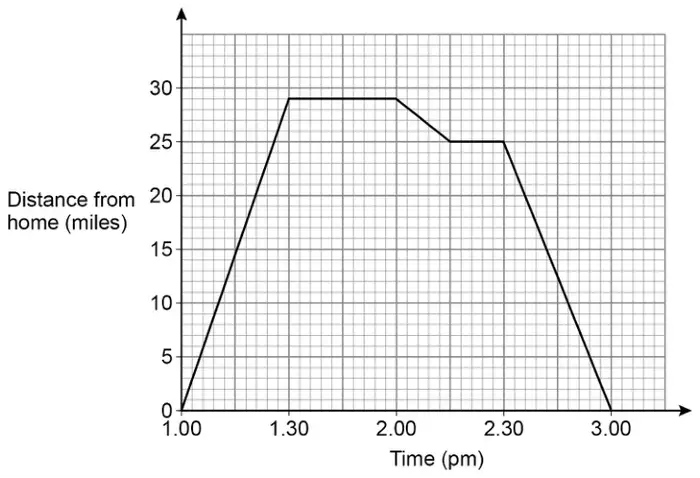
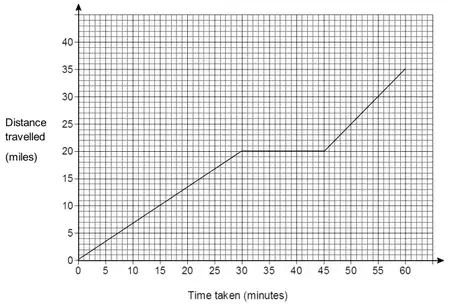
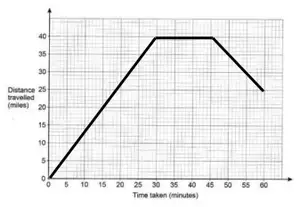
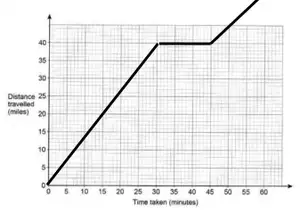
The travel graph shows information about the train’s journey.
(a) Work out the speed of the train. Give your answer in miles per hour. (2)
The train stays at Sheffield for 15 minutes.
(b) Show this information on the travel graph. (1)
Mark scheme (a)
Answer
Mark
Mark scheme
70
M1
for a method to work with distance \(\div\) time, eg \(35 \div (30 \div 60)\) or \(35 \div 30 \times 60\) or \(35 \times (60 \div 30)\) or \(35 \div 30\ (= 1.16\ldots)\) or [distance] \(\div\) [time]
A1
answer in the range 69.6 to 70.2
Additional guidance
May use other readings from graph for [distance] and [time] but must be accurate
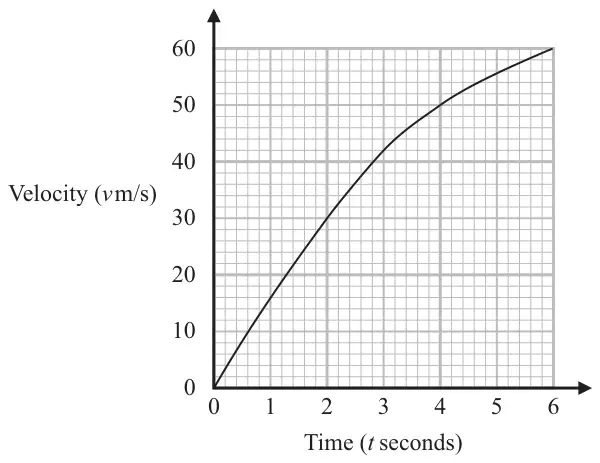
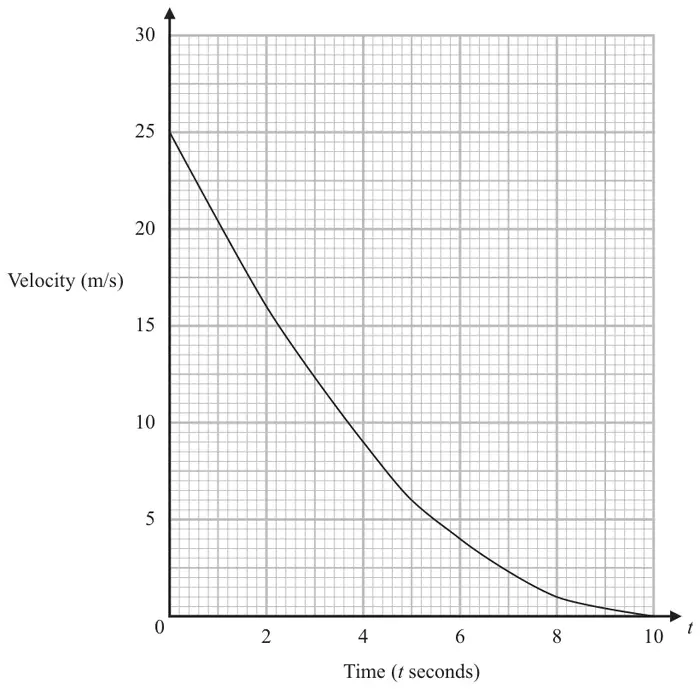
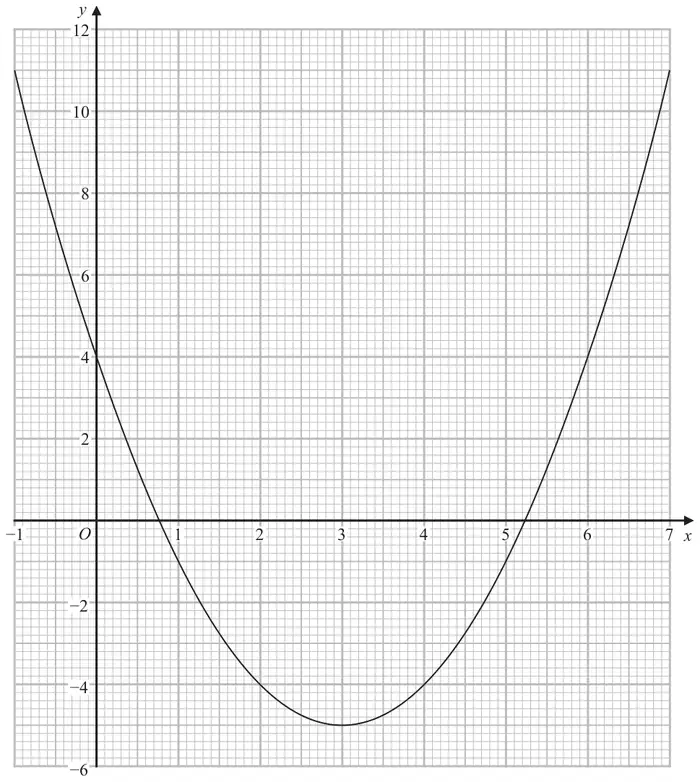
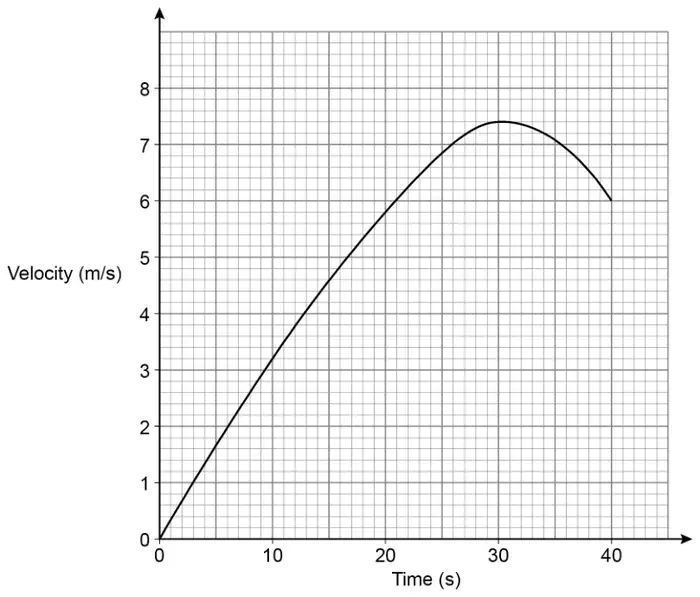
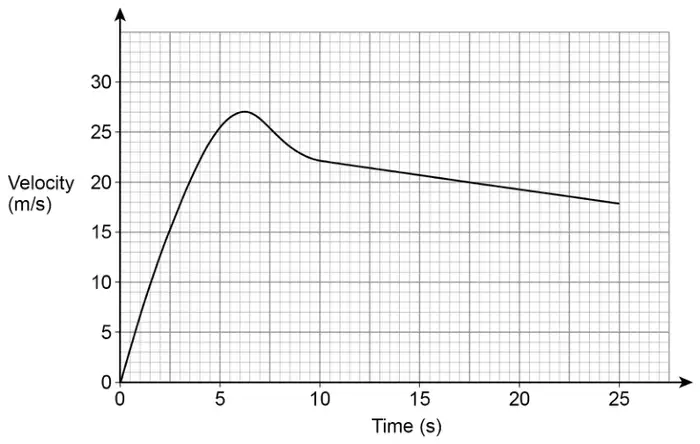
12 The graph shows the velocity, \(v\) m/s, of a particle \(t\) seconds after it starts to move.
(a)
(i) Work out an estimate of the gradient of the graph at \(t = 3\) You must show how you get your answer. (3)
(ii) What does this gradient represent? (1)
(b) Work out an estimate for the distance the particle travelled in the first 6 seconds. Use 3 strips of equal width. (3)
Mark scheme (a)
Answer
Mark
Mark scheme
(i) 10
M1
for a tangent drawn at \(t = 3\)
M1
for a complete method to find the gradient from tangent, eg \(\dfrac{30}{3}\)
A1
for answer in the range 8.5 to 11.5 or ft acceptable tangent at \(t = 3\)
(ii) Acceleration or rate of change of velocity
C1
for a correct explanation
Acceptable examples acceleration rate of change of velocity increase in velocity each second how quickly the velocity increases increase in velocity over time the rate at which the particle is accelerating
Not acceptable examples rate of change increase in velocity the velocity per second velocity ÷ time as time increases so does the velocity how steep the line is the acceleration of the particle and how far it got
Additional guidance
(i) A tangent must be seen to award any marks
This mark can be awarded if the tangent is drawn at \(t \neq 3\)
Accept answers in the form \(\dfrac{a}{b}\) where \(a\) and \(b\) are integers
Award 0 marks for a correct answer (in the range) with no (or incorrect) supportive working
(ii) Award if extra information is given provided not contradictory or incorrect
Accept ‘speed’ for ‘velocity’
Mark scheme (b)
Answer
Mark
Mark scheme
220
M1
for a method to find an appropriate area, eg \(\dfrac{1}{2} \times 30 \times 2\ (= 30)\) oe or \(\dfrac{1}{2}(30 + 50) \times (4 - 2)\ (= 80)\) oe or \(\dfrac{1}{2} \times (50 + 60) \times (6 - 4)\ (= 110)\) oe
or for a method to find an estimate for the area of at least one rectangle with height at intersection of midpoint and curve, eg \(2 \times 16\ (= 32)\) oe or \(2 \times 42\ (= 84)\) oe or \(2 \times 56\ (= 112)\) oe
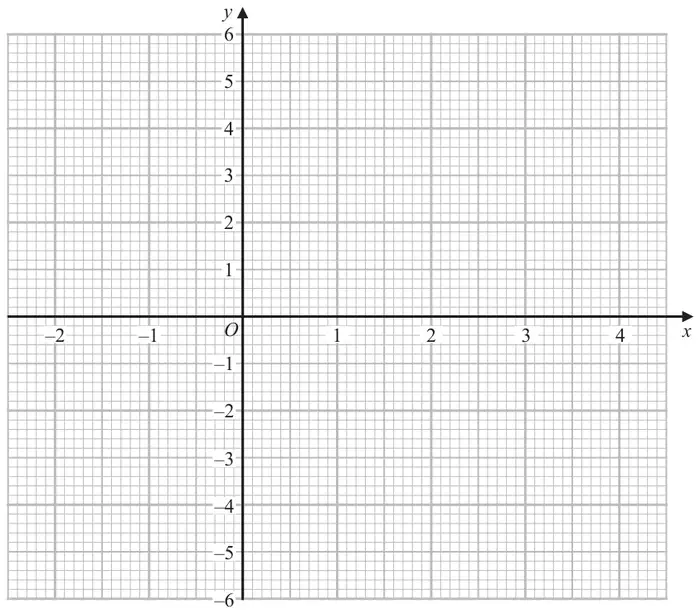
(a) Complete the table of values for \(y = x^2 + x - 4\)
\(x\)
−3
−2
−1
0
1
2
\(y\)
2
−4
(2)
(b) On the grid, draw the graph of \(y = x^2 + x - 4\) for values of \(x\) from \(-3\) to 2(2)
(c) Write down the coordinates of the turning point of the graph of \(y = x^2 + x - 4\) (1)
Mark scheme (a)
Answer
Mark
Mark scheme
\((2), -2, (-4), -4, -2, 2\)
B2
for all 4 values correct
(B1
for 2 or 3 correct values)
Mark scheme (b)
Answer
Mark
Mark scheme
Graph drawn
B2
for a fully correct graph
(B1
ft (dep on B1 in (a)) for plotting at least 5 of the points from their table correctly)
Additional guidance
Accept a freehand curve drawn that is not made of line segments Curve must not have a horizontal segment between \((-1, -4)\) and \((0, -4)\) Ignore anything drawn outside the required range
Mark scheme (c)
Answer
Mark
Mark scheme
\(-0.5, -4.25\)
B1
ft their graph with a single turning point or for \(x\) coordinate \(= -0.5\) and \(y\) coordinate \(= -4.25\) oe
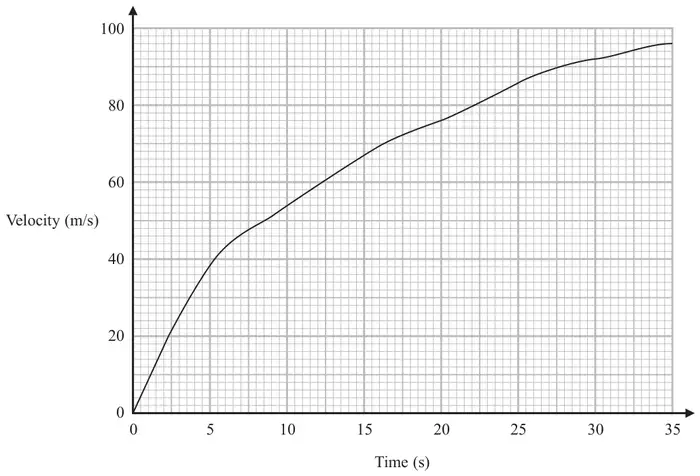
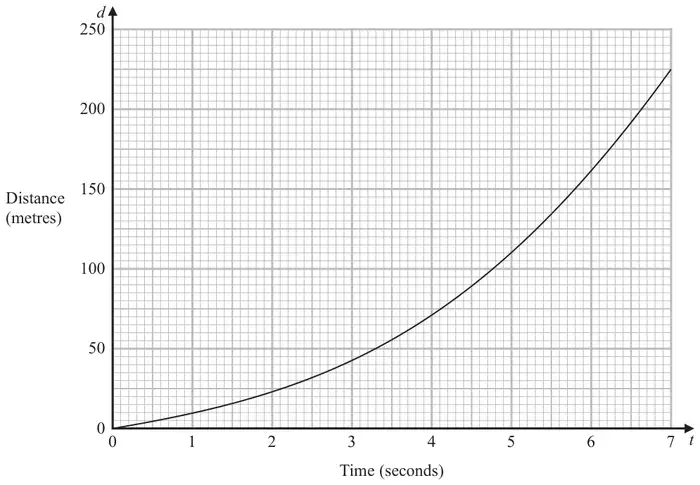
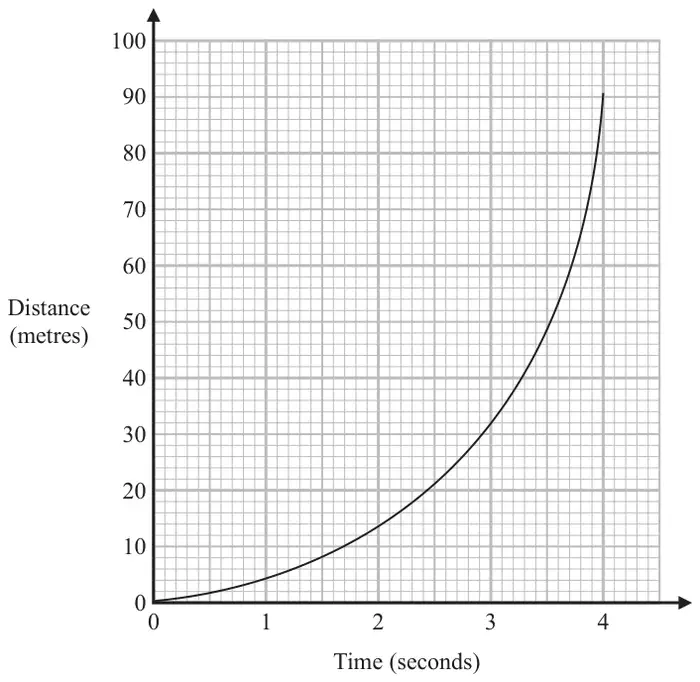
22 Here is a velocity-time graph for an aeroplane.
Work out an estimate for the distance the aeroplane travelled in the first 30 seconds. Use 3 strips of equal width. (3)
Mark scheme
Answer
Mark
Mark scheme
1760
M1
for starting to find the area under the curve, eg \(0.5 \times 10 \times \mathbf{54}\ (= 270)\) oe or \(0.5 \times 10 \times (\mathbf{54} + \mathbf{76})\ (= 650)\) oe or \(0.5 \times 10 \times (\mathbf{76} + \mathbf{92})\ (= 840)\)
or for a method to find an estimate for the area of at least 1 strip with heights at intersection of midpoint and curve eg \(10 \times [\mathbf{39}]\) oe or \(10 \times [\mathbf{67}]\) oe or \(10 \times [\mathbf{86}]\) oe
M1
for a complete method to find the area under the curve, eg \(0.5 \times 10 \times 54 + 0.5 \times 10 \times (54 + 76) + 0.5 \times 10 \times (76 + 92)\) oe eg \(0.5 \times 10\,(92 + 2(54 + 76))\) or \(10 \times [39] + 10 \times [67] + 10 \times [86]\) oe
A1
for 1760 or 1890 to 1950
SCB2 for an answer in the range 1815 – 1855
Additional guidance
Must have one correct expression for the award of this mark May be seen as a rectangle added to a triangle
Where \(38 \leqslant [39] \leqslant 40\) Where \(66 \leqslant [67] \leqslant 68\) Where \(85 \leqslant [86] \leqslant 87\)
Allow 1 error in \(y\) values used
Allow 1890 to 1950 only if it comes from midpoint method
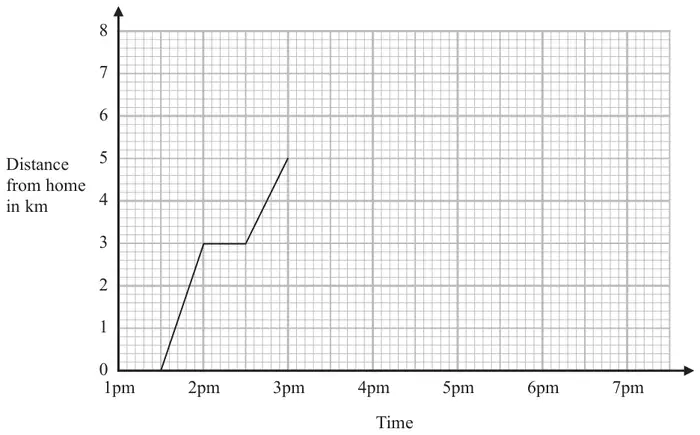
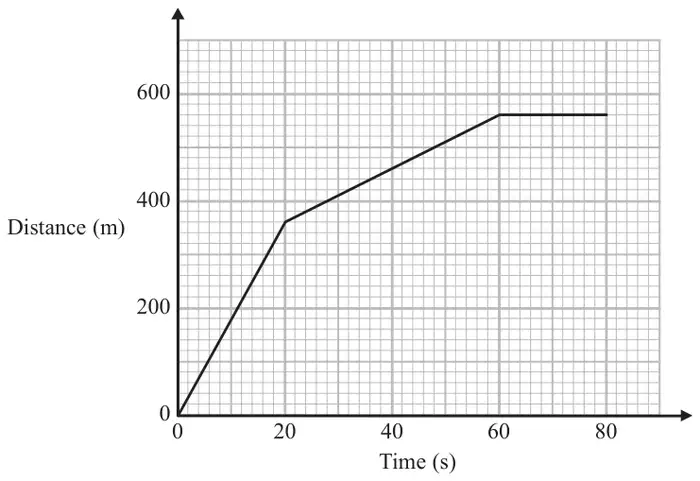
The travel graph of Amy’s walk to the skate park is shown below.
On the way to the skate park Amy stopped at her friend’s house.
(a) How far is it from her friend’s house to the skate park? (1)
Amy stayed at the skate park for 2 hours. Then she walked home at a steady speed. She took 1 hour 30 minutes to walk home.
(b) Complete the travel graph. (2)
Mark scheme (a)
Answer
Mark
Mark scheme
2
B1
cao
Mark scheme (b)
Answer
Mark
Mark scheme
Graph completed
M1
for straight line from (3, 5) to (5, 5) or for a straight line from (5, 5) to (6 30, 0) or line drawn from (3, 5) to (4 30, 0) or a line drawn from (\(x\), 5) to (\(x\) + 1 30, 0) where \(x \geqslant 3\)
A1
cao
Additional guidance
Accept hand drawn, ruler not required but intention clear
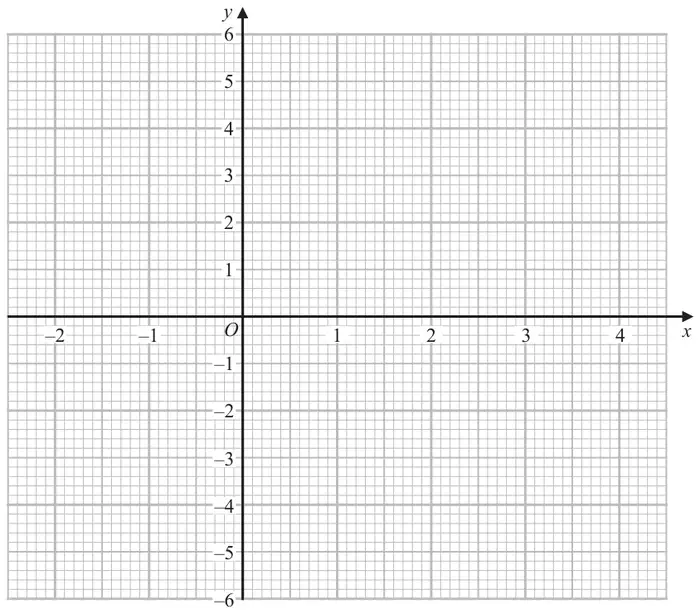
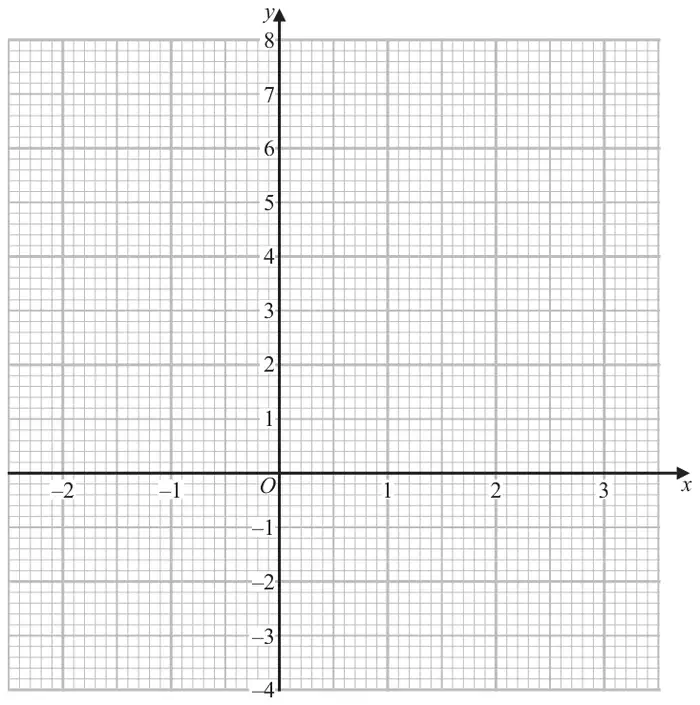
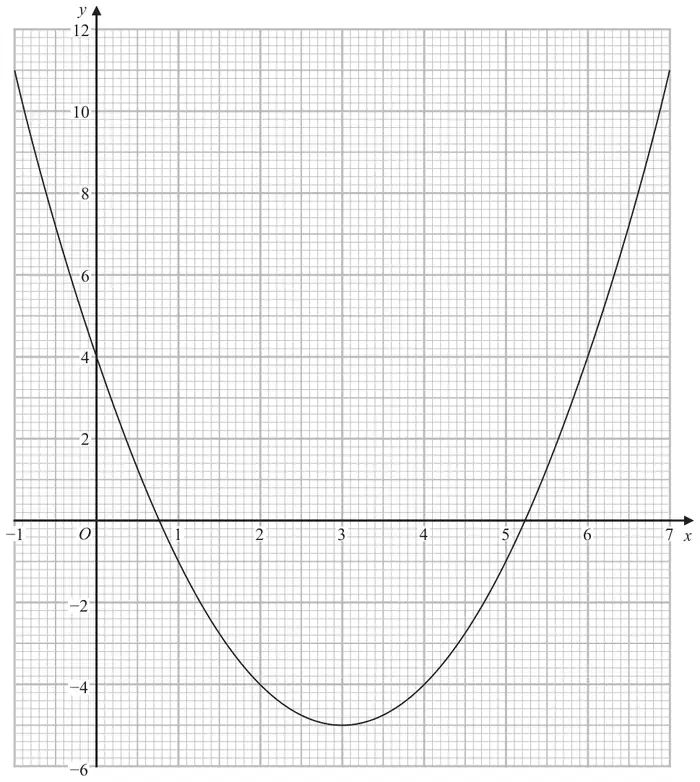
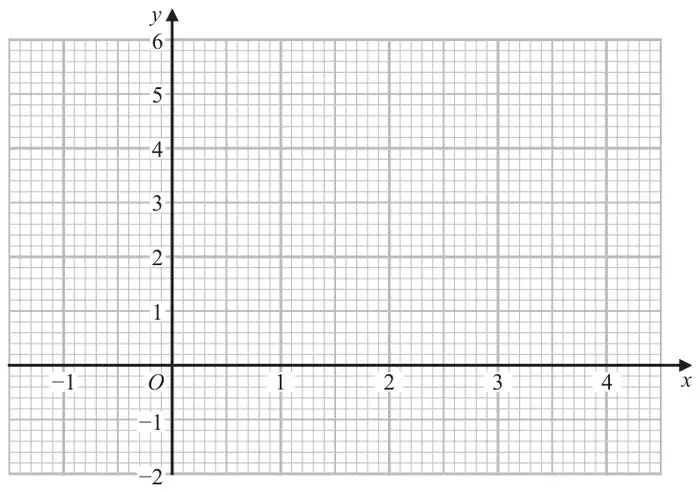
(a) Complete the table of values for \(\ y = x^2 - x\)
\(x\)
\(-2\)
\(-1\)
0
1
2
3
\(y\)
6
0
2
(2)
(b) On the grid, draw the graph of \(\ y = x^2 - x\ \) for values of \(x\) from \(-2\) to 3(2)
(c) Use your graph to find estimates for the solutions of the equation \(\ x^2 - x = 4\) (2)
Mark scheme (a)
Answer
Mark
Mark scheme
(6) 2 (0) 0 (2) 6
B2
for all 3 values correct
(B1
for 1 or 2 correct values)
Mark scheme (b)
Answer
Mark
Mark scheme
Graph drawn
B2
for a fully correct graph
(B1
ft (dep on B1 in (a)) for plotting at least 5 of the points from their table correctly)
Additional guidance
Accept a freehand curve drawn that is not made of line segments Ignore anything drawn outside the required range
Mark scheme (c)
Answer
Mark
Mark scheme
\(-1.7\) to \(-1.5\) and 2.5 to 2.7
M1
for drawing the line \(y = 4\) or reading off intersections where \(y = 4\) or one correct solution or both solutions given as coordinates, eg \((-1.6, 2.6)\) or \((-1.6, 4)\) and \((2.6, 4)\)
A1
for answers in the range \(-1.7\) to \(-1.5\) and 2.5 to 2.7 or ft their graph with at least 2 solutions
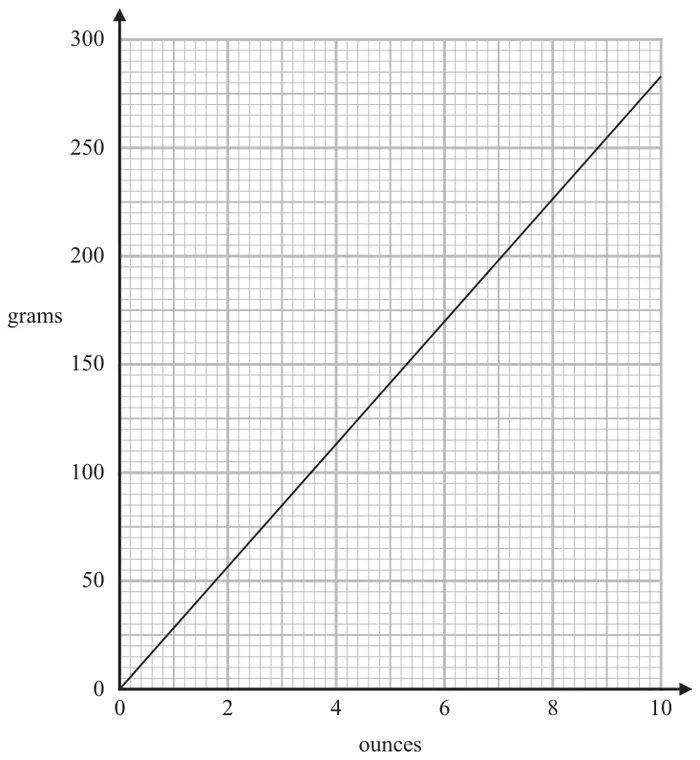
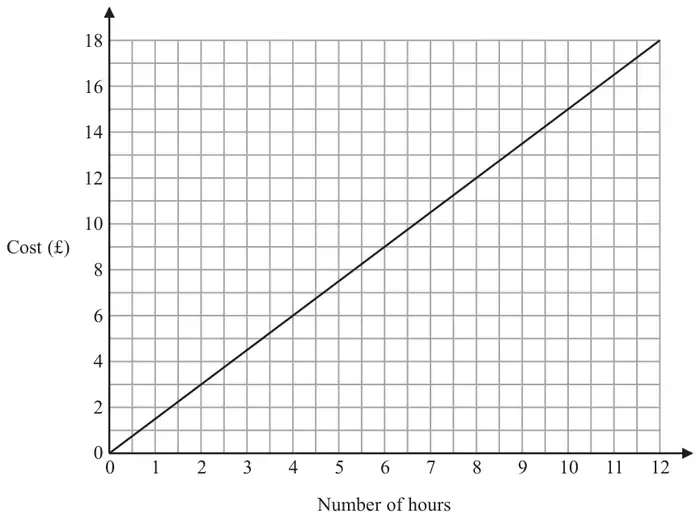
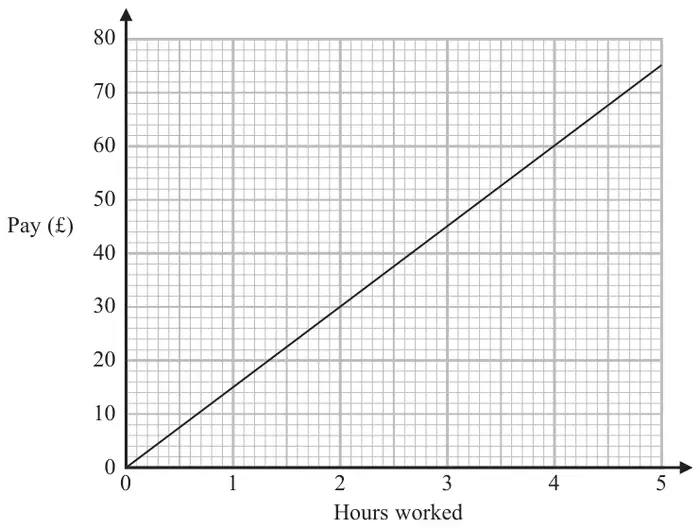
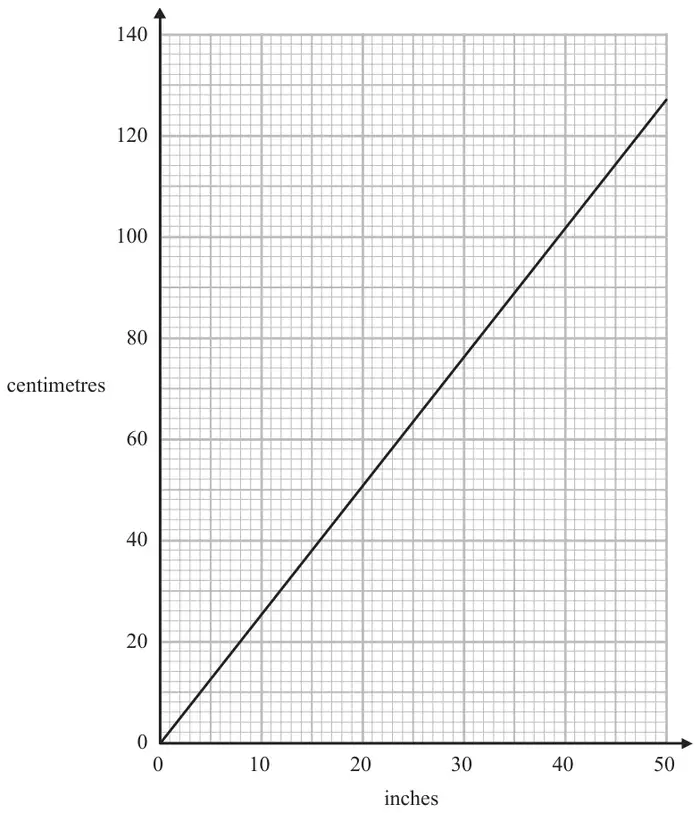
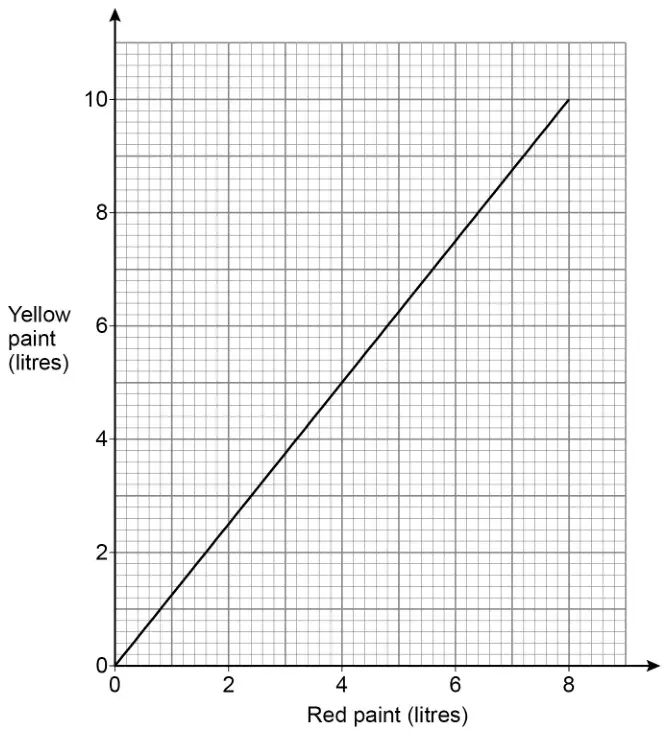
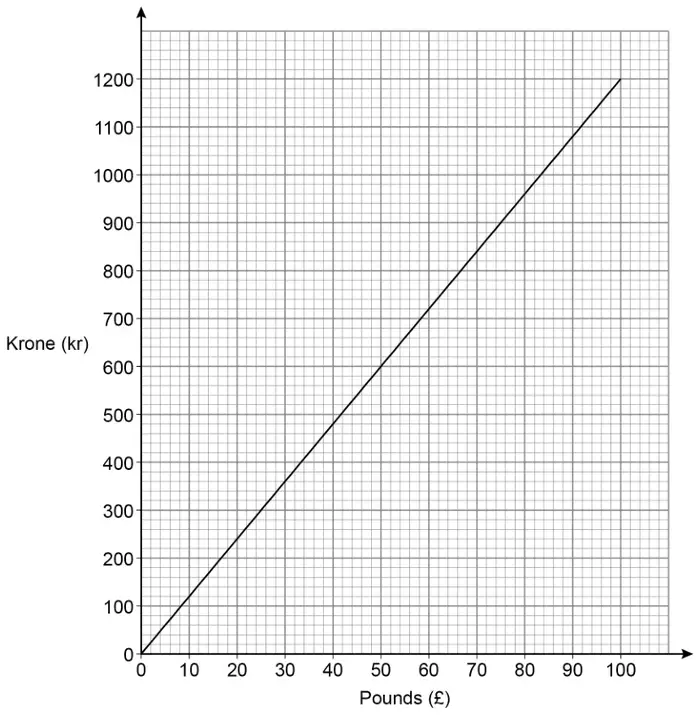
16 You can use this graph to change between ounces and grams.
(a) Change 6 ounces to grams. (1)
(b) Change 1 kg to ounces. (2)
Mark scheme (a)
Answer
Mark
Mark scheme
170
B1
for answer in the range 167 to 173
Mark scheme (b)
Answer
Mark
Mark scheme
35
M1
for correctly using readings from the graph as a factor of 1000 from the grams scale, eg \(200 \times 5\) or \(100 \times 10\) or \(20 \times 50\) or \(250 \times 4\)
or for method to use multiples of grams and corresponding ounces readings, eg \(1000 \div\) “answer to (a)” \(\times\, 6\) or \(1000 \div\) grams \(\times\) ounces oe
A1
for an answer in the range 34 to 36
Additional guidance
May be seen as a build-up method using multiple readings that can be read from the graph but must total 1000 grams
14 The graph shows the velocity of a car, in metres per second, \(t\) seconds after it starts to slow down.
(a) Calculate an estimate for the acceleration of the car when \(t = 5\) You must show all your working. (3)
(b) Work out an estimate for the distance the car travels in the first 6 seconds after it starts to slow down. Use 3 strips of equal width. (3)
Mark scheme (a)
Answer
Mark
Mark scheme
\(-2.5\)
M1
for drawing a tangent at \(t = 5\)
M1
(dep on M1) for a complete method to find the gradient eg tangent at \(t = 5\) and \(\text{``}10\text{''} \div \text{``}4\text{''}\) or an answer in the range 2.0 to 2.8
A1
for answer in the range \(-2.0\) to \(-2.8\) dependent on tangent drawn
Additional guidance
No tangent drawn score 0 marks Working may be seen on the diagram
Accept answers in the form \(\dfrac{a}{b}\) where \(a\) and \(b\) are integers
Mark scheme (b)
Answer
Mark
Mark scheme
79
M1
for a method to find an estimate for the area of at least 1 trapezium under the curve, eg \(\dfrac{1}{2} \times 2 \times (25 + 16)\ (= 41)\) oe or \(\dfrac{1}{2} \times 2 \times (16 + 9)\ (= 25)\) oe or \(\dfrac{1}{2} \times 2 \times (9 + 4)\ (= 13)\) oe or for a method to find an estimate for the area of at least 1 rectangle with heights at intersection of midpoint and curve, eg \(2 \times 20.5\ (= 41)\) oe or \(2 \times 12.5\ (= 25)\) oe or \(2 \times 6\ (= 12)\) oe
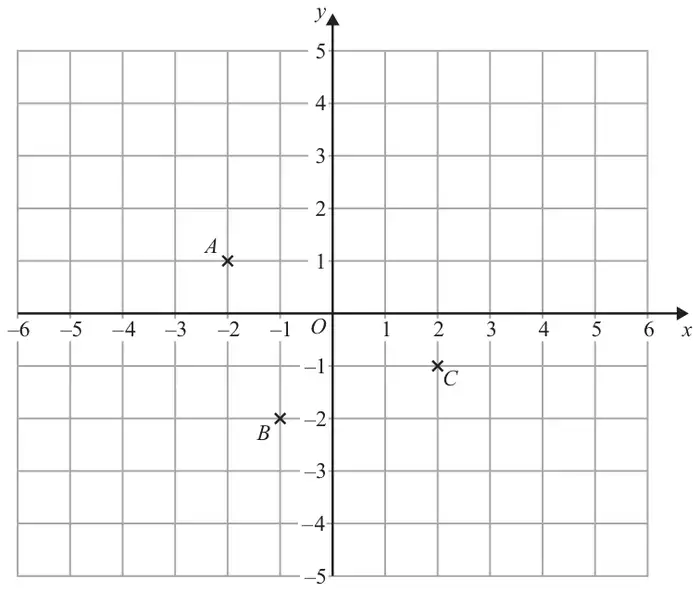
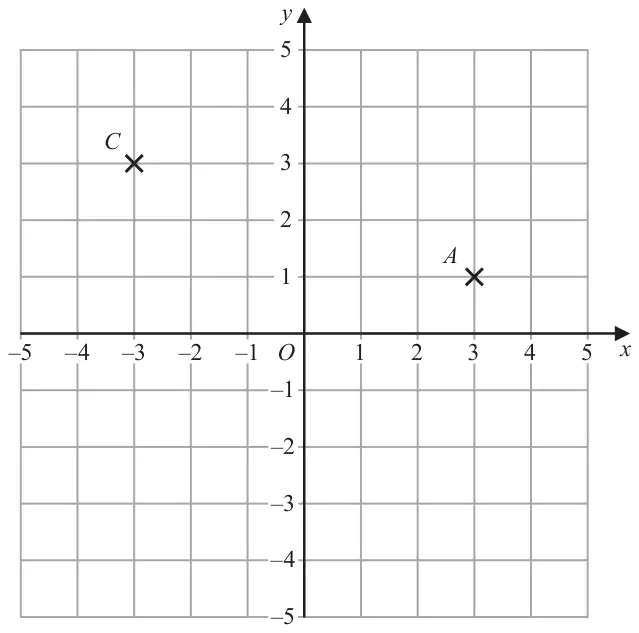
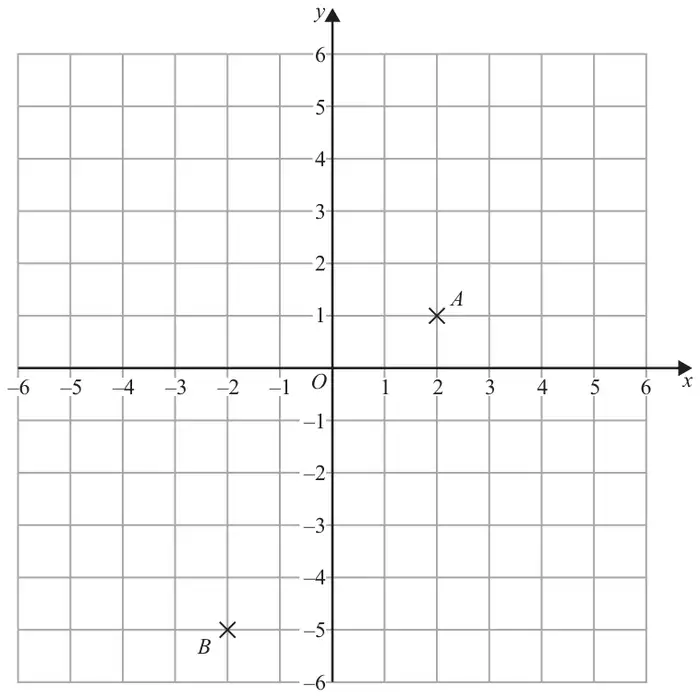
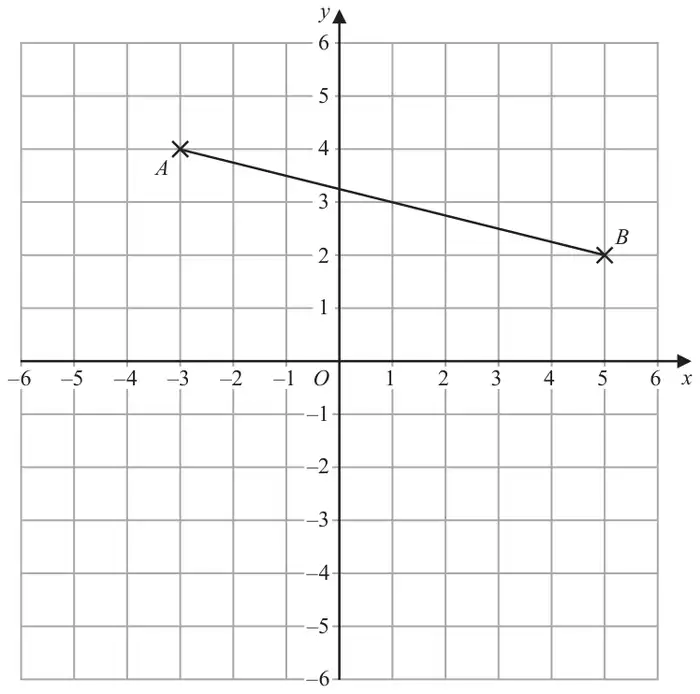
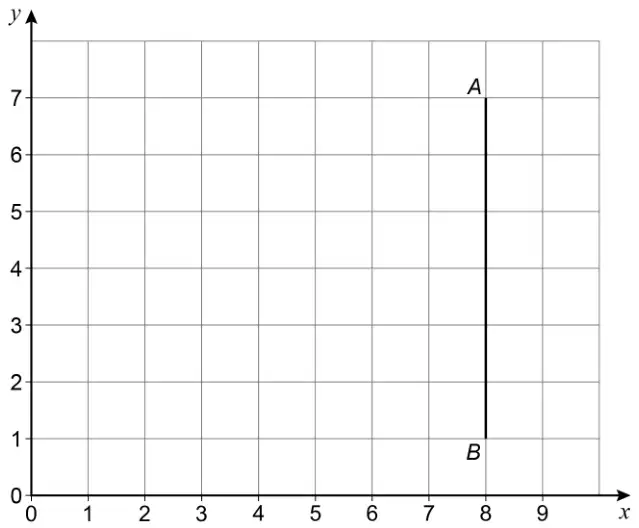
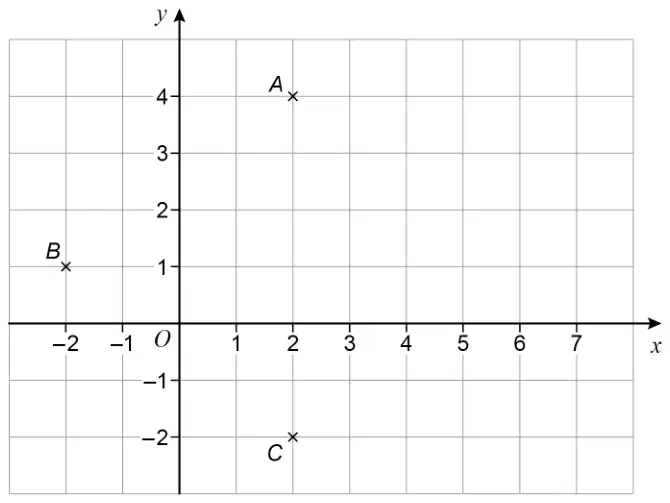
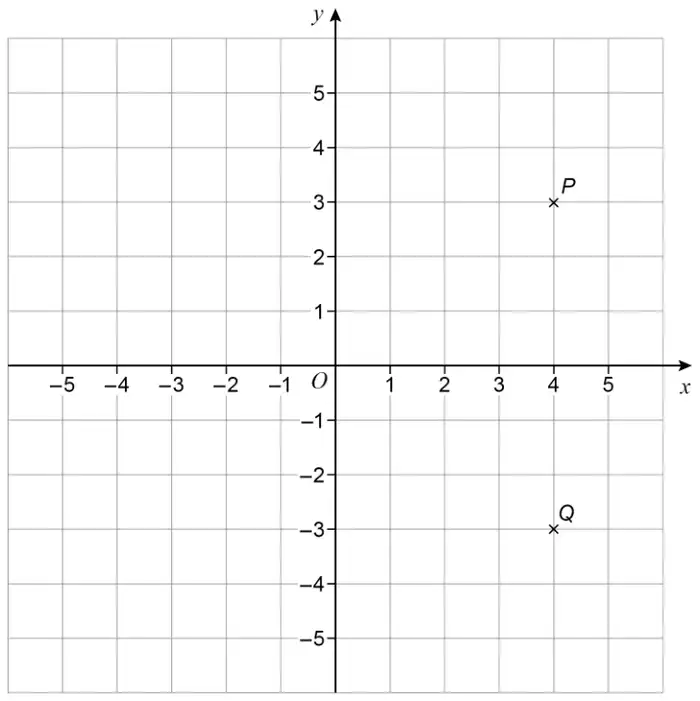
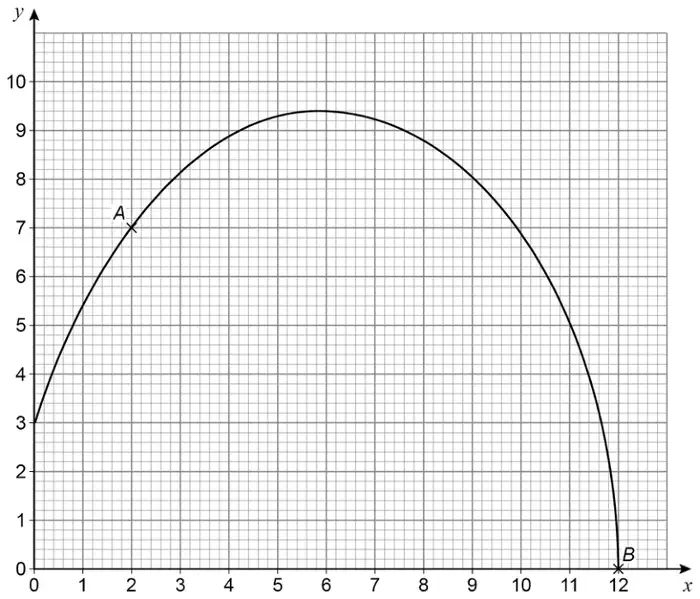
8 The points \(A\) and \(B\) are shown on the grid.
(a) Write down the coordinates of the point \(A\). (1)
(b) Find the coordinates of the midpoint of \(AB\). (2)
(c) On the grid, mark with a cross (\(\times\)) the point with coordinates \((-4, 2)\) Label this point \(C\). (1)
Mark scheme (a)
Answer
Mark
Mark scheme
2, 1
B1
cao
Mark scheme (b)
Answer
Mark
Mark scheme
\(0, -2\)
M1
for an answer of \((0, y)\) where \(y \ne -2\) or \((x, -2)\) where \(x \ne 0\) or the correct midpoint identified on the grid or \((2 + -2) \div 2\) or \((1 + -5) \div 2\)
(a) Complete the table of values for \(y = x^2 - x\)
\(x\)
\(-2\)
\(-1\)
0
1
2
3
\(y\)
6
0
2
(2)
(b) On the grid, draw the graph of \(y = x^2 - x\) for values of \(x\) from \(-2\) to 3(2)
(c) Use your graph to find estimates for the solutions of the equation \(x^2 - x = 4\) (2)
Mark scheme (a)
Answer
Mark
Mark scheme
(6) 2 (0) 0 (2) 6
B2
for all 3 values correct
(B1
for 1 or 2 correct values)
Mark scheme (b)
Answer
Mark
Mark scheme
Graph drawn
B2
for a fully correct graph
(B1
ft (dep on B1 in (a)) for plotting at least 5 of the points from their table correctly)
Additional guidance
Accept a freehand curve drawn that is not made of line segments Ignore anything drawn outside the required range
Mark scheme (c)
Answer
Mark
Mark scheme
\(-1.7\) to \(-1.5\) and 2.5 to 2.7
M1
for drawing the line \(y = 4\) or reading off intersections where \(y = 4\) or one correct solution or both solutions given as coordinates, eg \((-1.6, 2.6)\) or \((-1.6, 4)\) and \((2.6, 4)\)
A1
for answers in the range \(-1.7\) to \(-1.5\) and 2.5 to 2.7 or ft their graph with at least 2 solutions
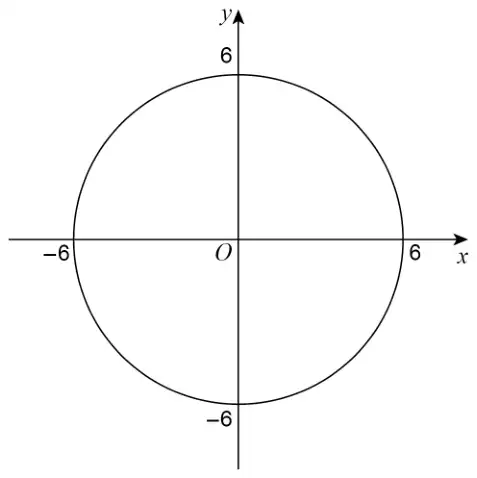
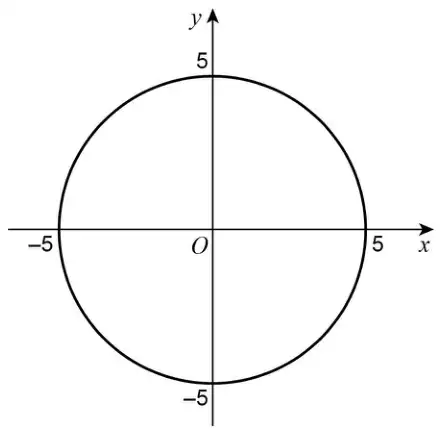
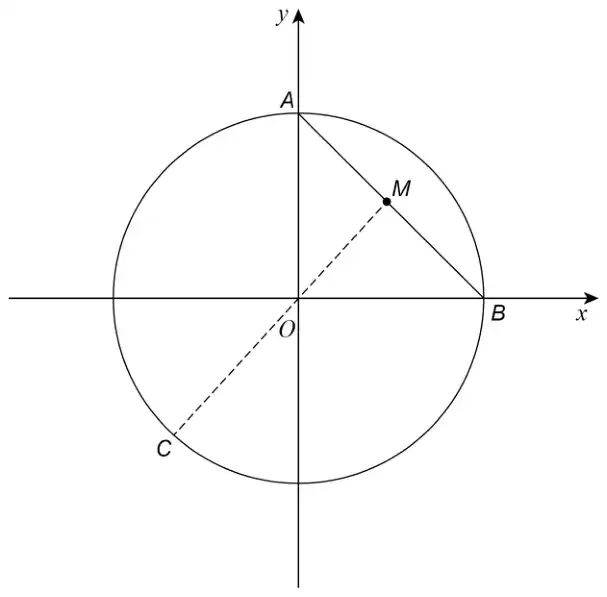
(a) On the grid, draw the graph of \(x^2 + y^2 = 169\)(2)
(b) Use your graph to find estimates for the solutions of the simultaneous equations\[\begin{gathered} x^2 + y^2 = 169 \\ 2y = 3x \end{gathered}\] (3)
Mark scheme (a)
Answer
Mark
Mark scheme
Circle drawn
B2
for drawing a circle centre \((0,0)\) and radius 13
(B1
for drawing a circle centre \((0,0)\) with radius \(\neq 13\) or a circle of radius 13 with a centre not \((0,0)\) or an incomplete correct circle drawn)
Additional guidance
Circle could be drawn freehand as long as it closely approximates to a circle
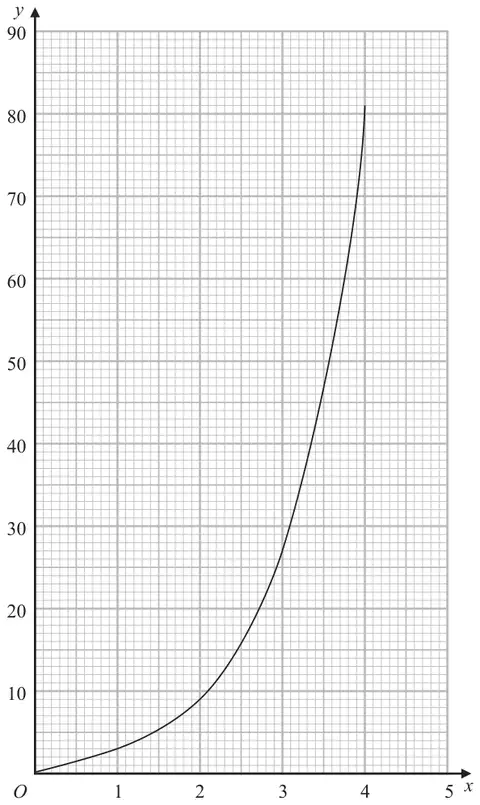
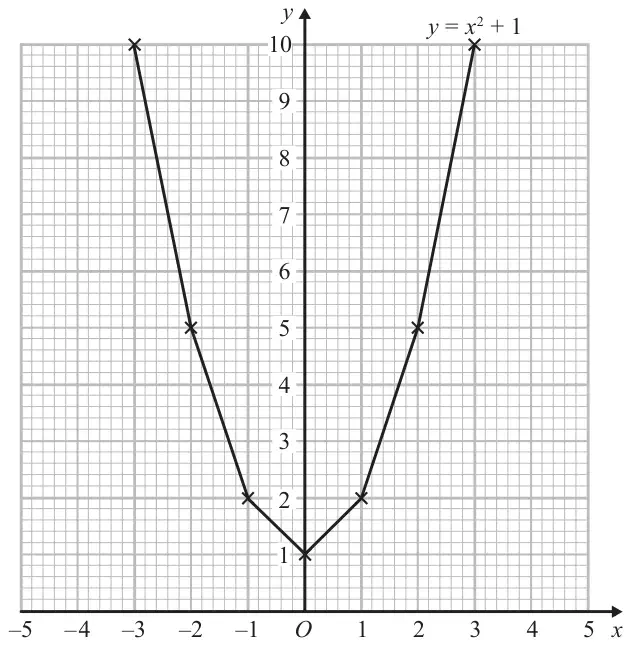
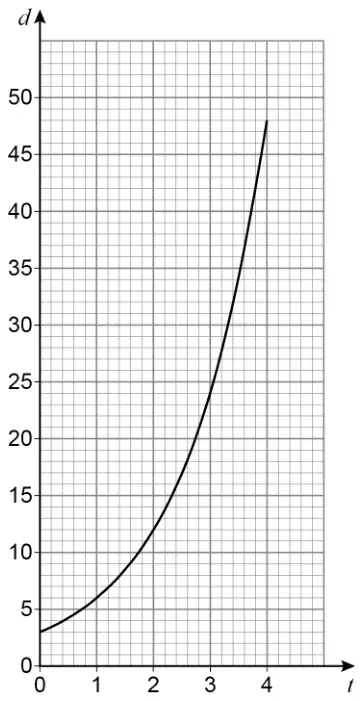
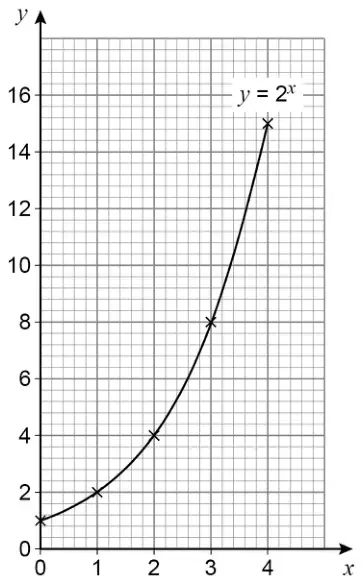
19 Sana needs to draw the graph of \(y = 3^x\) for \(0 \leqslant x \leqslant 4\)
She draws the graph shown on the grid.
Write down one thing Sana has done wrong. (1)
Mark scheme
Answer
Mark
Mark scheme
Statement
C1
for explanation Acceptable examples should go through (0, 1) should not go through (0, 0) it has touched the \(x\)-axis \(3^0 = 1\) \(3^0 \neq 0\) Not acceptable examples the graph has been drawn wrong axes are not labelled
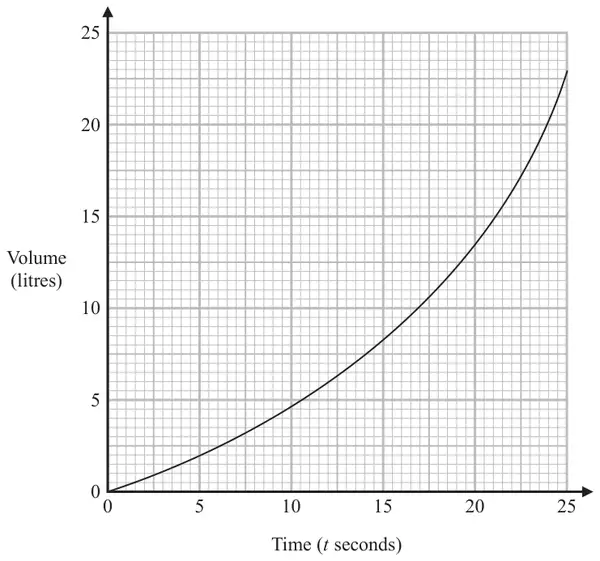
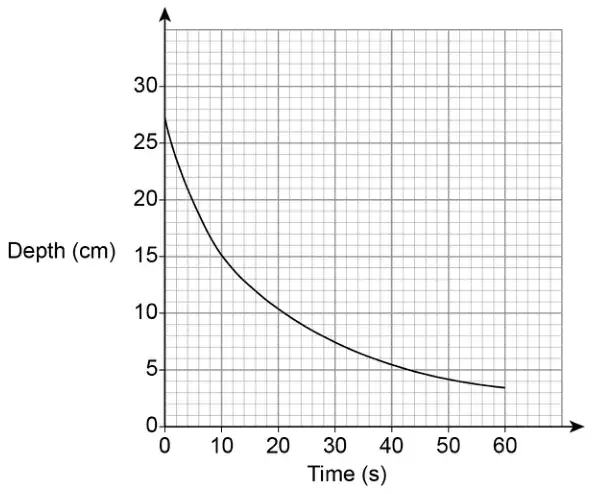
21 The graph below gives the volume, in litres, of water in a container \(t\) seconds after the water starts to fill the container.
(a) Calculate an estimate for the gradient of the graph when \(t = 17.5\) You must show how you get your answer. (3)
(b) Describe fully what the gradient in part (a) represents. (1)
Mark scheme (a)
Answer
Mark
Mark scheme
1.06
M1
for tangent drawn at \(t = 17.5\)
M1
for a complete method to find the gradient eg tangent drawn at \(t = 17.5\), and \(18.5 \div 17.5\)
A1
answer in the range 0.9 to 1.2
Additional guidance
No tangent drawn at \(t=17.5\) scores zero marks
Use of change in \(y\) over change in \(x\). Working may be seen on the diagram Answer of \(\dfrac{10.5}{17.5}\) oe scores no marks. Accept answers in the form \(\dfrac{a}{b}\) where \(a\) and \(b\) are integers
Mark scheme (b)
Answer
Mark
Mark scheme
Explanation
C1
suitable explanation, eg the rate of change of volume
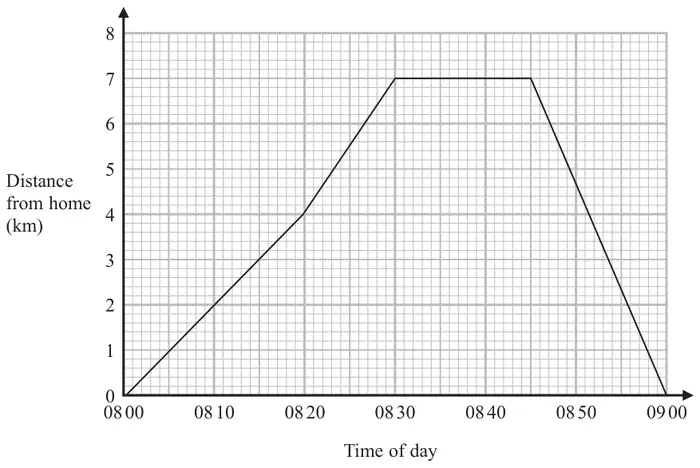
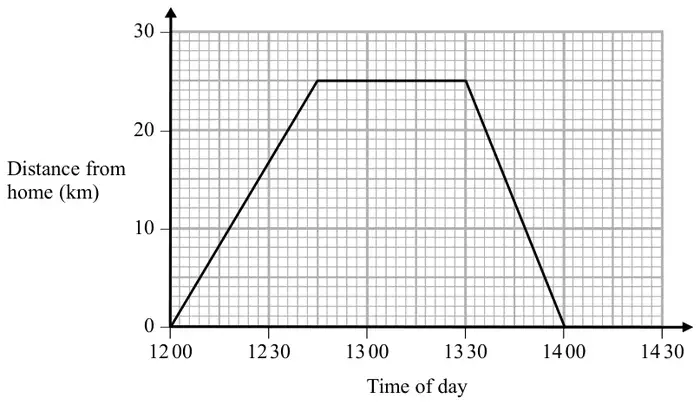
19 Carly cycles to her friend’s house. She stays at her friend’s house for a number of minutes. Then she cycles home.
Here is the travel graph for her journey.
(a) For how many minutes did Carly stay at her friend’s house? (1)
(b) How far is Carly from her home at 08 50? (1)
(c) Work out Carly’s speed, in km/h, for the first 20 minutes of her journey. (2)
Mark scheme (a)
Answer
Mark
Mark scheme
15
B1
cao
Mark scheme (b)
Answer
Mark
Mark scheme
4.6
B1
for an answer in the range 4.4 to 4.8
Mark scheme (c)
Answer
Mark
Mark scheme
12
M1
for a method to calculate speed eg distance ÷ time (could be implied from figures used) eg \(4 \div 20\ (= 0.2)\) oe, \(4 \div 0.33(...)\) oe or \(4 \div \tfrac{1}{3}\) oe
A1
cao
Additional guidance
Accept readings from the graph as an indication at this stage
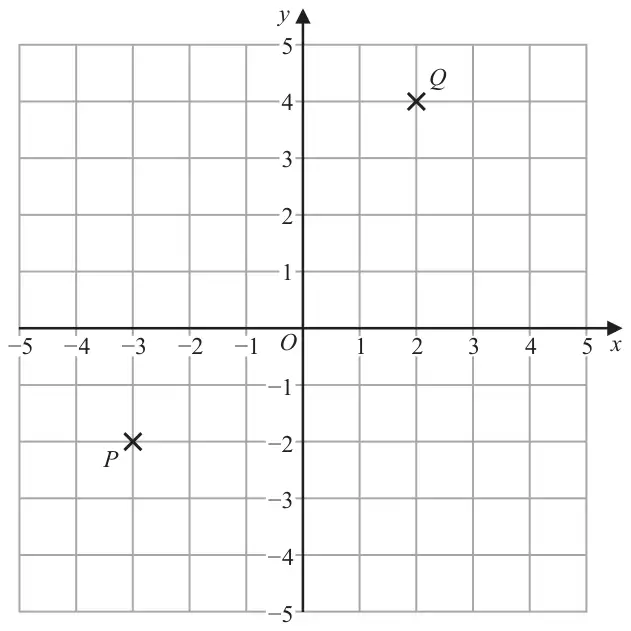
Find the coordinates of the midpoint of \(PQ\). (2)
Mark scheme
Answer
Mark
Mark scheme
\(-0.5, 1\)
M1
for one correct coordinate or midpoint shown on diagram or correct method, eg \(\dfrac{-3+2}{2}\) or \(\dfrac{-2+4}{2}\) or for the coordinates reversed, eg \(1, -0.5\)
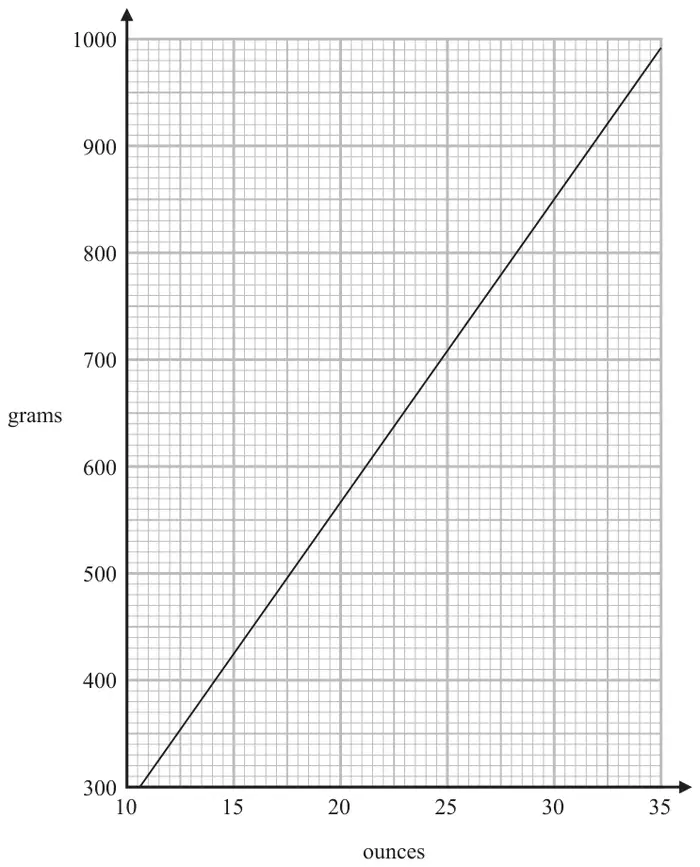
14 You can use this graph to change between ounces and grams.
(a) Change 850 grams to ounces. (1)
(b) Change 80 ounces to grams. (2)
Mark scheme (a)
Answer
Mark
Mark scheme
30
B1
cao
Mark scheme (b)
Answer
Mark
Mark scheme
2238 to 2296
M1
for a complete method eg attempts to read from the graph at a factor of 80 and scales up to 80 using a correct scale or attempts to read from the graph using numbers that sum to 80 and finds the sum of their readings or attempts to read from the graph a number that they then go on to scale up to 80 using a correct scaling factor
A1
for an answer in the range 2238 to 2296
Additional guidance
Condone some inaccuracy in reading from the graph, which should be given to within the nearest 50g
(a) Complete the table of values for \(y = x^2 - 3x + 1\)
\(x\)
\(-1\)
0
1
2
3
4
\(y\)
1
\(-1\)
(2)
(b) On the grid, draw the graph of \(y = x^2 - 3x + 1\) for values of \(x\) from \(-1\) to 4(2)
(c) Using your graph, find estimates for the solutions of the equation \(x^2 - 3x + 1 = 0\) (2)
Mark scheme (a)
Answer
Mark
Mark scheme
\(5, (1), (-1), -1, 1, 5\)
B2
for all 4 values correct
(B1
for 2 or 3 correct values)
Mark scheme (b)
Answer
Mark
Mark scheme
Graph drawn
B2
for a fully correct graph
(B1
ft (dep on B1 in (a)) for plotting at least 5 of the points from their table correctly)
Additional guidance
Accept a freehand graph drawn that is not made of line segments Ignore anything drawn outside the required range
Mark scheme (c)
Answer
Mark
Mark scheme
0.3 to 0.5 and 2.5 to 2.7
M1
for a correct method, eg marking intercepts with \(x\)-axis or one correct solution or both solutions given as a coordinates, eg (0.4, 2.6) or (0.4, 0) and (2.6, 0)
A1
for answers in the range 0.3 to 0.5 and 2.5 to 2.7 or ft their graph with at least 2 solutions
16 Steve drove from his home to his friend’s house. He stayed at his friend’s house and then drove home.
Here is Steve’s travel graph.
(a) For how many minutes did Steve stay at his friend’s house? (1)
(b) What was Steve’s average speed on his journey home? (2)
Mark scheme (a)
Answer
Mark
Mark scheme
45
B1
cao
Mark scheme (b)
Answer
Mark
Mark scheme
50
M1
for an attempt to find the gradient eg \(\text{``}25\text{''} \div \text{``}0.5\text{''}\) ft their readings from the travel graph; use of speed-time formula eg \(25 \div 30\) (ignore units if shown)
A1
cao
Additional guidance
could be shown in working or on the graph using any acceptable triangle; could be shown by multiples of 25, 0.5 or multiples of ft figures
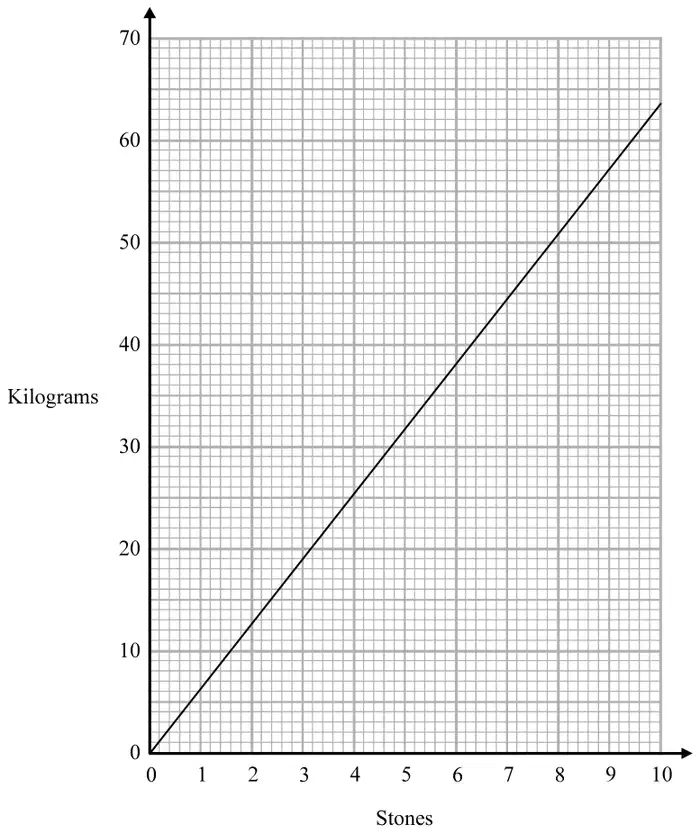
11 You can use this graph to change between stones and kilograms.
(a) Change 3 stones to kilograms. (1)
(b) Change 80 kilograms to stones. (2)
Mark scheme (a)
Answer
Mark
Mark scheme
19
B1
cao
Mark scheme (b)
Answer
Mark
Mark scheme
12.4 to 12.8
M1
for a complete method, eg attempts to read from the graph at a factor of 80 and scales up to 80 or attempts to read from the graph at two numbers that sum to 80 and finds the sum of their readings or 1 stone = “6”kg and \(80 \div \text{``}6\text{''}\)
A1
for an answer in the range 12.4 to 12.8 or ft correct reading from graph
(a) Complete this table of values for \(y = x^2 + x - 4\)
\(x\)
\(-3\)
\(-2\)
\(-1\)
\(0\)
\(1\)
\(2\)
\(3\)
\(y\)
\(-2\)
\(-4\)
\(-2\)
(2)
(b) On the grid, draw the graph of \(y = x^2 + x - 4\) for values of \(x\) from \(-3\) to 3(2)
(c) Use the graph to estimate a solution to \(x^2 + x - 4 = 0\) (1)
Mark scheme (a)
Answer
Mark
Mark scheme
\(2, -4, 2, 8\)
B2
all 4 values correct
(B1
for 2 or 3 correct values)
Mark scheme (b)
Answer
Mark
Mark scheme
Graph
M1
(dep B1) for at least 5 points plotted correctly ft from part a
A1
for a fully correct curve drawn
Additional guidance
Accept freehand curves drawn that are not line segments; there must be some attempt to draw the minimum point below \(y = -4\).
Mark scheme (c)
Answer
Mark
Mark scheme
\(-2.6\) or 1.6
B1
for 1 correct value, ft a non linear graph
Additional guidance
Award for \(-2.6\) or 1.6 or both values but do not award the mark if a correct value is given with an incorrect value. Accept 1.56 or \(-2.56\) Note for ft to be applied the graph may be joined by line segments.
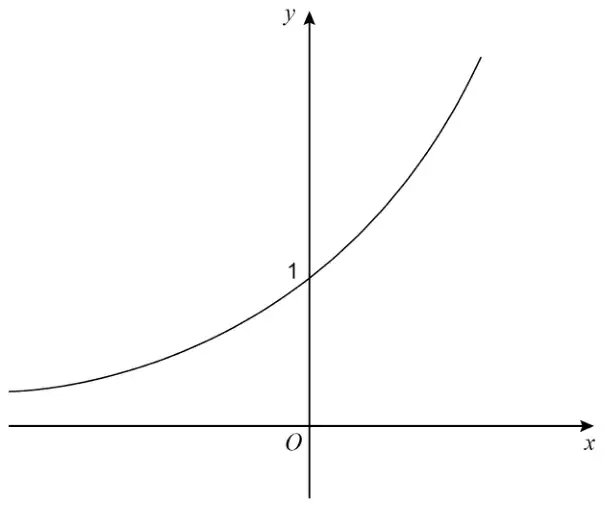
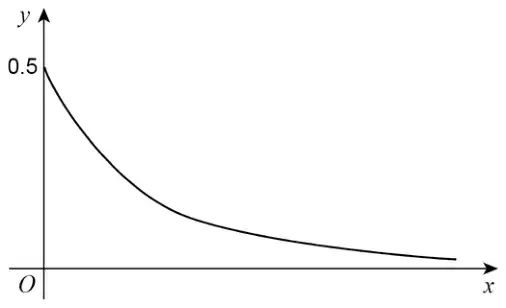
14 On the grid, sketch the curve with equation \(y = 2^x\) Give the coordinates of any points of intersection with the axes.
(2)
Mark scheme
Answer
Mark
Mark scheme
curve
C1
sketch of graph which starts above \(x\)-axis for negative \(x\), and makes an increasing exponential rise into positive \(x\)
(0,1) labelled
C1
for showing a label of (0,1) on the \(y\) axis
Additional guidance
Condone graph “touching” the \(x\) axis. Do not award from a graph for positive \(x\) only.
Do not award if a point is given for crossing the \(x\)-axis. Accept the coordinates shown as a label of “1” written on the \(y\) axis at the intersection.
(a) Complete this table of values for \(y = x^2 + x - 4\)
\(x\)
\(-3\)
\(-2\)
\(-1\)
\(0\)
\(1\)
\(2\)
\(3\)
\(y\)
\(-2\)
\(-4\)
\(-2\)
(2)
(b) On the grid, draw the graph of \(y = x^2 + x - 4\) for values of \(x\) from \(-3\) to 3(2)
(c) Use the graph to estimate a solution to \(x^2 + x - 4 = 0\) (1)
Mark scheme (a)
Answer
Mark
Mark scheme
\(2, -4, 2, 8\)
B2
all 4 values correct
(B1
for 2 or 3 correct values)
Mark scheme (b)
Answer
Mark
Mark scheme
Graph
M1
(dep B1) for at least 5 points plotted correctly ft from part a
A1
for a fully correct curve drawn
Additional guidance
Accept freehand curves drawn that are not line segments; there must be some attempt to draw the minimum point below \(y = -4\).
Mark scheme (c)
Answer
Mark
Mark scheme
\(-2.6\) or 1.6
B1
for 1 correct value, ft a non linear graph
Additional guidance
Award for \(-2.6\) or 1.6 or both values but do not award the mark if a correct value is given with an incorrect value. Accept 1.56 or \(-2.56\) Note for ft to be applied the graph may be joined by line segments.
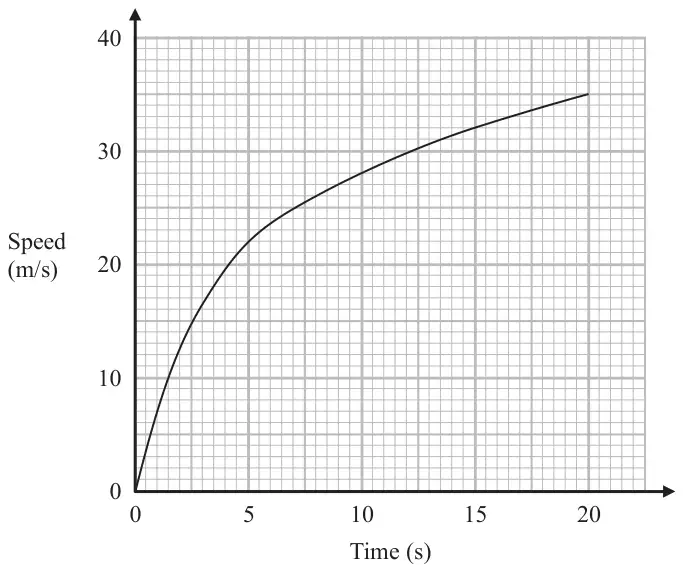
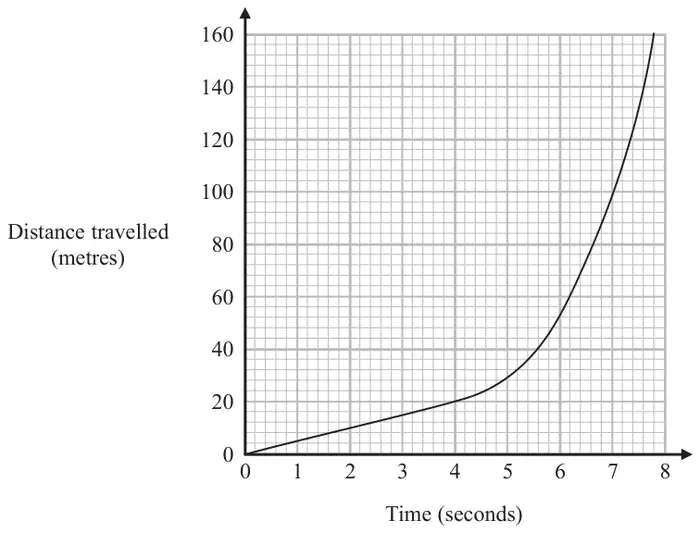
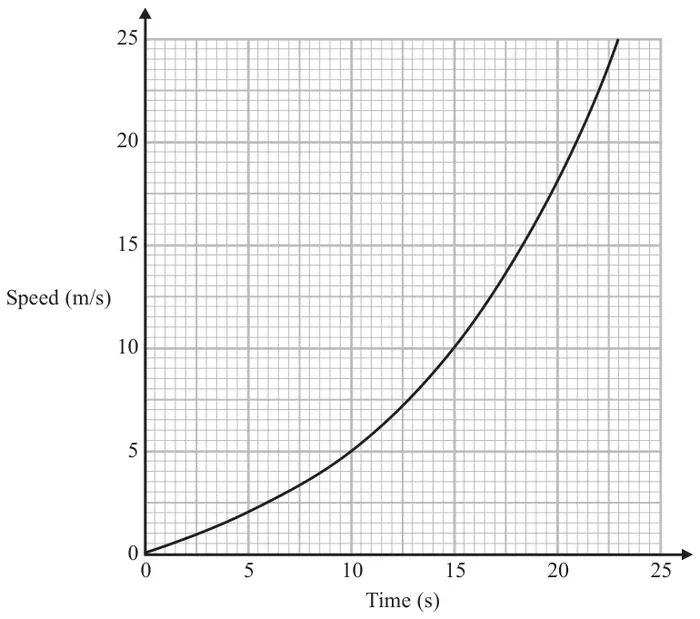
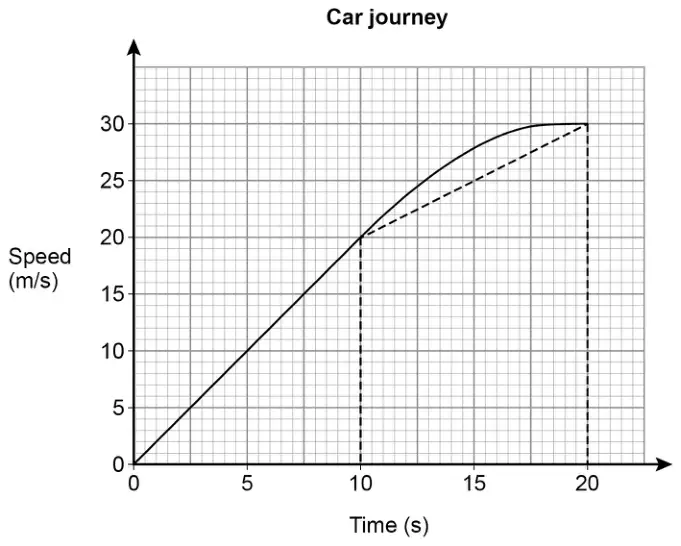
15 The graph shows the speed of a car, in metres per second, during the first 20 seconds of a journey.
(a) Work out an estimate for the distance the car travelled in the first 20 seconds. Use 4 strips of equal width. (3)
(b) Is your answer to part (a) an underestimate or an overestimate of the actual distance the car travelled in the first 20 seconds? Give a reason for your answer. (1)
Mark scheme (a)
Answer
Mark
Mark scheme
488 to 507
M1
for method to find area of one strip using trapezia, eg \(\frac{1}{2} \times 5 \times 22\) (= 55) or \(\frac{1}{2} \times 5 \times (22 + 28)\) (= 125) or \(\frac{1}{2} \times 5 \times (28 + 32)\) (= 150) or \(\frac{1}{2} \times 5 \times (32 + 35)\) (= 167.5) OR for a method to find an estimate for the area using rectangles eg \(5 \times 22\) or \(5 \times 28\) or \(5 \times 32\) or \(5 \times 35\)
M1
for complete and correct method to find the area using four strips, eg \(\frac{1}{2} \times 5 \times 22 + \frac{1}{2} \times 5 \times (22 + 28) + \frac{1}{2} \times 5 \times (28 + 32) + \frac{1}{2} \times 5 \times (32 + 35)\) or \(5 \times 22 + 5 \times 28 + 5 \times 32 + 5 \times 35\)
A1
for answer in the range 488 to 507
(SC B1 for using area under the curve)
Additional guidance
May use area of triangle + area of rectangle for the second, third and fourth strips – lengths must be correct. May use triangle for first strip, \(\frac{1}{2} \times 5 \times 22\)
May use triangle for first strip, \(\frac{1}{2} \times 5 \times 22\)
Mark scheme (b)
Answer
Mark
Mark scheme
Underestimate (supported)
C1
(dep M1) for underestimate since parts not included below the graph OR ft their method
(a) Complete the table of values for \(y = \dfrac{1}{2}x - 1\)
\(x\)
\({-2}\)
\({-1}\)
\(0\)
\(1\)
\(2\)
\(3\)
\(y\)
\({-2}\)
\(0\)
(2)
(b) On the grid, draw the graph of \(y = \dfrac{1}{2}x - 1\) for values of \(x\) from \(-2\) to 3(2)
(c) Use your graph to find the value of \(x\) when \(y = 0.3\) (1)
Mark scheme (a)
Answer
Mark
Notes
(−2) −1.5 −1 −0.5 (0) 0.5
B2
for a fully correct table
[B1
for 2 or 3 correct entries]
Mark scheme (b)
Answer
Mark
Notes
Correct line
M1
for correctly plotting at least 5 of their points (provided B1 scored in part (a)) or for a straight line with gradient 0.5 or for a straight line through \((0, -1)\) with a positive gradient
A1
for a correct line between \(x = -2\) and \(x = 3\)
Mark scheme (c)
Answer
Mark
Notes
2.6
B1
for answer in the range 2.5 to 2.7 or ft a single straight line with positive gradient
20 The equation of a curve is \(y = a^x\) \(A\) is the point where the curve intersects the \(y\)-axis.
(a) State the coordinates of \(A\). (1)
The equation of circle C is \(x^2 + y^2 = 16\)
The circle C is translated by the vector \(\begin{pmatrix} 3 \\ 0 \end{pmatrix}\) to give circle B.
(b) Draw a sketch of circle B. Label with coordinates the centre of circle B and any points of intersection with the \(x\)-axis. (3)
Mark scheme (a)
Answer
Mark
Notes
(0, 1)
B1
(0, 1)
Mark scheme (b)
Answer
Mark
Notes
Circle radius 4 Centre (3, 0) and (−1, 0) and (7, 0) labelled
M1
For centre (3, 0) implied by drawing or label or a circle of radius 4 or intersections on the \(x\)-axis at \(-1\) or 7 implied by drawing or labels
M1
for 2 of centre (3, 0) implied by drawing or label intersections on the \(x\)-axis at \(-1\) and 7 implied by drawing or label circle drawn with radius 4
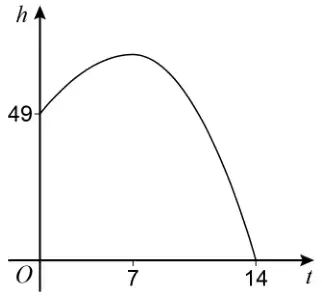
The height above ground level, \(h\), in metres, of the roller coaster is given by
\[h = -(t - 7)^2 + 49\]
where \(t\) is the time in seconds after the roller coaster starts.
Sam draws a graph of \(h\) against \(t\) for \(\quad 0 \leqslant t \leqslant 14\)
Make two criticisms of Sam’s graph. [2 marks]
Mark scheme
Answer
Mark
Comments
Any two from valid criticism about the \(h\)-intercept or valid criticism about the maximum point or valid criticism about the non-linear scaling on the horizontal axis
B2
eg graph should go through (0, 0) graph should intercept when \(h = 0\) \(y\)-intercept should be 0 eg the maximum point should be (7, 49) at \(t = 7\), \(h\) should be 49 eg 0, 7 and 14 should be evenly spaced B1 any one valid criticism
Additional guidance
Allow use of \(y\) for \(h\) or use of \(x\) for \(t\)
Each criticism may be implied by a correct, unambiguous graph drawn
11 Here is a table of values for the equation \(\quad y = 3x + 1\)
\(x\)
1
2
3
4
\(y\)
4
7
10
13
(a) Draw the graph of \(\quad y = 3x + 1 \quad\) for values of \(x\) from 1 to 4 [2 marks]
(b) Work out the value of \(y\) when \(\; x = 2.5\) [2 marks]
Mark scheme (a)
Answer
Mark
Comments
All 4 points plotted correctly with a straight line joining them
B2
\(\pm\)\(\dfrac{1}{2}\) square B1 at least two correct points plotted mark intention for straight line
Additional guidance
Ignore additional or incorrect points for B2 or B1
Ignore any line or curve extended outside the range
The correct position of the line implies correctly plotted points
Mark scheme (b)
Answer
Mark
Comments
Alternative method 1: uses the graph
Vertical line from \(x = 2.5\) to their straight line
M1
\(\pm\)\(\dfrac{1}{2}\) square implied by mark at correct point on graph or on vertical axis
their 8.5
A1ft
\(\pm\)\(\dfrac{1}{2}\) square ft their straight line graph if at least B1 awarded in (a)
Alternative method 2: substitutes into the equation
\(3 \times 2.5 + 1\)
M1
oe
8.5
A1
Alternative method 3: uses values from the table
\(\dfrac{7 + 10}{2}\)
M1
oe eg \(\dfrac{4 + 7 + 10 + 13}{4}\)
8.5
A1
Additional guidance
Alternative method 1 – must have a line in part (a)
Alternative method 1 A vertical line from the \(x\)-axis does not need to be drawn if the reading from the graph is correct within tolerance for their graph
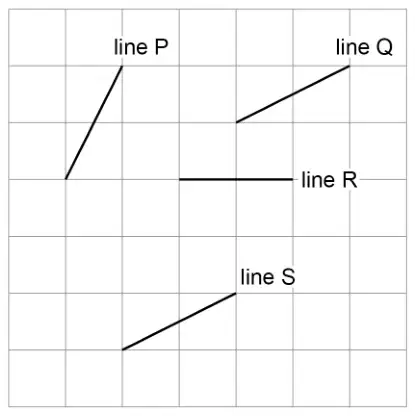
line \(\ldots\ldots\ldots\) and line \(\ldots\ldots\ldots\)
(b) Here is a different grid.
There are four points on this grid that each have
both coordinates that are whole numbers and \(x\)-coordinate \(+\) \(y\)-coordinate \(= 3\)
Plot the four points on the grid. [2 marks]
Mark scheme (a)
Answer
Mark
Comments
line Q and line S
B1
either order, may be indicated on the diagram
Mark scheme (b)
Answer
Mark
Comments
(0, 3), (1, 2), (2, 1) and (3, 0) plotted with no other points plotted on the grid
B2
B1 at least two of (0, 3), (1, 2), (2, 1) and (3, 0) plotted with up to two other points plotted on the grid or at least four points plotted that would lie on the line \(x + y = 3\) where each \(x\) and \(y\) are not all integers, with no other points plotted on the grid or all four correct coordinates given but not plotted, with no additional coordinates
Additional guidance
Mark intention
Line joining the four correct points with only the four correct points plotted
B2
Line connecting the four correct points but without points plotted
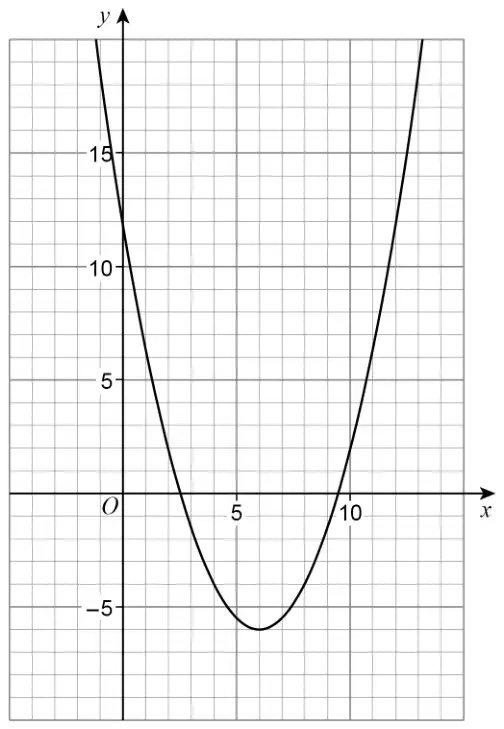
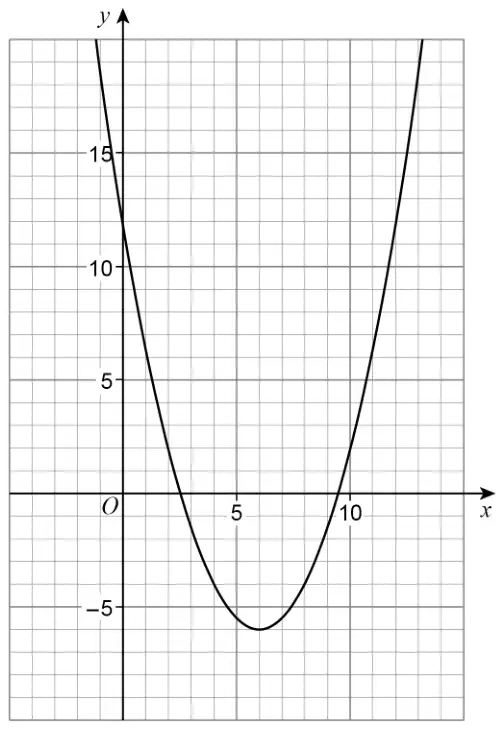
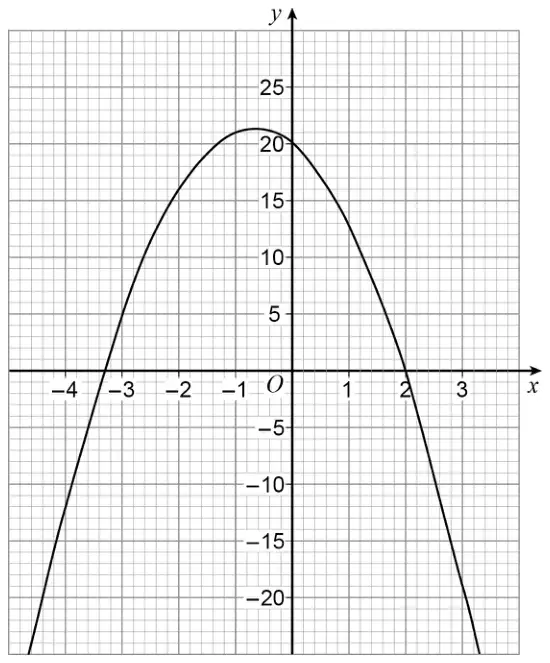
26 Here is the graph of \(\quad y = 0.5x^2 - 6x + 12\)
Use the graph to estimate the solutions of \(\quad 0.5x^2 - 6x + 12 = 0\) [2 marks]
Mark scheme
Answer
Mark
Comments
\((x =)\ [2.25, 2.75]\) and \((x =)\ [9.25, 9.75]\)
B2
B1 \((x =)\ [2.25, 2.75]\) or \((x =)\ [9.25, 9.75]\) or one or both values identified but not given in correct notation eg (2.5, 0) and/or (9.5, 0) or \(2.5 \lt x \lt 9.5\) or 2.5 and/or 9.5 written on the graph or in working
Additional guidance
\(x =\) can be \(x \approx\)
[2.25, 2.75] and/or [9.25, 9.75] with one extra value
B1
[2.25, 2.75] and/or [9.25, 9.75] with more than one extra value
B0
Answer from use of formula or completing the square
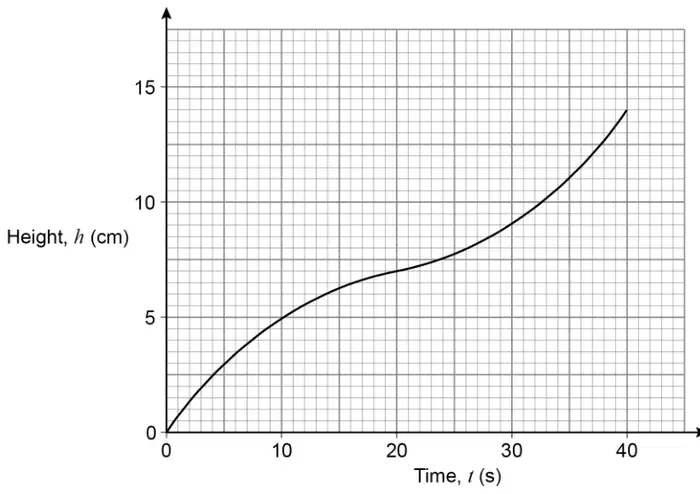
At least three of \(\dfrac{1}{2} \times 10 \times 3.2\) or 16 and \(\dfrac{1}{2} \times (3.2 + 5.8) \times 10\) or 45 and \(\dfrac{1}{2} \times (5.8 + 7.4) \times 10\) or 66 and \(\dfrac{1}{2} \times (7.4 + 6) \times 10\) or 67
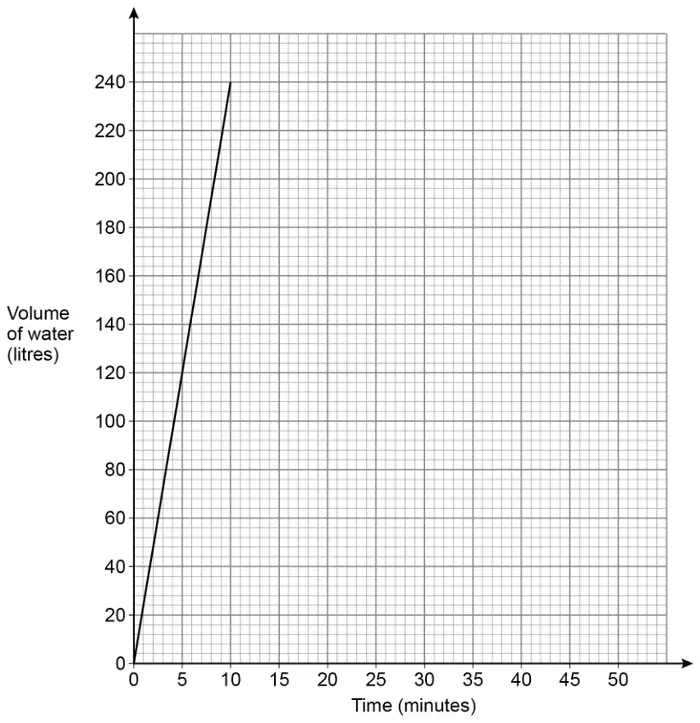
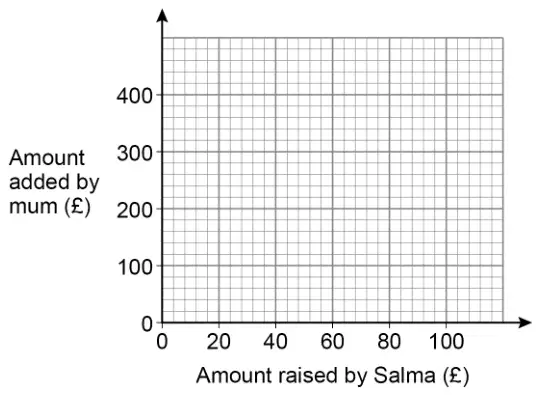
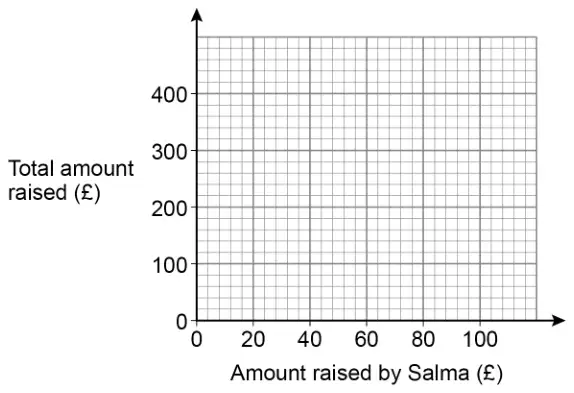
“Whatever amount you raise, I will add double that amount.”
Show this information by drawing a graph on each grid below. [2 marks]
Mark scheme
Answer
Mark
Comments
First graph is a straight line from (0, 0) to (100, 200) and second graph is a straight line from (0, 0) to (100, 300)
B2
B1 first graph is a straight line from (0, 0) to (100, 200) or second graph is a straight line from (0, 0) to (100, 300) or both graphs correct, but one or both does not reach to 0 or 100 on the horizontal axis or at least 3 correct points plotted on both graphs or B1ft first graph is an incorrect horizontal or increasing straight line to 100 on the horizontal axis, and second graph is a correct ft graph to 100 on the horizontal axis (must be joined)
Additional guidance
Ignore graphs to the right of 100 on the horizontal axes
B1ft can only be awarded if the graph fits onto the grid up to (100, 500)
9 Here is the graph of \(\quad y = 0.5x^2 - 6x + 12\)
Use the graph to estimate the solutions of \(\quad 0.5x^2 - 6x + 12 = 0\) [2 marks]
Mark scheme
Answer
Mark
Comments
\((x =)\) [2.25, 2.75] and \((x =)\) [9.25, 9.75]
B2
B1 \((x =)\) [2.25, 2.75] or \((x =)\) [9.25, 9.75] or one or both values identified but not given in correct notation eg \((2.5, 0)\) and/or \((9.5, 0)\) or \(2.5 \lt x \lt 9.5\) or 2.5 and/or 9.5 written on the graph or in working
Additional guidance
\(x =\) can be \(x \approx\)
[2.25, 2.75] and/or [9.25, 9.75] with one extra value
B1
[2.25, 2.75] and/or [9.25, 9.75] with more than one extra value
B0
Answer from use of formula or completing the square
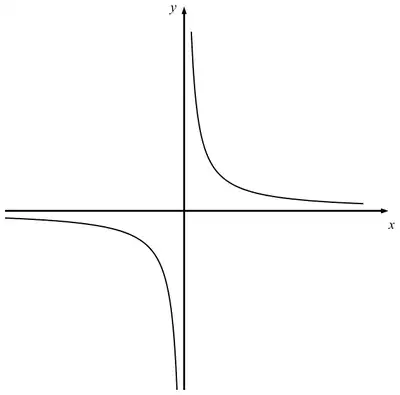
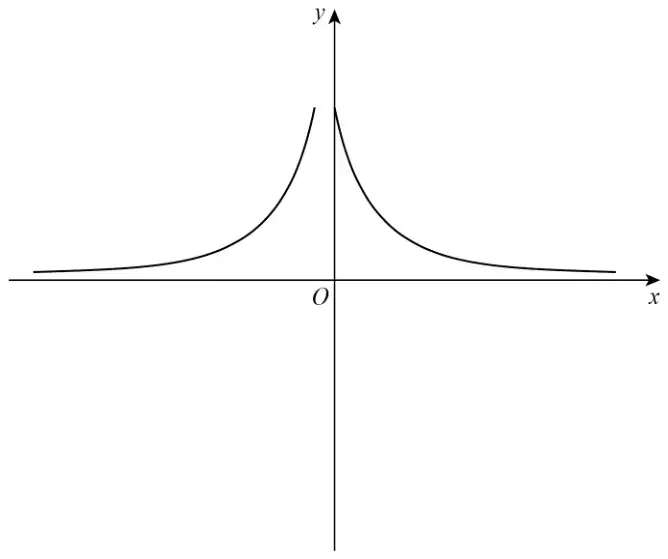
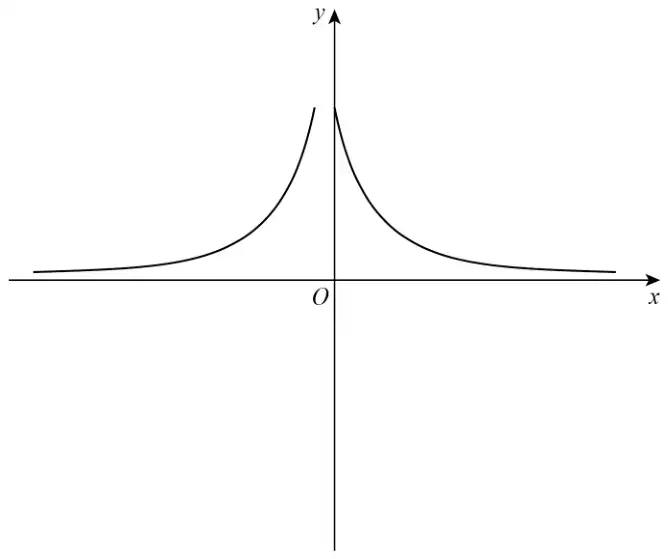
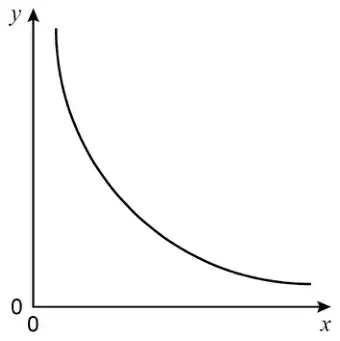
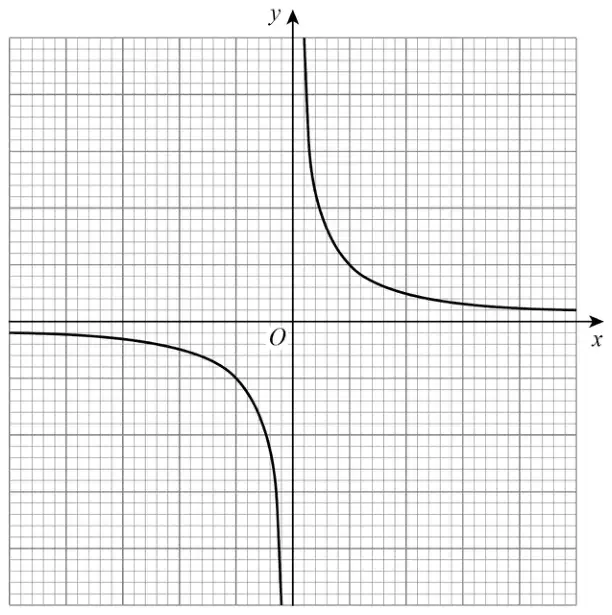
23 Erika tries to sketch the graph \(\quad y = \dfrac{1}{x} \quad\) with \(\;x \neq 0\)
Make two different criticisms of her sketch. [2 marks]
Mark scheme
Answer
Mark
Comments
Any two from: Reference to graph passing through point where \(x = 0\) Reference to graph being incorrect for negative \(x\) values Reference to the graph stopping before the end of the axes/axis
B2
B1 any one correct reference eg the graph touches the \(y\)-axis eg the graph to the left of the \(y\)-axis should be below the \(x\)-axis eg the graph should go to the ends of the axes
Additional guidance
Ignore non-contradictory, irrelevant responses alongside a correct response
Draws correct graph
B2
Draws graph with one section correct for positive values of \(x\) or negative values of \(x\)
B1 for that section
‘It isn’t the graph of \(y = \dfrac{1}{x}\)’ scores B0, but B1 may still be scored for the other criticism
‘There are no numbers on the axes’ scores B0, but B1 may still be scored for the other criticism
Mark for graph touching \(y\)-axis
You cannot have \(x = 0\)
B1
The line in the top right should be moved to the right
B1
It says \(x\) doesn’t \(= 0\) but it (the sketch) does
B1
One line is touching the \(y\)-axis
B1
The lines should be symmetrical
B0
You cannot have \(y = 0\)
B0
One line is touching the \(y\)-axis but the other isn’t
B0
Mark for negative values being in the wrong quadrant
There shouldn’t be anything in the top-left section
B1
There should be something in the bottom-left section
B1
It is the graph of \(y = \dfrac{1}{x^2}\)
B1
It should have rotational symmetry
B1
It should be symmetrical about \(y = x\)
B1
It should be symmetrical about \(y = -x\)
B1
It should be symmetrical
B0
One should be negative
B0
The bit on the left is wrong
B0
The negative values are plotted incorrectly
B0
Reference to the graph stopping before the end of the axes
9 Erika tries to sketch the graph \(\quad y = \dfrac{1}{x} \quad\) with \(\ x \neq 0\)
Make two different criticisms of her sketch. [2 marks]
Mark scheme
Answer
Mark
Comments
Any two from: Reference to graph passing through point where \(x = 0\) Reference to graph being incorrect for negative \(x\) values Reference to the graph stopping before the end of the axes/axis
B2
B1 any one correct reference eg the graph touches the \(y\)-axis eg the graph to the left of the \(y\)-axis should be below the \(x\)-axis eg the graph should go to the ends of the axes
Additional guidance
Ignore non-contradictory, irrelevant responses alongside a correct response
Draws correct graph
B2
Draws graph with one section correct for positive values of \(x\) or negative values of \(x\)
B1 for that section
‘It isn’t the graph of \(y = \dfrac{1}{x}\)’ scores B0, but B1 may still be scored for the other criticism
‘There are no numbers on the axes’ scores B0, but B1 may still be scored for the other criticism
Mark for graph touching \(y\)-axis
You cannot have \(x = 0\)
B1
The line in the top right should be moved to the right
B1
It says \(x\) doesn’t \(= 0\) but it (the sketch) does
B1
One line is touching the \(y\)-axis
B1
The lines should be symmetrical
B0
You cannot have \(y = 0\)
B0
One line is touching the \(y\)-axis but the other isn’t
B0
Mark for negative values being in the wrong quadrant
There shouldn’t be anything in the top-left section
B1
There should be something in the bottom-left section
B1
It is the graph of \(y = \dfrac{1}{x^2}\)
B1
It should have rotational symmetry
B1
It should be symmetrical about \(y = x\)
B1
It should be symmetrical about \(y = -x\)
B1
It should be symmetrical
B0
One should be negative
B0
The bit on the left is wrong
B0
The negative values are plotted incorrectly
B0
Reference to the graph stopping before the end of the axes
For eg \(40 - 24 = 16\) condone \(24 - 40 = 16\) or \(24 - 40 = -16\)
Condone incorrect use of equals sign eg \(1.2 \times 20 = 24 + 16 = 40\) or \(1.2 \times 20 = 24 - 40 = 16\)
B1
Correct response with irrelevant work
B1
16 from two different ways with one way incorrect is choice eg \(1.2 \times 20 = 24\) and \(40 - 24 = 16\) and \(20 \div 1.2 = 16\)
B0
Mark scheme (b)
Answer
Mark
Comments
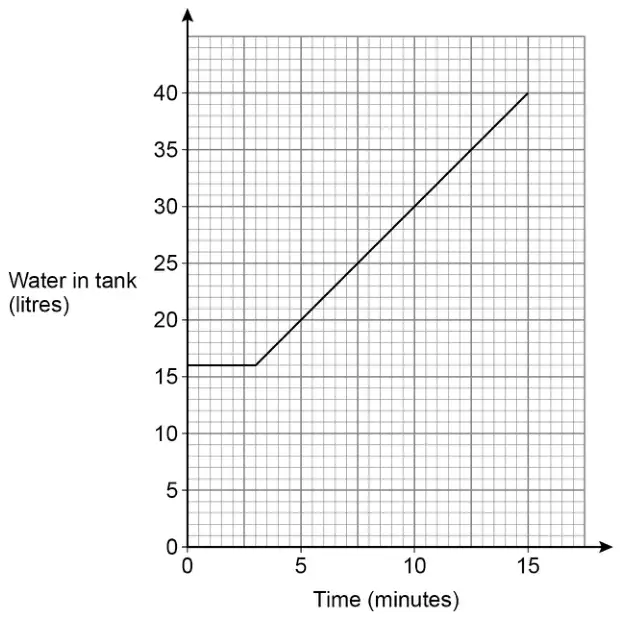
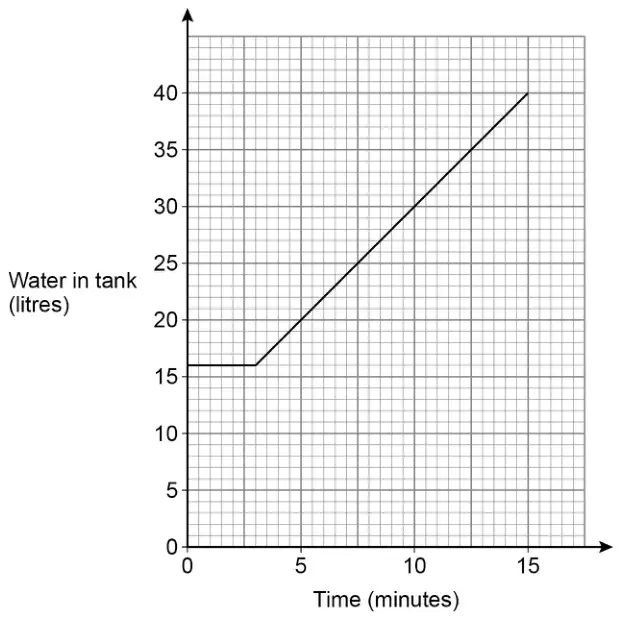
3
B1
Correct method for gradient eg \(\dfrac{40 - 16}{15 - \text{their } 3}\) or \(\dfrac{24}{12}\)
M1
oe eg \(\dfrac{30 - 25}{10 - 7.5}\) or \(\dfrac{10}{5}\) or \(40 - 38\)
2
A1ft
correct or ft their 3
Additional guidance
Note that their 3 can be used to work out the rate but does not have to be
Values seen on graph must be used correctly eg 24 and 12 seen on the graph is M0 unless subsequently used correctly in attempt to work out the gradient
A1ft answers must be to 1 dp or better eg 3.5 \(\dfrac{40 - 16}{15 - 3.5}\) 2.1 (accept 2.08…)
B0 M1 A1ft
After B0 the method may be implied (use \(\dfrac{40 - 16}{15 - \text{their } 3}\) to check) eg 6 2.7 (accept 2.66…)
B0 M1A1ft
If the report is blank, 3 and 2 must be unambiguously identified in working to be acceptable
For eg \(40 - 24 = 16\) condone \(24 - 40 = 16\) or \(24 - 40 = -16\)
Condone incorrect use of equals sign eg \(1.2 \times 20 = 24 + 16 = 40\) or \(1.2 \times 20 = 24 - 40 = 16\)
B1
Correct response with irrelevant work
B1
16 from two different ways with one way incorrect is choice eg \(1.2 \times 20 = 24\) and \(40 - 24 = 16\) and \(20 \div 1.2 = 16\)
B0
Mark scheme (b)
Answer
Mark
Comments
3
B1
Correct method for gradient eg \(\dfrac{40 - 16}{15 - \text{their } 3}\) or \(\dfrac{24}{12}\)
M1
oe eg \(\dfrac{30 - 25}{10 - 7.5}\) or \(\dfrac{10}{5}\) or \(40 - 38\)
2
A1ft
correct or ft their 3
Additional guidance
Note that their 3 can be used to work out the rate but does not have to be
Values seen on graph must be used correctly eg 24 and 12 seen on the graph is M0 unless subsequently used correctly in attempt to work out the gradient
A1ft answers must be to 1 dp or better eg 3.5 \(\dfrac{40 - 16}{15 - 3.5}\) 2.1 (accept 2.08…)
B0 M1 A1ft
After B0 the method may be implied (use \(\dfrac{40 - 16}{15 - \text{their } 3}\) to check) eg 6 2.7 (accept 2.66…)
B0 M1A1ft
If the report is blank, 3 and 2 must be unambiguously identified in working to be acceptable
The \(x\)-values in the table make a linear sequence.
The \(y\)-values in the table make a different linear sequence.
(a) Complete the table. [2 marks]
(b) Draw a straight line passing through the points (0, 3), (2, 7) and (4, 11) [2 marks]
(c) Use the graph to work out the value of \(y\) when \(\;x = 3\) [1 mark]
Mark scheme (a)
Answer
Mark
Comments
\((x =)\) 10 and \((y =)\) 15
B2
B1 \((x =)\) 10 or \((y =)\) 15
Additional guidance
\(x\)
0
2
4
6
8
10
\(y\)
3
7
11
15
19
23
B2
Mark scheme (b)
Answer
Mark
Comments
Straight line from (0, 3) to (4, 11)
B2
B1 at least two of (0, 3), (2, 7) and (4, 11) plotted or straight line from (0, 3) to (2, 7) or straight line from (2, 7) to (4, 11) \(\pm\dfrac{1}{2}\) square
Additional guidance
B2 or B1 may be awarded for a straight line without points plotted
Mark intention
Ignore line drawn after (4, 11)
Two points plotted with the same \(x\)-coordinate is choice unless the line is drawn through one of the points
Mark scheme (c)
Answer
Mark
Comments
9
B1ft
correct or ft their line in (b) \(\pm\dfrac{1}{2}\) square
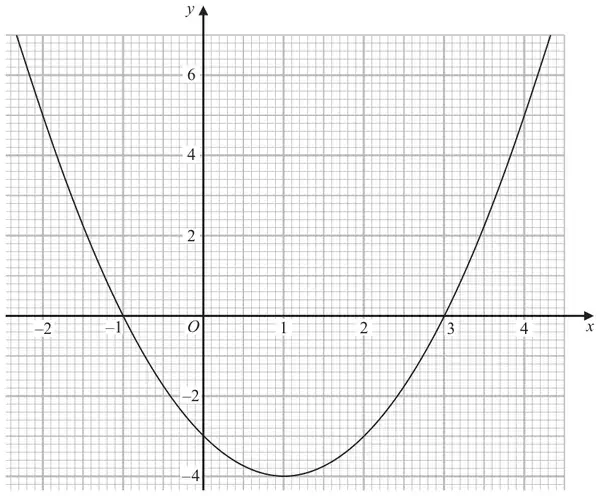
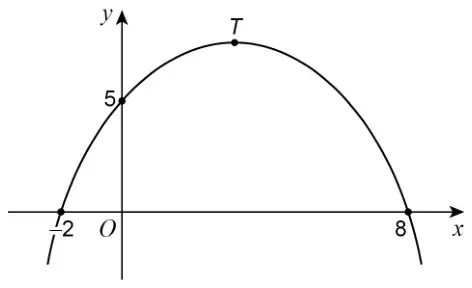
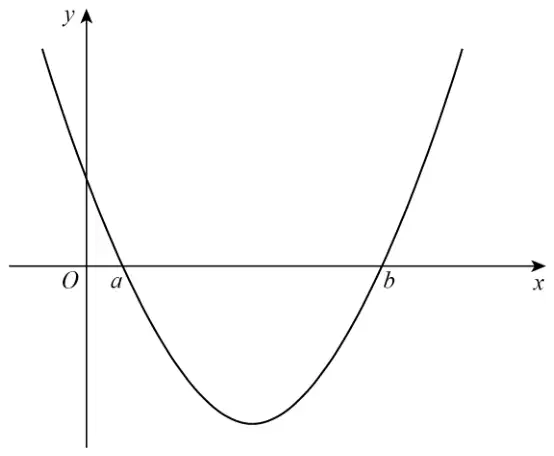
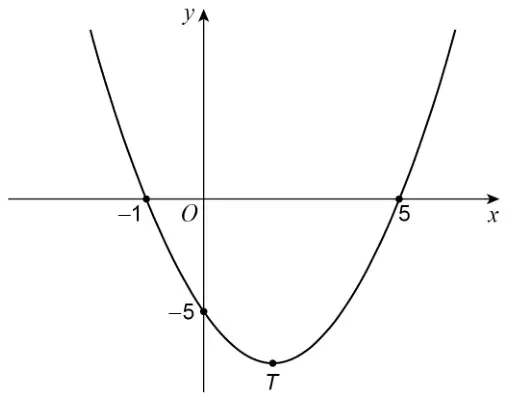
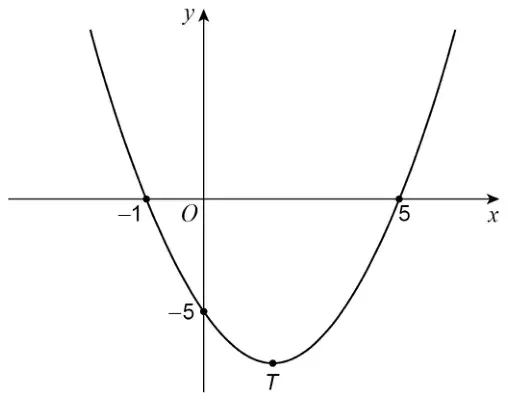
23 Here is a sketch of the curve \(\quad y = x^2 - 4x - 5\)
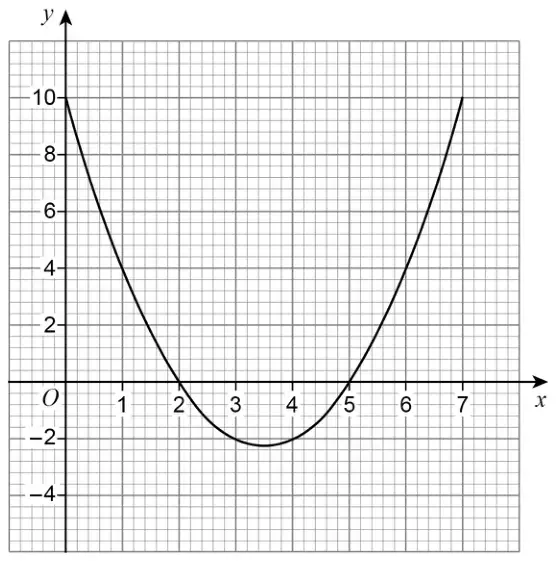
(a) Write down the two roots of \(\quad x^2 - 4x - 5 = 0\) [1 mark]
(b) Work out the coordinates of \(T\), the turning point of the curve. [2 marks]
Mark scheme (a)
Answer
Mark
Comments
\(-1\) and 5
B1
either order
Additional guidance
Ignore \(x =\) written before answers
\((-1, 0)\) or \((5, 0)\)
B0
Mark scheme (b)
Answer
Mark
Comments
\((2, -9)\)
B2
B1 \(x = 2\) or \((2, \ldots)\) or \(y = -9\) or \((\ldots, -9)\) or \((x - 2)^2 - 9\) B1ft correct \(y\)-coordinate for their \(x\)-coordinate with \(x \ne -1\), 0 or 5 SC1 \((-9, 2)\)
Additional guidance
If answer line is blank, check diagram for indication of \(x\) or \(y\) values
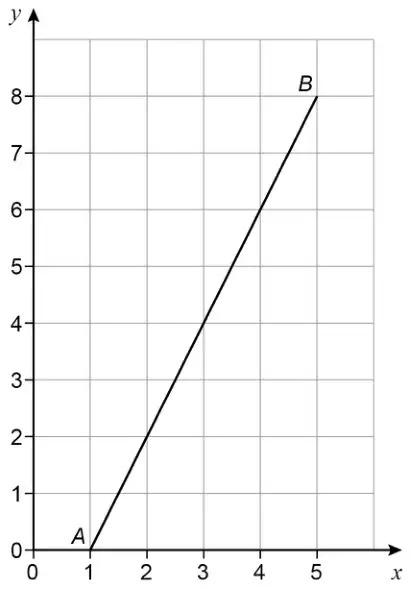
(b) Write down the coordinates of the midpoint of \(AB\). [1 mark]
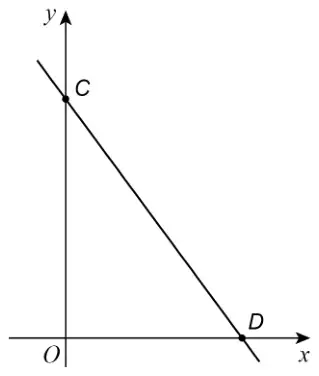
(c) \(D\) is the point on the grid that makes \(ABCD\) a parallelogram.
Work out the coordinates of \(D\). [1 mark]
(d) Write down the equation of the line passing through \(A\) and \(B\). [1 mark]
Mark scheme (a)
Answer
Mark
Comments
(8, 1)
B1
accept \((\overset{x}{8},\ \overset{y}{1})\)
Additional guidance
\((8x, 1y)\)
B0
Mark scheme (b)
Answer
Mark
Comments
(7, 6)
B1
accept \((\overset{x}{7},\ \overset{y}{6})\)
Additional guidance
\((7x, 6y)\)
B0
Mark scheme (c)
Answer
Mark
Comments
(2, 1)
B1
accept \((\overset{x}{2},\ \overset{y}{1})\)
Additional guidance
\((2x, 1y)\)
B0
If two or more parts have \((x, y)\) as \((y, x)\) then give the first 0 and condone the other(s) eg1 (a) (1, 8) (b) (6, 7) (c) (1, 2) eg2 (a) (1, 8) (b) (7, 6) (c) (1, 2) eg3 (a) (1, 8) (b) (6, 10) (c) (1, 2) eg4 (a) (8, 1) (b) (6, 7) (c) (1, 2)
6 Here is a sketch of the curve \(\quad y = x^2 - 4x - 5\)
(a) Write down the two roots of \(\quad x^2 - 4x - 5 = 0\) [1 mark]
(b) Work out the coordinates of \(T\), the turning point of the curve. [2 marks]
Mark scheme (a)
Answer
Mark
Comments
\(-1\) and 5
B1
either order
Additional guidance
Ignore \(x =\) written before answers
(\(-1\), 0) or (5, 0)
B0
Mark scheme (b)
Answer
Mark
Comments
(2, \(-9\))
B2
B1 \(x = 2\) or (2, …) or \(y = -9\) or (…, \(-9\)) or \((x - 2)^2 - 9\) B1ft correct \(y\)-coordinate for their \(x\)-coordinate with \(x \ne -1\), 0 or 5 SC1 (\(-9\), 2)
Additional guidance
If answer line is blank, check diagram for indication of \(x\) or \(y\) values
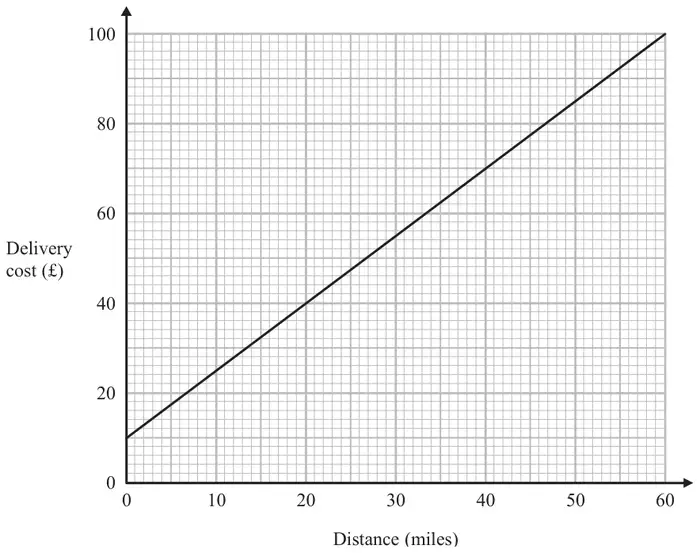
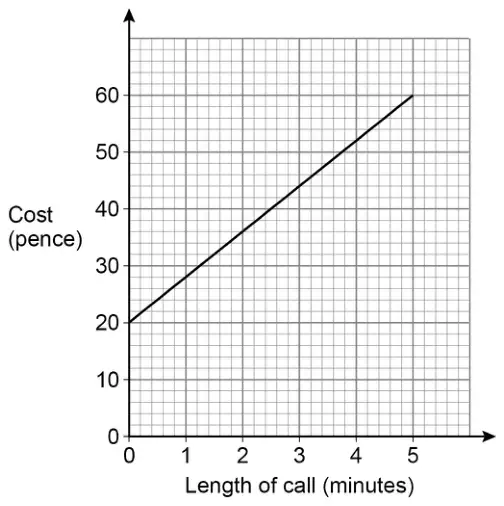
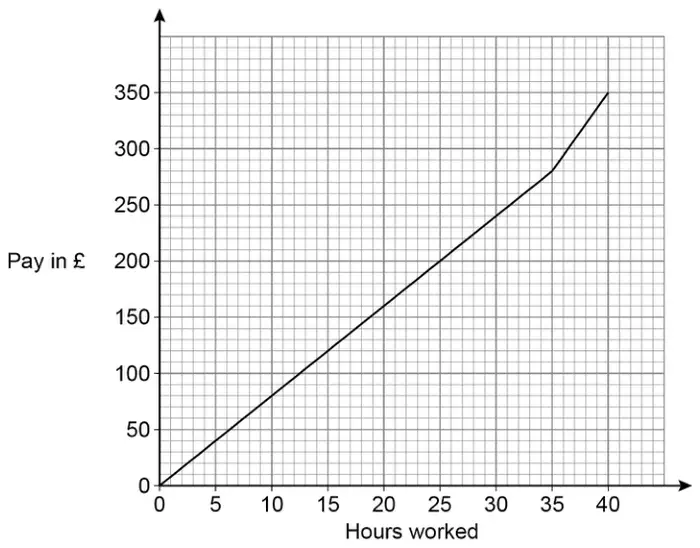
The costs of phone calls up to 5 minutes are represented by the graph.
(a) Write down the fixed charge. [1 mark]
(b) Work out the charge per minute. [2 marks]
(c) Work out the cost of a phone call lasting 7 minutes. [2 marks]
Mark scheme (a)
Answer
Mark
Comments
20
B1
Mark scheme (b)
Answer
Mark
Comments
\(28 - 20\) or \(\dfrac{36 - 20}{2}\) or \(\dfrac{44 - 20}{3}\) or \(\dfrac{52 - 20}{4}\) or \(\dfrac{60 - 20}{5}\) or correct calculation using any two points, eg \(\dfrac{60 - 44}{2}\) or \(2 \times 4\)
M1
8
A1
Additional guidance
\((60 \div 5 =)\ 12\)
M0A0
Mark scheme (c)
Answer
Mark
Comments
Alternative method 1
their \(20 + 7 \times\) their 8
M1
oe
76
A1ft
correct answer or ft their values in (a) and (b)
Alternative method 2
\(60 + 2 \times\) their 8
M1
oe
76
A1ft
correct answer or ft their values in (b)
Additional guidance
For Alt 2, they may read off any cost for \(n\) minutes (from 1 to 5) and add on \((7 - n) \times\) their (b) for M1. A1 or A1ft may follow from their working
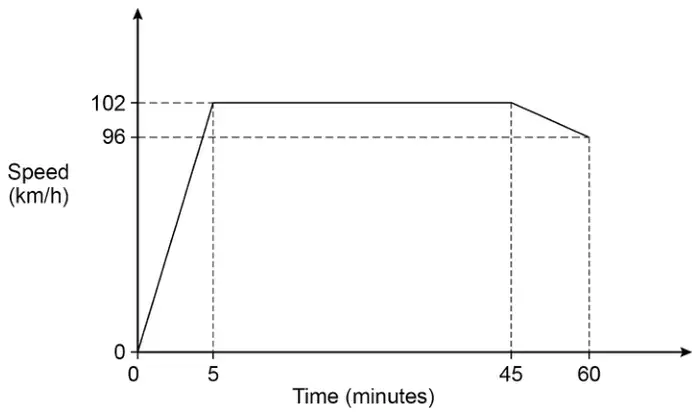
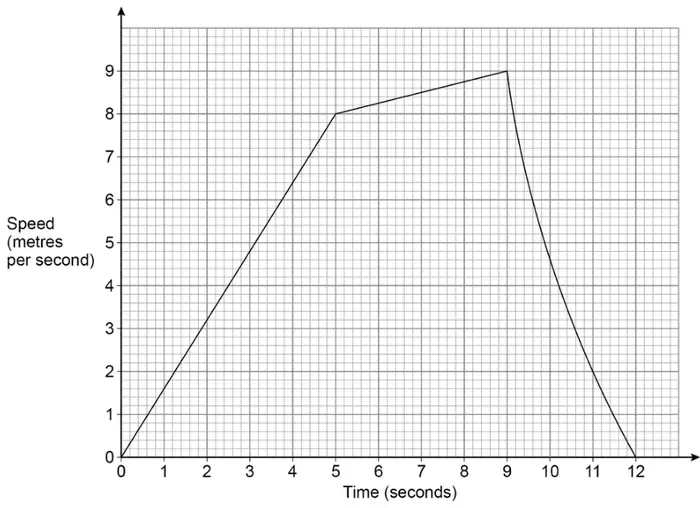
25 Here is a sketch of a speed-time graph for the first part of a journey.
The total distance for the journey is 130 kilometres.
How far is left to travel? [4 marks]
Answer in km
Mark scheme
Answer
Mark
Comments
Alternative method 1
Correct method to work out any viable distance, eg \(\dfrac{1}{2} \times \dfrac{5}{60} \times 102\) or 4.25 (first section) or \(102 \times \dfrac{40}{60}\) or 68 (second section) or \(\dfrac{1}{2}(102 + 96) \times \dfrac{15}{60}\) or \(96 \times \dfrac{15}{60}\) and \(\dfrac{1}{2} \times 6 \times \dfrac{15}{60}\) or 24 and 0.75 or 24.75 (third section) or \(\dfrac{1}{2}\left(\dfrac{40}{60} + \dfrac{45}{60}\right) \times 102\) or 72.25 (first and second sections)
M1
Correct method to work out all parts of distance, eg \(\dfrac{1}{2} \times \dfrac{5}{60} \times 102\) or 4.25 and \(102 \times \dfrac{40}{60}\) or 68 and \(\dfrac{1}{2}(102 + 96) \times \dfrac{15}{60}\) or 24.75
M1dep
97 scores M1M1
\(130 -\) their whole distance or \(130 - 97\)
M1dep
eg \(130 -\) their \(4.25 -\) their \(68 -\) their 24.75 dep on M2
33
A1
Alternative method 2
Correct method to work out \(60 \times\) any viable distance, eg \(\dfrac{1}{2} \times 5 \times 102\) or 255 (first section) or \(102 \times 40\) or 4080 (second section) or \(\dfrac{1}{2}(102 + 96) \times 15\) or \(96 \times 15\) and \(\dfrac{1}{2} \times 6 \times 15\) or 1440 and 45 or 1485 (third section) or \(\dfrac{1}{2}(40 + 45) \times 102\) or 4335 (first and second sections)
M1
Correct method to work out \(60 \times\) all parts of distance, eg \(\dfrac{1}{2} \times 5 \times 102\) or 255 and \(102 \times 40\) or 4080 and \(\dfrac{1}{2}(102 + 96) \times 15\) or 1485
M1dep
5820 implies M1M1
\(130 -\) their whole distance or \(130 - \dfrac{5820}{60}\) or \(130 - 97\)
M1dep
eg \(130 - \dfrac{\text{their } 255 + \text{their } 4080 + \text{their } 1485}{60}\) dep on M2
33
A1
Additional guidance
Accept fractions used as decimals correct to 2 dp or better
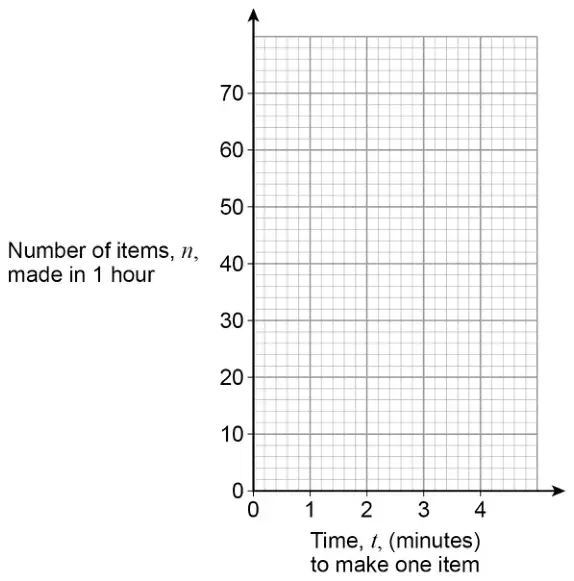
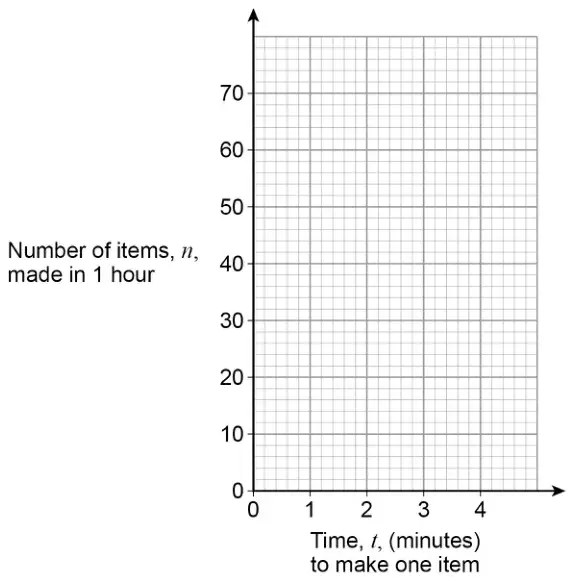
26 The number of items, \(n\), made in 1 hour by a machine is given by \(\quad n = \dfrac{60}{t}\)
\(t\) is the time in minutes the machine takes to make one item.
The value of \(t\) changes for different types of item.
(a) On the grid below, draw the graph of \(\quad n = \dfrac{60}{t} \quad\) for values of \(t\) from 1 to 4 [2 marks]
(b) The machine takes 3 minutes 30 seconds to make one item.
Use your graph to estimate the value of \(n\). [2 marks]
Mark scheme (a)
Answer
Mark
Comments
Plots the points (1, 60), (2, 30), (3, 20) and (4, 15)
M1
\(\pm \dfrac{1}{2}\) small square
Correct smooth curve through correct four points
A1
\(\pm \dfrac{1}{2}\) small square
Additional guidance
Ignore any calculations and mark the graph only
Points cannot be implied by a bar chart or vertical line graph, but condone crosses at the top of a vertical line graph for M1 and the correct curve superimposed for M1A1
For M1, ignore the curve outside the domain \(1 \leqslant t \leqslant 4\) For A1, whether or not the curve extends outside the domain \(1 \leqslant t \leqslant 4\) it must not have a positive gradient at any point
If there is no curve, for M1 there must be no other points with \(x\)-coordinate 1, 2, 3 or 4
The curve should be a single line with no feathering
Unless it affects the shape of the curve (in which case A1 cannot be awarded), ignore incorrect evaluations of \(60 \div\) a non-integer value eg \(60 \div 1.5 = \ldots\)
Mark scheme (b)
Answer
Mark
Comments
Vertical line from \(3\dfrac{1}{2}\) minutes to their graph
M1
\(\pm \dfrac{1}{2}\) small square implied by mark at correct place on the graph or on the vertical axis (but not on the horizontal axis) or by correct reading from their graph
Correct reading from their graph for \(t = 3.5\)
A1ft
ft their graph \(\pm \dfrac{1}{2}\) small square
Additional guidance
Correct reading for their graph, with or without evidence of using graph
M1A1
No graph in (a)
M0A0
To score any marks, their graph must be decreasing in the domain \(1 \leqslant t \leqslant 4\), but may be a straight line or series of connected straight lines
Answer from \(60 \div 3.5\) with no graph, or which does not match graph
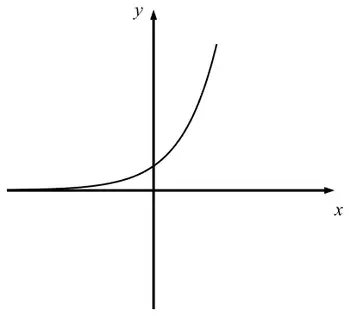
23 Here is a sketch of the curve \(\quad y = 2^x\)
On the axes above, sketch the curve \(\quad y = 3^x\) [2 marks]
Mark scheme
Answer
Mark
Comments
Correct curve
B2
B2 correct curve must be correct shape and pass through (0, 1) and be in correct position relative to \(y = 2^x\) B1 correct shape and pass through (0, 1)
Additional guidance
Correct curve must be an exponential graph
Correct position must be above \(\ y = 2^x\ \) for \(x > 0\) below \(\ y = 2^x\ \) for \(x < 0\)
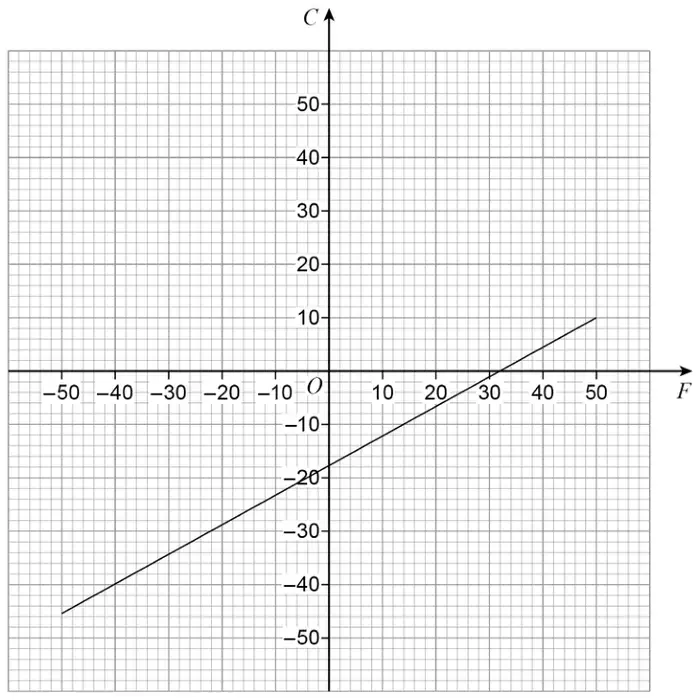
temperature in degrees Fahrenheit (\(F\)) and temperature in degrees Celsius (\(C\)).
(a) Use the graph to convert 40 degrees Fahrenheit into degrees Celsius. [1 mark]
At one temperature, \(T\),
the number of degrees Celsius is double the number of degrees Fahrenheit.
The graph of \(\quad C = 2F \quad\) can be drawn to help find this temperature.
(b) On the grid above, draw the graph of \(\quad C = 2F \quad\) for values of \(F\) from \(-25\) to 25
You may use the table to help you. [2 marks]
\(F\)
\(-25\)
\(C\)
\(-50\)
(c) Use your graph to estimate the value of \(T\). Give your answer in degrees Celsius. [2 marks]
Mark scheme (a)
Answer
Mark
Comments
[4, 5]
B1
Mark scheme (b)
Answer
Mark
Comments
Correct ruled straight line from \((-25, -50)\) to \((25, 50)\)
B2
\(\pm \dfrac{1}{2}\) small square ignore ends of line outside \([-25, 25]\)
B1 two correct points added to the table or at least two correct points plotted or correct line too short but crosses 2 horizontal centimetre squares
Additional guidance
The correct points in the table or on the graph may be outside \([-25, 25]\) eg \((100, 200)\) and \((-100, -200)\) in the table
B1
For B1, do not count a point as correct if another point has the same \(x\)-coordinate, otherwise ignore extra points that are incorrect
The B1 for points plotted cannot be implied by a line – you must see eg crosses or dots
Ignore incorrect points in the table if B1 or B2 gained elsewhere
Mark scheme (c)
Answer
Mark
Comments
Correct reading of \(C\) coordinate of intersection of their graph with the given graph
B2ft
ft their intersection from any line or curve \(\pm \dfrac{1}{2}\) small square B1 line drawn horizontally from point of intersection to vertical axis or \(F\) coordinate of intersection given
Additional guidance
Their line does not intersect given line or they have no line
B0
If their graph intersects given line at more than one point and they give all the \(C\) coordinates of the intersections
B1
If their line is correct the answer should be approximately \(-25\)
If their line is correct the \(F\) coordinate should be approximately \(-12\)
Both their \(-25\) and their \(-12\) given eg correct line seen and \((-25, -12)\) or \((-12, -25)\)
10 The number of items, \(n\), made in 1 hour by a machine is given by \(\quad n = \dfrac{60}{t}\)
\(t\) is the time in minutes the machine takes to make one item.
The value of \(t\) changes for different types of item.
(a) On the grid below, draw the graph of \(\quad n = \dfrac{60}{t} \quad\) for values of \(t\) from 1 to 4 [2 marks]
(b) The machine takes 3 minutes 30 seconds to make one item.
Use your graph to estimate the value of \(n\). [2 marks]
Mark scheme (a)
Answer
Mark
Comments
Plots the points (1, 60), (2, 30), (3, 20) and (4, 15)
M1
\(\pm \dfrac{1}{2}\) small square
Correct smooth curve through correct four points
A1
\(\pm \dfrac{1}{2}\) small square
Additional guidance
Ignore any calculations and mark the graph only
Points cannot be implied by a bar chart or vertical line graph, but condone crosses at the top of a vertical line graph for M1 and the correct curve superimposed for M1A1
For M1, ignore the curve outside the domain \(1 \leqslant t \leqslant 4\) For A1, whether or not the curve extends outside the domain \(1 \leqslant t \leqslant 4\) it must not have a positive gradient at any point
If there is no curve, for M1 there must be no other points with \(x\)-coordinate 1, 2, 3 or 4
The curve should be a single line with no feathering
Unless it affects the shape of the curve (in which case A1 cannot be awarded), ignore incorrect evaluations of \(60 \div\) a non-integer value eg \(60 \div 1.5 = \ldots\)
Mark scheme (b)
Answer
Mark
Comments
Vertical line from \(3\dfrac{1}{2}\) minutes to their graph
M1
\(\pm \dfrac{1}{2}\) small square implied by mark at correct place on the graph or on the vertical axis (but not on the horizontal axis) or by correct reading from their graph
Correct reading from their graph for \(t = 3.5\)
A1ft
ft their graph \(\pm \dfrac{1}{2}\) small square
Additional guidance
Correct reading for their graph, with or without evidence of using graph
M1A1
No graph in (a)
M0A0
To score any marks, their graph must be decreasing in the domain \(1 \leqslant t \leqslant 4\), but may be a straight line or series of connected straight lines
Answer from \(60 \div 3.5\) with no graph, or which does not match graph
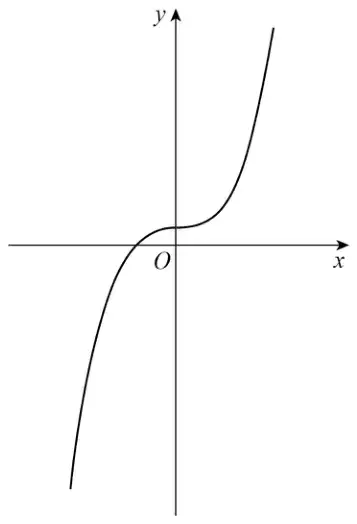
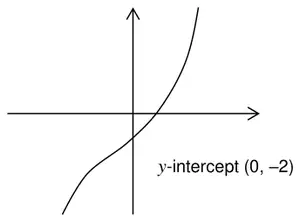
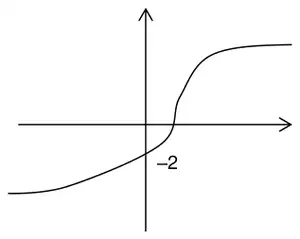
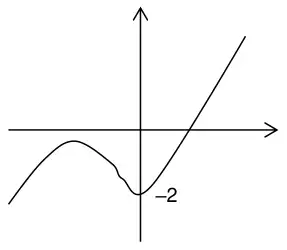
8 On the axes, sketch the curve \(\quad y = x^3 - 2\)
You must show the coordinates of the \(y\)-intercept. [2 marks]
Mark scheme
Answer
Mark
Comments
Fully correct curve and point \((0, -2)\) indicated
B2
B1 fully correct curve or partially correct curve with point \((0, -2)\) indicated
Additional guidance
A partially correct curve must start in the 3rd quadrant and finish in the 1st quadrant, passing through the 4th quadrant not include a section with negative gradient
A fully correct curve must have all the properties of a partially correct curve have only a decreasing gradient to the left of the \(y\)-axis have only an increasing gradient to the right of the \(y\)-axisCondone a positive gradient at the \(y\)-intercept Condone straight line segments at each end of the curve
Fully correct curve with \(y\)-intercept labelled \(-2\)
B2
Partially correct curve with \(y\)-intercept labelled \(-2\)
B1
\(y\)-intercept labelled \((-2, 0)\) is incorrect and can score a maximum of B1
Ignore any numbers on the axes other than the \(y\)-intercept
\(y\)-intercept \((0, -2)\) stated does indicate the point \((0, -2)\)
Unlabelled notches do not indicate the point \((0, -2)\)
A table of values does not indicate the point \((0, -2)\)
Graph consisting only of straight lines
B0
A fully correct curve but point \((0, -2)\) is not indicated
B1
Partially correct curve with point \((0, -2)\) indicated
B1
Fully correct curve with point \((0, -2)\) indicated
B2
Partially correct curve with point \((0, -2)\) indicated
B1
Curve includes a negative gradient so not partially correct
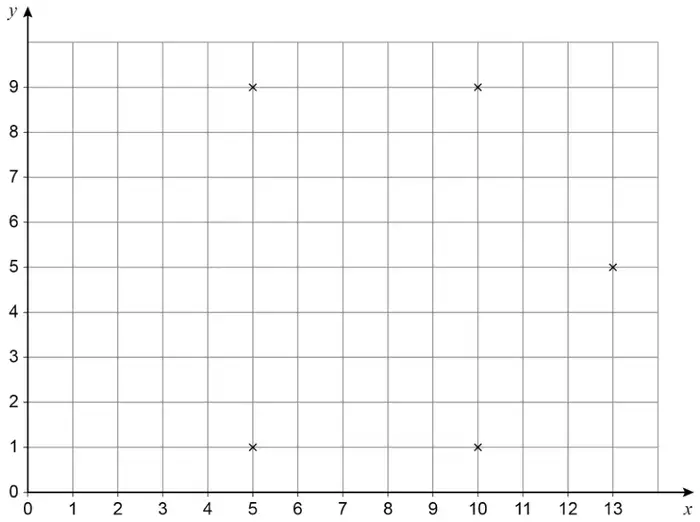
Work out one possible pair of coordinates of the other vertex. [2 marks]
Mark scheme
Answer
Mark
Comments
(2, 5) or (8, 5)
B2
B1 correct point indicated on grid or \((x, 5)\) or \((2, y)\) or \((8, y)\), where \(x\) can be \(x\) or blank or any number other than 13 and \(y\) can be \(y\) or blank or any number
Additional guidance
Mark answer line first, then if no marks scored, check grid for B1 plot
No tolerance on values of 2 or 8 for B2 but allow half a square tolerance on plotting for B1
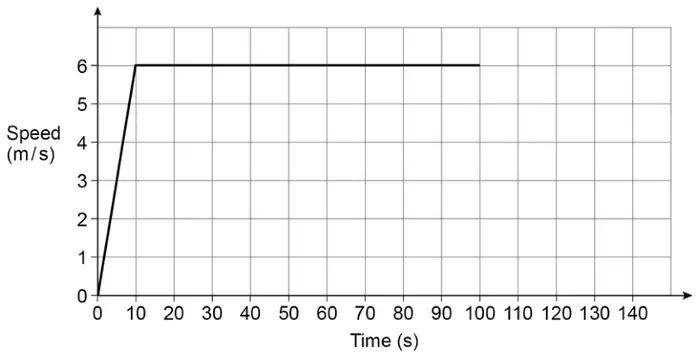
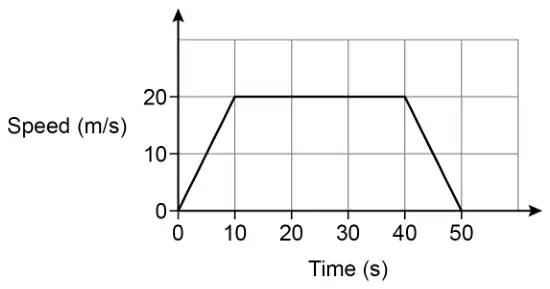
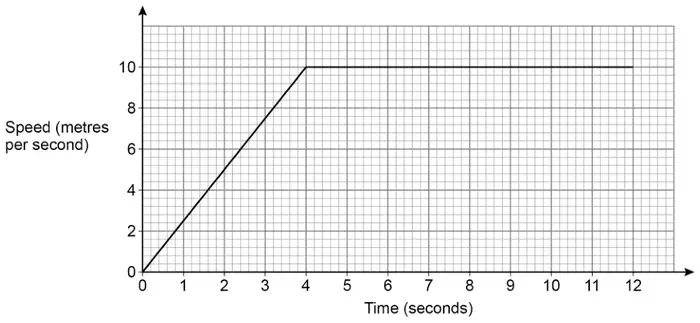
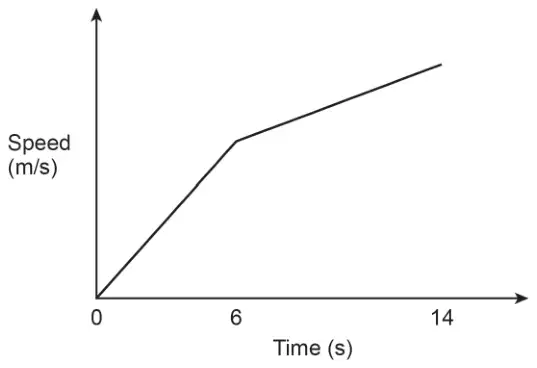
During the first 6 seconds her speed increases at a constant rate. During the last 8 seconds her speed increases at a different constant rate. Her speed at 14 seconds is 2 m/s more than her speed at 6 seconds.
Here is a sketch of her speed-time graph.
Not drawn accurately
(a) Work out her acceleration during the last 8 seconds.
State the units of your answer. [2 marks]
(b) When Izzy finishes the 80-metre race, her speed is \(v\) m/s
Work out the value of \(v\). [4 marks]
Mark scheme (a)
Answer
Mark
Comments
0.25 or \(\dfrac{1}{4}\) or \(\dfrac{2}{8}\)
B1
m/s2 or ms−2 or m/s/s or \(\dfrac{\text{m}}{\text{s}^2}\)
B1
oe eg metres per second per second SC2 acceleration and unit not in m/s2 eg 25 cm/s2 or 3240 km/h2
Additional guidance
\(\dfrac{2}{14 - 6}\) with no further simplification
(1st) B0
Mark scheme (b)
Answer
Mark
Comments
Alternative method 1
\(\dfrac{1}{2} \times 6 \times (v - 2)\) or \(\dfrac{1}{2} \times (14 - 6) \times (v + v - 2)\) or \((14 - 6) \times (v - 2)\) or \(\dfrac{1}{2} \times (14 - 6) \times 2\) or 8
M1
oe partial area any letter
\(\dfrac{1}{2} \times 6 \times (v - 2)\) \(+\; \dfrac{1}{2} \times (14 - 6) \times (v + v - 2)\) or \(3(v - 2) + 8(v - 2) + 8\) or \(11v - 14\)
M1dep
oe full area in one variable eg \(14 \times v - \dfrac{1}{2} \times 6 \times (v - 2)\) \(-\; \dfrac{1}{2} \times 2 \times (6 + 14)\) implies M2
\(\dfrac{1}{2} \times 6 \times (v - 2)\) \(+\; \dfrac{1}{2} \times (14 - 6) \times (v + v - 2) = 80\) or \(94 \div 11\)
A1
oe full area in one variable equated to 80
8.5(4…) or 8.55 or \(\dfrac{94}{11}\) or \(8\dfrac{6}{11}\)
A1
Alternative method 2
\(\dfrac{1}{2} \times 6 \times x\) or \(\dfrac{1}{2} \times (14 - 6) \times (x + x + 2)\) or \((14 - 6) \times x\) or \(\dfrac{1}{2} \times (14 - 6) \times 2\) or 8
M1
oe partial area \(x\) is the speed at 6 seconds any letter
\(\dfrac{1}{2} \times 6 \times x\) \(+\; \dfrac{1}{2} \times (14 - 6) \times (x + x + 2)\) or \(3x + 8x + 8\) or \(11x + 8\)
M1dep
oe full area in one variable eg \(14 \times (x + 2) - \dfrac{1}{2} \times 6 \times x\) \(-\; \dfrac{1}{2} \times 2 \times (6 + 14)\) implies M2
\(\dfrac{1}{2} \times 6 \times x\) \(+\; \dfrac{1}{2} \times (14 - 6) \times (x + x + 2) = 80\) or \(72 \div 11\) or 6.5(4…) or 6.55 or \(\dfrac{72}{11}\) or \(6\dfrac{6}{11}\)
A1
oe full area in one variable equated to 80
8.5(4…) or 8.55 or \(\dfrac{94}{11}\) or \(8\dfrac{6}{11}\)
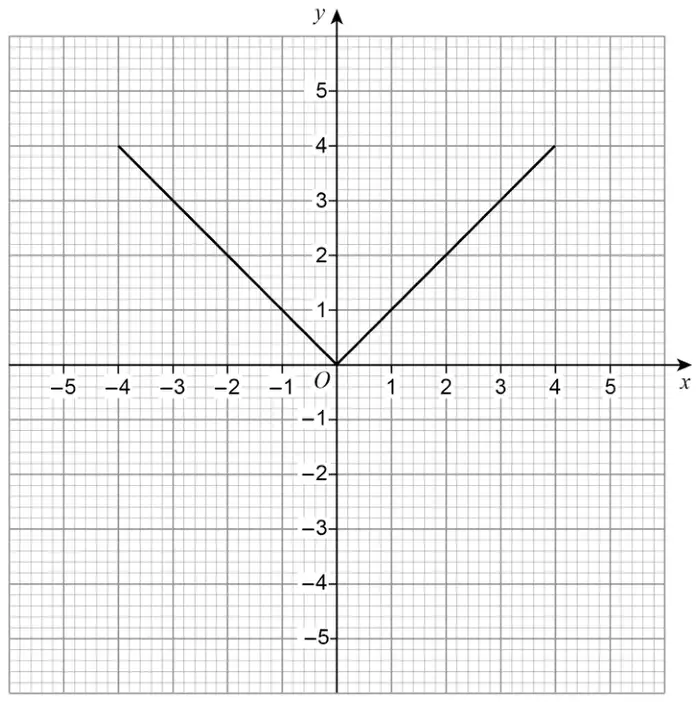
14 Lee wants to draw the graph of \(\quad y = x \quad\) for values of \(x\) from \(-5\) to 5
Here is his graph.
Make two different criticisms of his graph. [2 marks]
Criticism 1
Criticism 2
Mark scheme
Answer
Mark
Comments
The graph only goes from \(x = -4\) to \(x = 4\) and the graph shown is \(y = -x\) up to 0
B2
oe
B1 one correct criticism
SC1 correct graph drawn from \(x = -5\) to \(x = 5\)
Additional guidance
For one criticism, accept eg it doesn’t reach 5 / 5 not plotted / it doesn’t start at –5 only starts at –4 / only reaches 4 it should go to (5, 5) / (5, 5) not plotted / (–5, –5) not plotted it isn’t long enough
B1
Do not accept eg it isn’t finished (–5, 5) not plotted
B0
For the other criticism, accept eg it’s the wrong line up to 0 it’s the wrong equation for the first part \(y\) does not equal \(x\) at the beginning it should go through (–4, –4) / (–5, –5) not plotted / (–1, –1) should be plotted it should be / it’s not a straight line it shouldn’t be a V-shape worked out the negative numbers wrong / no negative \(y\)-coordinates he should have plotted … and correct table of values
B1
Do not accept eg it isn’t correctly drawn / it isn’t \(y = x\) / the points are plotted wrong it should be symmetrical / it shouldn’t be symmetrical one line should go below the \(x\)-axis
B0
NB (–5, –5) should be plotted is valid for either (but not both) criticisms
B1
Both criticisms may be in one answer space
Ignore irrelevant statements but any additional statements must be correct eg It goes from –4 to 5 not –5 to 5
\(\left(\dfrac{6 + 0}{2}, \dfrac{0 + 6}{2}\right)\) or (3, 3)
M1
coordinates of \(M\)
gradient \(OM = 1\) (and \(y = x\)) or (0, 0) and (3, 3) (and \(y = x\))
A1
must see correct working for M1
Mark scheme (d)
Answer
Mark
Comments
\(x^2 + x^2 = 36\) or \(2x^2 = 36\) or \(y^2 + y^2 = 36\) or \(2y^2 = 36\) or (–)\(6 \cos 45°\) or (–)\(6 \sin 45°\)
M1
oe equation
(–)\(\sqrt{\dfrac{36}{2}}\) or (–)\(\sqrt{18}\) or (–)\(3\sqrt{2}\) or (–)\(\dfrac{6\sqrt{2}}{2}\) or (–)\(\dfrac{6}{\sqrt{2}}\)
M1
\(\left(-\sqrt{18}, -\sqrt{18}\right)\) or \(\left(-3\sqrt{2}, -3\sqrt{2}\right)\) or \(\left(-\dfrac{6\sqrt{2}}{2}, -\dfrac{6\sqrt{2}}{2}\right)\) or \(\left(-\dfrac{6}{\sqrt{2}}, -\dfrac{6}{\sqrt{2}}\right)\)
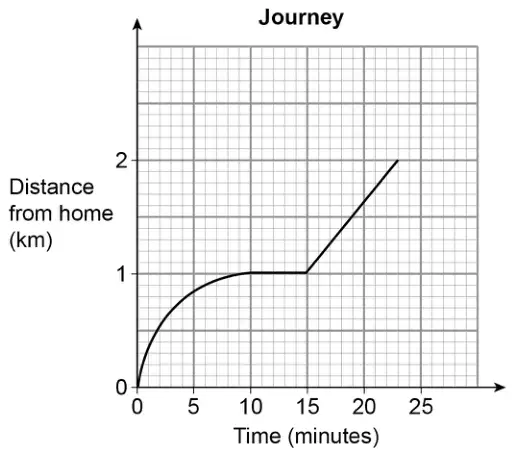
He walked from home to the shop at a constant speed in 10 minutes. He stayed at the shop for 5 minutes. He walked home at a constant speed in 8 minutes.
Anil drew this distance-time graph to represent his journey.
Make two criticisms of his graph. [2 marks]
Mark scheme
Answer
Mark
Comments
Valid criticism referring to the line from (0, 0) to (10, 1)
B1
eg there shouldn’t be a curve need to be specific about the line shape, it is not sufficient to simply say it is wrong
Valid criticism referring to the line from (15, 1)
B1
oe eg he never goes 2 km from home
Additional guidance
Criticisms can be in either order
A correct diagram takes precedence over statements, otherwise ignore diagram
For first B1:
The first part is curved
B1
The curve should be a straight line
B1
He has drawn a curve for constant speed
B1
The line is curved which shows his speed was not consistent/constant
B1
He’s not going at a constant speed to the shop (correct referral to graph)
B1
All lines should be straight
B1
Constant speed should be a diagonal/straight line
B1
The line shouldn’t curve
B1
The constant speed should be [a sloping straight line sketched]
B1
The curved line shows he decreased speed
B1
It should be a straight line from 0 to 10
B1
It should be a straight line at the start
B1
A distance-time graph shouldn’t have curves
B0
It should be a straight line ( ‘It’ seems to be referring to the whole graph)
B0
The curved line shows he increased and decreased speed
B0
He was walking at a range of speeds, so not consistent (referral to whole graph)
B0
The constant speed is drawn incorrectly (how?)
B0
The lines should be curved or straight, not both
B0
The curve should be a line of best fit
B0
It should be a straight line from 0 to 15 (it should be to 10)
B0
The curve is wrong (how?)
B0
For 2nd B1:
The line should go down at the end
B1
He isn’t walking home, he’s walking further away
B1
He has walked away from home when he hasn’t
B1
The line should go back to the bottom of the graph
B1
The graph should return to zero
B1
The last part should be decreasing (instead of increasing)
B1
The line for him walking home should have negative gradient
B1
The graph shows he didn’t walk home
B1
The line for him walking home should have negative correlation
B0
The line for the journey home goes the wrong way
B0
The graph does not show his journey home
B0
His house is 2 km away from the shop
B0
The line should be decreasing instead of increasing (which line?)
(a) Meera is using a graphical method to solve \(\quad 2x^2 - 3x = 0\)
She draws the graph of \(\quad y = 2x^2 \quad\) and a straight line graph on the same grid.
Here is the graph of \(\quad y = 2x^2\)
Complete her method to solve \(\quad 2x^2 - 3x = 0\) [2 marks]
(b) Levi is solving \(\quad 2x^2 + 5x = 0\)
He uses this method.
\[\begin{aligned} 2x^2 + 5x &= 0 && \text{subtract } 5x \text{ from both sides} \\ 2x^2 &= -5x && \text{divide both sides by } x \\ 2x &= -5 && \text{divide both sides by } 2 \\ x &= -2.5 && \end{aligned}\]
Evaluate his method and his answer. [2 marks]
Mark scheme (a)
Answer
Mark
Comments
Draws \(y = 3x\) and (\(x =\)) [−0.1, 0.1] and (\(x =\)) [1.4, 1.6]
B2
B1 Draws \(y = 3x\) or states \(y = 3x\) \(\pm\dfrac{1}{2}\) square tolerance for drawing graph Graph must be seen for \(x\) values from 0 to 1.5
Additional guidance
Ignore any \(y\) values seen
Solutions from a non-graphical method
B0
Ignore other lines drawn on grid
Mark scheme (b)
Answer
Mark
Comments
Full evaluation of method and answer
B2
eg1 Cannot divide by \(x\) as it could be zero eg2 Should have factorised and then he would have also found that \(x = 0\) eg3 Should have used the formula and then he would have also found that \(x = 0\) eg4 Should have used a graphical method then he would have also found that \(x = 0\) eg5 Should have completed the square then he would have also found that \(x = 0\)
B1 Partial evaluation eg1 \(x = 0\) has been omitted eg2 Should have factorised eg3 Should have used the formula eg4 Should have drawn a graph eg5 Only found one solution eg6 Cannot divide by zero
Additional guidance
For B2 there needs to be an evaluation of the method and an indication that \(x = 0\) has been omitted from the answer
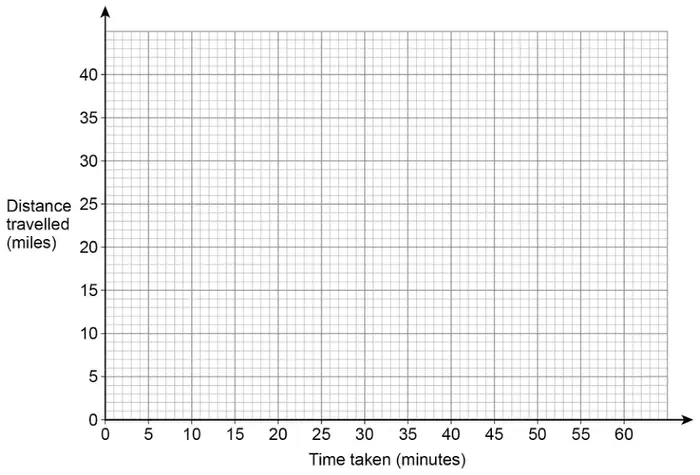
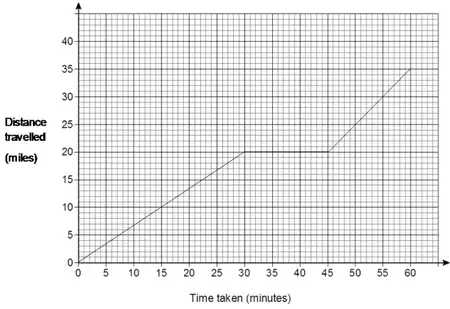
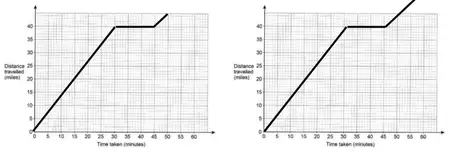
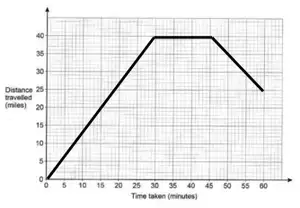
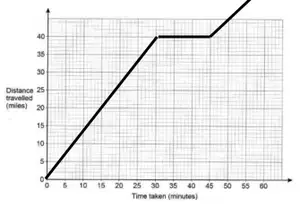
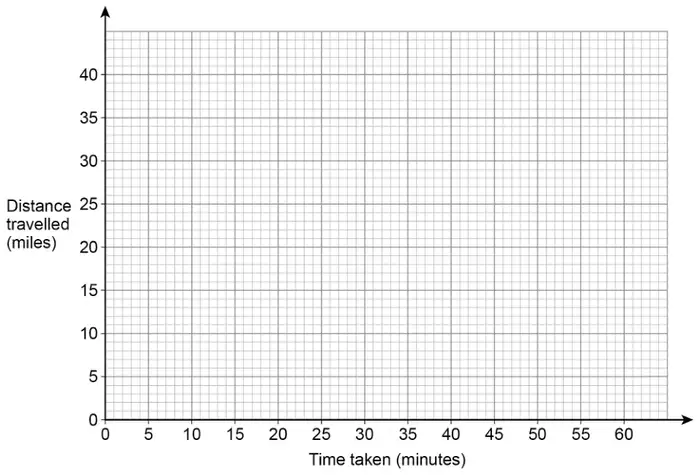
For the first 30 minutes her average speed is 40 miles per hour. She then stops for 15 minutes. She then completes the journey at an average speed of 60 miles per hour. The total journey time is 1 hour.
(a) Draw a distance-time graph for her journey. [3 marks]
(b) Write down the average speed for the total journey. [1 mark]
Mark scheme (a)
Answer
Mark
Comments
Joins (0, 0) to (30, 20)
B1
Line does not need to be straight but must start and finish at correct points and not be decreasing Mark intention
Horizontal line for 15 minutes from their (30, 20)
B1ft
Mark intention
Line with gradient 1 or a curve from their (45, 20) and stops at 60 minutes or stops at top edge of grid or higher but not beyond 60 minutes
B1ft
A curve must not be decreasing and must start and finish at two points that could be joined by a line with gradient 1 Condone a horizontal or vertical line from 60 minutes Mark intention
Additional guidance
B3
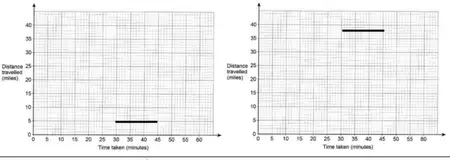
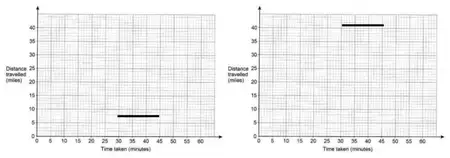
Allow any horizontal line between 30 minutes and 45 minutes if first part of journey is blank eg
B0B1
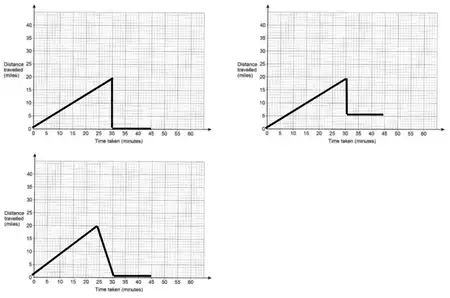
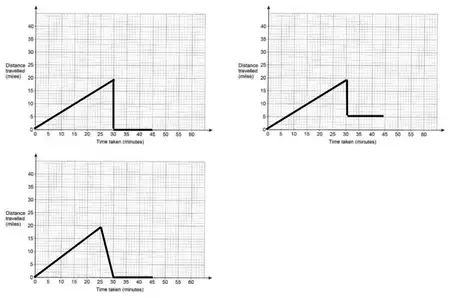
Do not allow second mark if their first line is followed by a drop back towards the horizontal axis before she stops eg
B1B0 (top two graphs) B0B0 (lower graph)
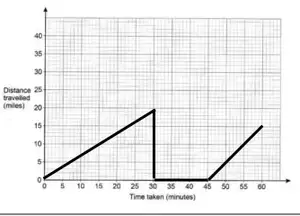
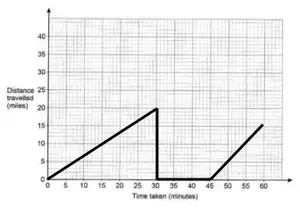
If there are more than 3 lines or curves, assume the last part is the part where she completes her journey eg
B1B0B1ft
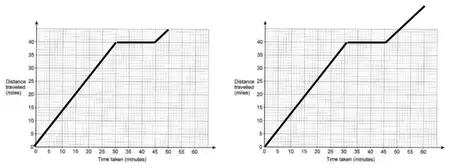
If their (45, 20) is too high to fit a line of gradient 1 ending at 60 minutes, allow the final line to stop at the top of the grid or higher, but not beyond 60 minutes eg
B0B1ftB1ft
Points but no lines
B0
Ignore any lines that could be working for part (a) or part (b)
Mark scheme (b)
Answer
Mark
Comments
35
B1ft
Correct or ft total distance travelled for their graph at 60 minutes
Additional guidance
35 from any or no graph
B1
If their graph extends beyond 60 minutes, read off at 60 minutes for ft
Follow through total distance travelled eg (a)
(b) answer 25
B0ft
(b) answer 55
B1ft
Ignores the stationary parts
B0
Do not follow through a graph above the grid at 60 eg (a)
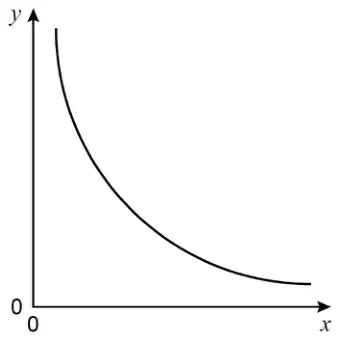
18 Nick sketches the graph of \(\quad y = 0.5^x \quad\) for \(\;x \geqslant 0\)
Make one criticism of his sketch. [1 mark]
Mark scheme
Answer
Mark
Comments
Valid criticism
B1
eg (\(y =\)) 0.5 should be (\(y =\)) 1 \(y = 0.5\) should be when \(x = 1\) When \(x = 0 \;\; y = 1\) 0.5 is incorrect Crosses \(y\) axis in wrong place Graph should start at 1 \(0.5^0 = 1\)
For the first 30 minutes her average speed is 40 miles per hour.
She then stops for 15 minutes.
She then completes the journey at an average speed of 60 miles per hour.
The total journey time is 1 hour.
(a) Draw a distance-time graph for her journey. [3 marks]
(b) Write down the average speed for the total journey. [1 mark]
Mark scheme (a)
Answer
Mark
Comments
Joins (0, 0) to (30, 20)
B1
Line does not need to be straight but must start and finish at correct points and not be decreasing Mark intention
Horizontal line for 15 minutes from their (30, 20)
B1ft
Mark intention
Line with gradient 1 or a curve from their (45, 20) and stops at 60 minutes or stops at top edge of grid or higher but not beyond 60 minutes
B1ft
A curve must not be decreasing and must start and finish at two points that could be joined by a line with gradient 1 Condone a horizontal or vertical line from 60 minutes Mark intention
Additional guidance
B3
Allow any horizontal line between 30 minutes and 45 minutes if first part of journey is blank eg
B0B1
Do not allow second mark if their first line is followed by a drop back towards the horizontal axis before she stops eg
B1B0 (first two) B0B0 (third)
If there are more than 3 lines or curves, assume the last part is the part where she completes her journey eg
B1B0B1ft
If their (45, 20) is too high to fit a line of gradient 1 ending at 60 minutes, allow the final line to stop at the top of the grid or higher, but not beyond 60 minutes eg
B0B1ftB1ft
Points but no lines
B0
Ignore any lines that could be working for part (a) or part (b)
Mark scheme (b)
Answer
Mark
Comments
35
B1ft
Correct or ft total distance travelled for their graph at 60 minutes
Additional guidance
35 from any or no graph
B1
If their graph extends beyond 60 minutes, read off at 60 minutes for ft
Follow through total distance travelled eg (a)(b) answer 25 (b) answer 55
B0ft B1ft
Ignores the stationary parts
B0
Do not follow through a graph above the grid at 60 eg (a)(b) answer 55