
Higher June 2018 Paper 2 Q17
17 A ball is thrown vertically upwards.
The graph shows the height of the ball above the ground after it is thrown.
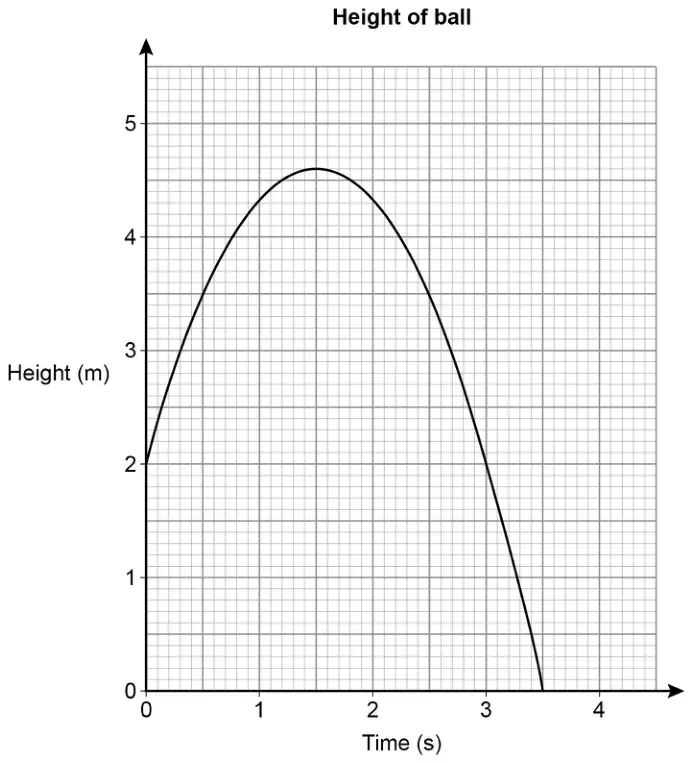
(a) For how many seconds is the ball at a height of more than 2 metres? [1 mark]
(b) After how many seconds is the ball at instantaneous rest when it is in the air? [1 mark]
(c) Work out the average speed of the ball when it is moving downwards. [2 marks]
| Answer | Mark | Comments |
|---|---|---|
| [2.9, 3] | B1 |
| Answer | Mark | Comments |
|---|---|---|
| [1.4, 1.6] | B1 |
| Answer | Mark | Comments |
|---|---|---|
| \(\dfrac{[4.55, 4.65] - 0}{3.5 - [1.5, 1.6]}\) or \(\dfrac{[4.55, 4.65]}{[1.9, 2]}\) or \(\dfrac{[4.55, 4.65] - 0}{[1.5, 1.6] - 3.5}\) or \(\dfrac{[4.55, 4.65]}{[-2, -1.9]}\) or \([-2.45, -2.275]\) | M1 | oe |
| [2.275, 2.45] | A1 |