
Higher November 2023 Paper 3 Q21
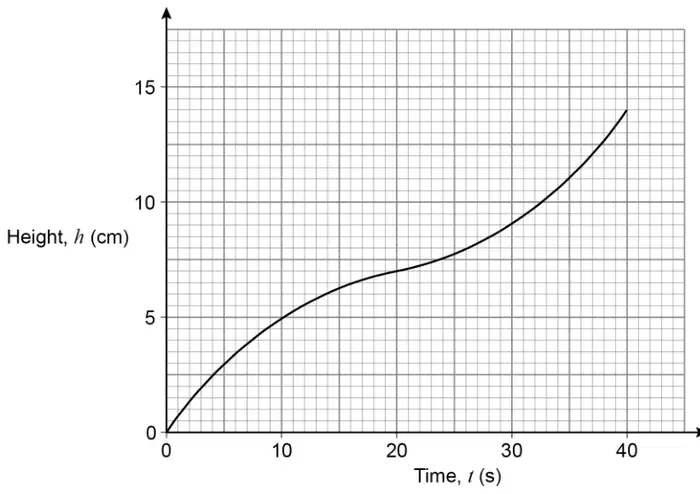
21 Water flows from a tap at a constant rate.
A container is filled with water from the tap in 40 seconds.
The graph shows the height, \(h\) centimetres, of the water after time, \(t\) seconds.
(a) The container is one of these shapes.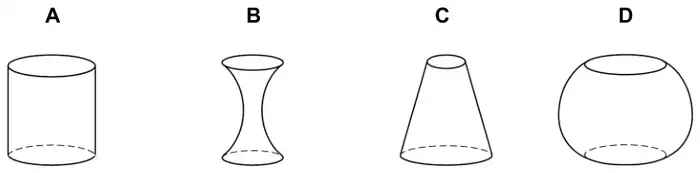
Circle the letter of the correct shape. [1 mark]
(b) By drawing a tangent on the graph, estimate the rate at which the height is increasing when \(\;t = 10\) [2 marks]
| Answer | Mark | Comments |
|---|---|---|
| D | B1 |
| Answer | Mark | Comments |
|---|---|---|
| Draws tangent at \(t = 10\) | M1 | |
| [0.3, 0.4] | A1 |
Additional guidance
| For drawing of tangent mark intention | |
| No tangent drawn | M0A0 |