
Higher November 2023 Paper 2 Q23
23 Here is the velocity-time graph of a cyclist for 40 seconds.
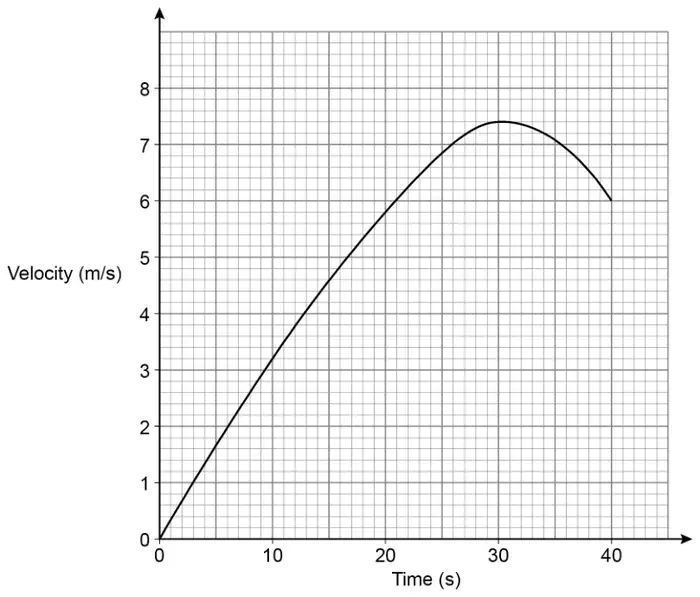
(a) By dividing the area under the graph into four sections of equal widths, estimate the distance travelled during the 40 seconds. [3 marks]
(b) Work out the average acceleration of the cyclist during the 40 seconds.
State the units of your answer. [2 marks]
| Answer | Mark | Comments |
|---|---|---|
| \(\dfrac{1}{2} \times 10 \times 3.2\) or 16 or \(\dfrac{1}{2} \times (3.2 + 5.8) \times 10\) or 45 or \(\dfrac{1}{2} \times (5.8 + 7.4) \times 10\) or 66 or \(\dfrac{1}{2} \times (7.4 + 6) \times 10\) or 67 | M1 | oe eg \(3.2 \times 10 + \dfrac{1}{2} \times (5.8 - 3.2) \times 10\) |
| At least three of \(\dfrac{1}{2} \times 10 \times 3.2\) or 16 and \(\dfrac{1}{2} \times (3.2 + 5.8) \times 10\) or 45 and \(\dfrac{1}{2} \times (5.8 + 7.4) \times 10\) or 66 and \(\dfrac{1}{2} \times (7.4 + 6) \times 10\) or 67 | M1dep | oe M2 \(\dfrac{1}{2} \times 10\,\{0 + 6 + 2(3.2 + 5.8 + 7.4)\}\) oe |
| 194 | A1 |
Additional guidance
| The first M1 may be awarded for correct work with no answer or incorrect answer, even if this is seen amongst multiple attempts | |
| Values may be seen on the diagram | |
| Answer 194 and extra strips used | M1M1A1 |
| Answer | Mark | Comments |
|---|---|---|
| \(\dfrac{6}{40}\) or \(\dfrac{3}{20}\) or 0.15 | B1 | |
| m/s\(^2\) or m/s/s or ms\(^{-2}\) | B1 | oe eg metres per second per second |
Additional guidance
Ignore incorrect simplification or conversion after correct answer seen