
Higher November 2022 Paper 2 Q26
26 Helena ran an 800-metre race in 140 seconds.
The speed-time graph represents the first 100 seconds of her run.
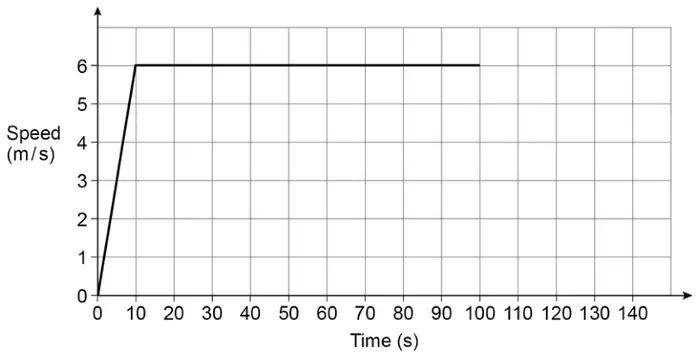
Helena ran the last 40 seconds with constant deceleration.
Work out her speed as she finished the race. [4 marks]
| Answer | Mark | Comments |
|---|---|---|
| \(6 \times 10 \div 2\) or 30 or \(6 \times 90\) or 540 or 570 | M1 | oe eg \(\dfrac{1}{2} \times \dfrac{6}{10} \times 10^2\) or \(\dfrac{1}{2} \times (100 + 90) \times 6\) may be on diagram |
| \(800 - 6 \times 10 \div 2 - 6 \times 90\) or \(800 -\) their \(30 -\) their 540 or \(800 -\) their 570 or 230 | M1dep | oe full method for remaining distance may be on diagram may be embedded eg \(230 \div 40\) |
| \(\dfrac{1}{2} \times (v + 6) \times 40 =\) their 230 \(2 \times\) their \(230 \div 40 - 6\) | M1dep | oe eg \(20v + 120 =\) their 230 any letter |
| 5.5 | A1 | oe value |
Additional guidance
Up to M2 may be awarded for correct work with no answer, or incorrect answer, even if this is seen amongst multiple attempts