
Higher June 2017 Paper 3 Q18
18 Nick sketches the graph of \(\quad y = 0.5^x \quad\) for \(\;x \geqslant 0\)
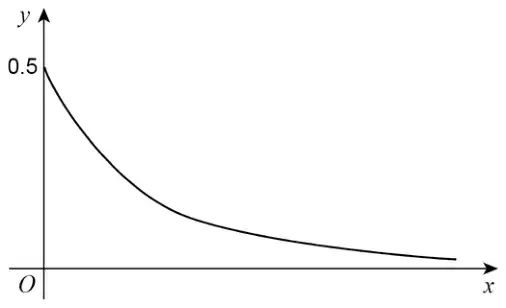
Make one criticism of his sketch. [1 mark]
| Answer | Mark | Comments |
|---|---|---|
| Valid criticism | B1 | eg (\(y =\)) 0.5 should be (\(y =\)) 1 \(y = 0.5\) should be when \(x = 1\) When \(x = 0 \;\; y = 1\) 0.5 is incorrect Crosses \(y\) axis in wrong place Graph should start at 1 \(0.5^0 = 1\) |
Additional guidance
| Do not accept statements which are contradictory | |
| He does not have a scale on the \(x\) axis | B0 |
| It does not pass through zero | B0 |
| The line should meet the \(x\) axis | B0 |