
Higher June 2025 Paper 1 Q12
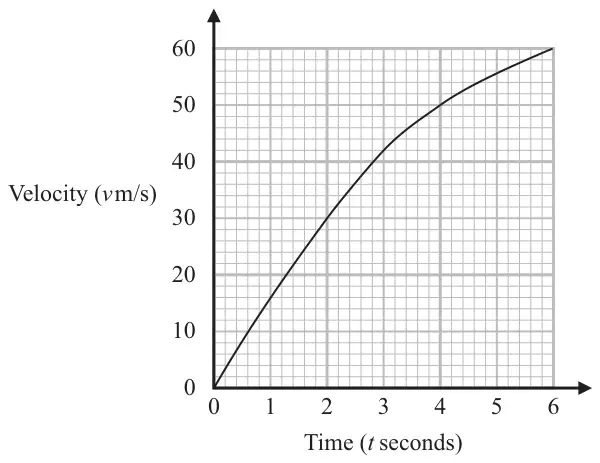
12 The graph shows the velocity, \(v\) m/s, of a particle \(t\) seconds after it starts to move.
(a)
(i) Work out an estimate of the gradient of the graph at \(t = 3\)
You must show how you get your answer. (3)
You must show how you get your answer. (3)
(ii) What does this gradient represent? (1)
(b) Work out an estimate for the distance the particle travelled in the first 6 seconds.
Use 3 strips of equal width. (3)
Use 3 strips of equal width. (3)
| Answer | Mark | Mark scheme |
|---|---|---|
| (i) 10 | M1 | for a tangent drawn at \(t = 3\) |
| M1 | for a complete method to find the gradient from tangent, eg \(\dfrac{30}{3}\) | |
| A1 | for answer in the range 8.5 to 11.5 or ft acceptable tangent at \(t = 3\) | |
| (ii) Acceleration or rate of change of velocity | C1 | for a correct explanation Acceptable examples acceleration rate of change of velocity increase in velocity each second how quickly the velocity increases increase in velocity over time the rate at which the particle is accelerating Not acceptable examples rate of change increase in velocity the velocity per second velocity ÷ time as time increases so does the velocity how steep the line is the acceleration of the particle and how far it got |
Additional guidance
(i) A tangent must be seen to award any marks
This mark can be awarded if the tangent is drawn at \(t \neq 3\)
Accept answers in the form \(\dfrac{a}{b}\) where \(a\) and \(b\) are integers
Award 0 marks for a correct answer (in the range) with no (or incorrect) supportive working
(ii) Award if extra information is given provided not contradictory or incorrect
Accept ‘speed’ for ‘velocity’
| Answer | Mark | Mark scheme |
|---|---|---|
| 220 | M1 | for a method to find an appropriate area, eg \(\dfrac{1}{2} \times 30 \times 2\ (= 30)\) oe or \(\dfrac{1}{2}(30 + 50) \times (4 - 2)\ (= 80)\) oe or \(\dfrac{1}{2} \times (50 + 60) \times (6 - 4)\ (= 110)\) oe or for a method to find an estimate for the area of at least one rectangle with height at intersection of midpoint and curve, eg \(2 \times 16\ (= 32)\) oe or \(2 \times 42\ (= 84)\) oe or \(2 \times 56\ (= 112)\) oe |
| M1 | for a complete method, eg \(\dfrac{1}{2} \times 30 \times 2 + \dfrac{1}{2}(30 + 50) \times 2 + \dfrac{1}{2}(50 + 60) \times 2\) or \(\dfrac{1}{2} \times 2 \times (0 + 60 + 2(30 + 50))\) or \(2 \times 16 + 2 \times 42 + 2 \times 56\) | |
| A1 | for 220 or 228 |
Additional guidance
Must have one correct expression for the award of this mark
May be seen as a rectangle added to a triangle
Allow 1 error in \(v\) values used
Allow 228 only if it comes from rectangle/midpoint method