
Foundation November 2022 Paper 2 Q12
12 Here is the distance-time graph for a car between 1 pm and 3 pm
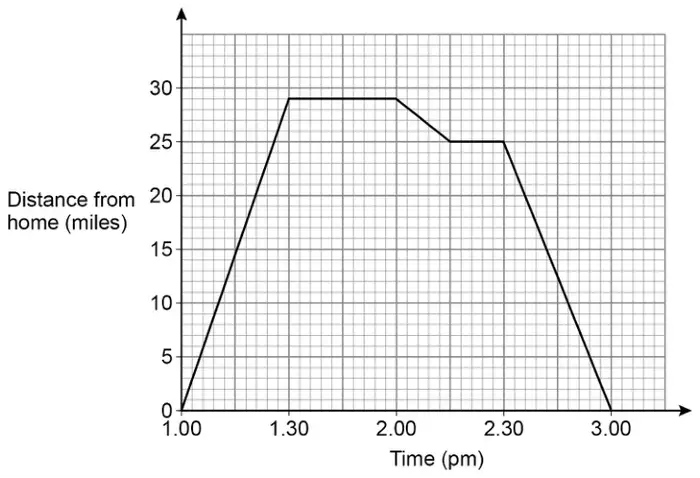
(a) Work out the total time that the car is not moving between 1 pm and 3 pm
State the units of your answer. [2 marks]
(b) Work out the total distance the car travels between 1 pm and 3 pm [2 marks]
| Answer | Mark | Comments |
|---|---|---|
| 30 or \(\dfrac{1}{2}\) and 15 or \(\dfrac{1}{4}\) or 45 or \(\dfrac{3}{4}\) | M1 | oe allow no units or incorrect units may be on graph |
| 45 minutes or \(\dfrac{3}{4}\) hour | A1 | oe |
Additional guidance
| Allow abbreviated units eg 45 min(s) eg condone 45 m eg \(\dfrac{3}{4}\) h | M1A1 M1A1 M1A1 |
| 45 minutes in working with answer 45 | M1A1 |
| \(\dfrac{3}{4}\) hour in working with answer \(\dfrac{3}{4}\) | M1A1 |
| \(0.3 + 0.15\) is M0 unless recovered to 45 |
| Answer | Mark | Comments |
|---|---|---|
| 29 or \(4 + 25\) | M1 | oe may be embedded 29 may be on graph eg on \(y\)-axis |
| 58 | A1 | SC1 54 |
Additional guidance
| \(29 \times 2\) with no or incorrect evaluation | M1A0 |
| Allow the first mark embedded in a calculation eg \(29 + 4\) or \(29 + 5 + 25\) or \(29 + 29 + 25 + 25\) or \(29 - 25\) | M1A0 |