
Higher June 2018 Paper 3 Q15
15 The graph shows the speed of a car, in metres per second, during the first 20 seconds of a journey.
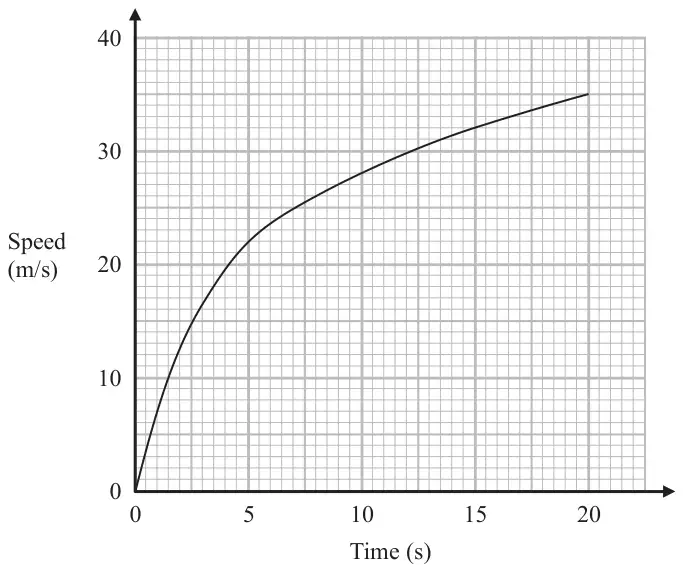
(a) Work out an estimate for the distance the car travelled in the first 20 seconds.
Use 4 strips of equal width. (3)
Use 4 strips of equal width. (3)
(b) Is your answer to part (a) an underestimate or an overestimate of the actual distance the car travelled in the first 20 seconds?
Give a reason for your answer. (1)
Give a reason for your answer. (1)
| Answer | Mark | Mark scheme |
|---|---|---|
| 488 to 507 | M1 | for method to find area of one strip using trapezia, eg \(\frac{1}{2} \times 5 \times 22\) (= 55) or \(\frac{1}{2} \times 5 \times (22 + 28)\) (= 125) or \(\frac{1}{2} \times 5 \times (28 + 32)\) (= 150) or \(\frac{1}{2} \times 5 \times (32 + 35)\) (= 167.5) OR for a method to find an estimate for the area using rectangles eg \(5 \times 22\) or \(5 \times 28\) or \(5 \times 32\) or \(5 \times 35\) |
| M1 | for complete and correct method to find the area using four strips, eg \(\frac{1}{2} \times 5 \times 22 + \frac{1}{2} \times 5 \times (22 + 28) + \frac{1}{2} \times 5 \times (28 + 32) + \frac{1}{2} \times 5 \times (32 + 35)\) or \(5 \times 22 + 5 \times 28 + 5 \times 32 + 5 \times 35\) | |
| A1 | for answer in the range 488 to 507 (SC B1 for using area under the curve) |
Additional guidance
May use area of triangle + area of rectangle for the second, third and fourth strips – lengths must be correct.
May use triangle for first strip, \(\frac{1}{2} \times 5 \times 22\)
May use triangle for first strip, \(\frac{1}{2} \times 5 \times 22\)
| Answer | Mark | Mark scheme |
|---|---|---|
| Underestimate (supported) | C1 | (dep M1) for underestimate since parts not included below the graph OR ft their method |