
Higher November 2017 Paper 2 Q10
10 Here is part of a distance-time graph for a car’s journey.
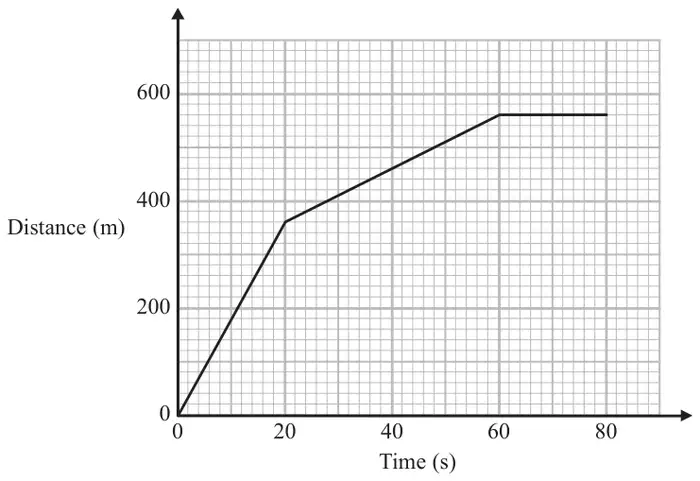
(a) Between which two times does the car travel at its greatest speed?
Give a reason for your answer. (2)
Give a reason for your answer. (2)
(b) Work out this greatest speed. (1)
| Answer | Mark | Notes |
|---|---|---|
| 0 to 20 seconds with reason | B1 | for between 0 seconds and 20 seconds |
| C1 | for reason given eg gradient is greatest oe |
| Answer | Mark | Notes |
|---|---|---|
| 18 | B1 | ft from (a) |