
Higher June 2017 Paper 3 Q24
24 A ball is thrown from a point 6 metres above the ground.
The graph shows the height of the ball above the ground, in metres.
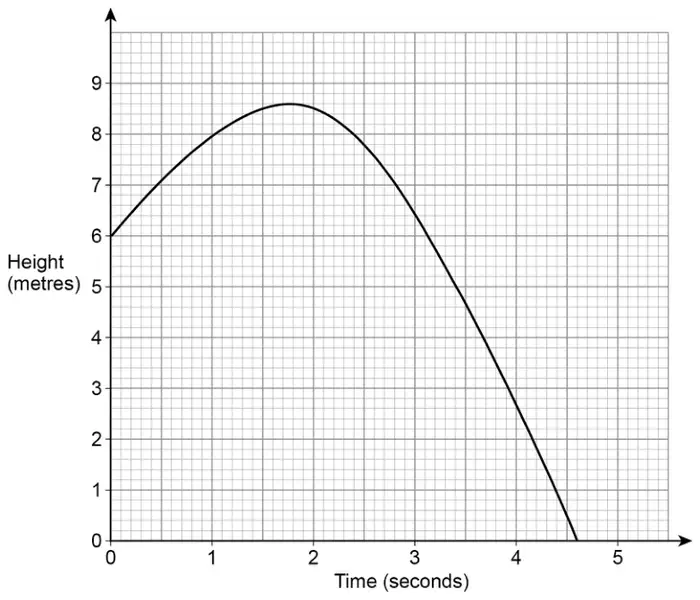
Estimate the speed of the ball, in m/s, after 1 second.
You must show your working. [2 marks]
| Answer | Mark | Comments |
|---|---|---|
| Draws a tangent at 1 second | M1 | |
| Their gradient at 1 second | A1ft | Must see a tangent on the graph ft their tangent \(\pm 0.2\) tolerance on vertical reading \(\pm 0.1\) tolerance on horizontal reading |