
Higher November 2021 Paper 2 Q19
19 The graph shows the height above ground of a toy rocket for 10 seconds.
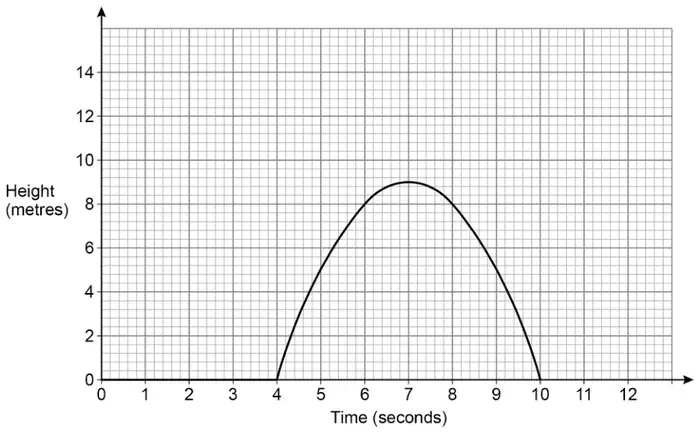
(a) For how long is the rocket in the air?
Circle your answer. [1 mark]
- 10 seconds
- 9 seconds
- 6 seconds
- 4 seconds
(b) Using the graph, estimate the speed of the rocket after 6 seconds.
State the units of your answer. [3 marks]
| Answer | Mark | Comments |
|---|---|---|
| 6 seconds | B1 |
| Answer | Mark | Comments |
|---|---|---|
| Correct tangent drawn at 6 seconds | B1 | |
| Correct gradient for their tangent | B1ft | ft their tangent, which must be an increasing straight line |
| m/s | B1 | oe eg metres per second or mps |
Additional guidance
If no tangent is drawn the maximum mark possible is B0B0B1
Allow the units to be given in working lines if no units on the answer line