
Higher November 2017 Paper 3 Q25
25 Liquid is leaking out of a container.
The graph shows the depth of the liquid for 60 seconds.
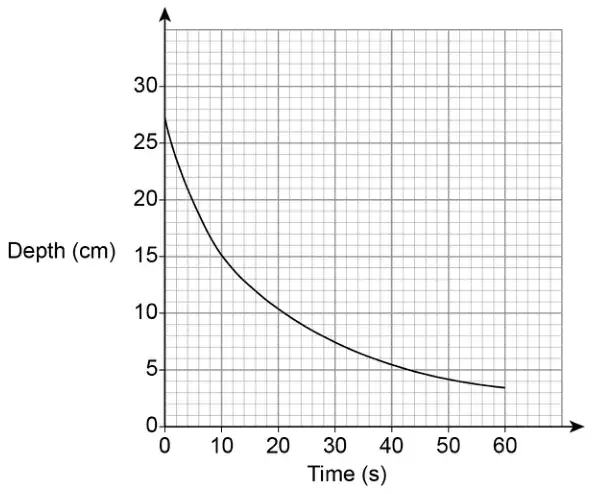
Use the graph to work out an estimate of the rate of decrease of depth at 10 seconds.
You must show your working. [3 marks]
| Answer | Mark | Comments |
|---|---|---|
| Attempt to draw a tangent | M1 | |
| Attempt at slope of a tangent drawn at (10, 15) | M1dep | tolerance \(\pm \frac{1}{2}\) square Must be an attempt at change in \(y\) divided by change in \(x\) Accept positive or negative |
| [0.6, 0.8] from tangent drawn at (10, 15) | A1ft | Condone −[0.6, 0.8] from tangent drawn at (10, 15) ft from their tangent drawn at (10, 15) |
Additional guidance
| Tangent drawn at incorrect point | M1M0A0 |
| No tangent | M0 |
| Tangent drawn at (10, 15) \(10 \div 15 = 0.6\) | M1 M0 A0 |
| Misread of scale for tangent drawn at (10, 15) could score M1M1 |