
Higher November 2024 Paper 3 Q22
22 Here is a velocity-time graph for an aeroplane.
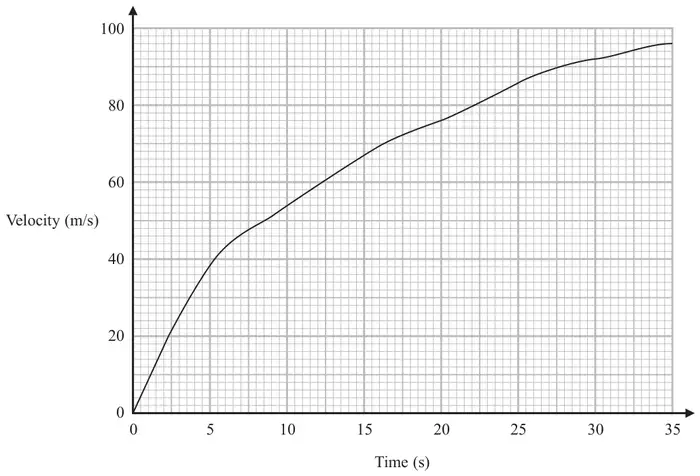
Work out an estimate for the distance the aeroplane travelled in the first 30 seconds.
Use 3 strips of equal width. (3)
| Answer | Mark | Mark scheme |
|---|---|---|
| 1760 | M1 | for starting to find the area under the curve, eg \(0.5 \times 10 \times \mathbf{54}\ (= 270)\) oe or \(0.5 \times 10 \times (\mathbf{54} + \mathbf{76})\ (= 650)\) oe or \(0.5 \times 10 \times (\mathbf{76} + \mathbf{92})\ (= 840)\) or for a method to find an estimate for the area of at least 1 strip with heights at intersection of midpoint and curve eg \(10 \times [\mathbf{39}]\) oe or \(10 \times [\mathbf{67}]\) oe or \(10 \times [\mathbf{86}]\) oe |
| M1 | for a complete method to find the area under the curve, eg \(0.5 \times 10 \times 54 + 0.5 \times 10 \times (54 + 76) + 0.5 \times 10 \times (76 + 92)\) oe eg \(0.5 \times 10\,(92 + 2(54 + 76))\) or \(10 \times [39] + 10 \times [67] + 10 \times [86]\) oe | |
| A1 | for 1760 or 1890 to 1950 SCB2 for an answer in the range 1815 – 1855 |
Additional guidance
Must have one correct expression for the award of this mark
May be seen as a rectangle added to a triangle
Where \(38 \leqslant [39] \leqslant 40\)
Where \(66 \leqslant [67] \leqslant 68\)
Where \(85 \leqslant [86] \leqslant 87\)
Allow 1 error in \(y\) values used
Allow 1890 to 1950 only if it comes from midpoint method