
Higher June 2025 Paper 6 Q20
20 A container takes 8 minutes to be filled with water.
The graph shows the rate of flow, in litres per minute, of the water into the container during the 8 minutes.
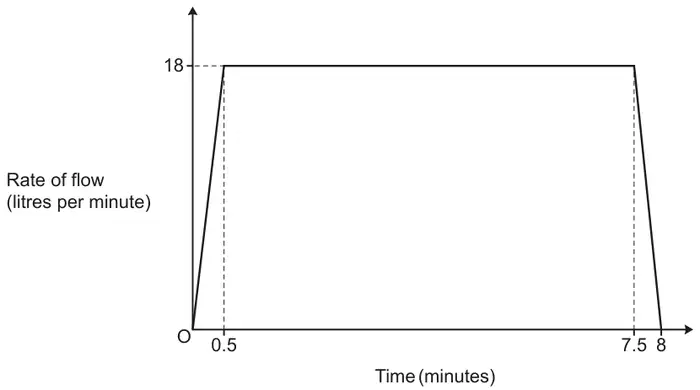
Not to scale
(a) Show that 126 litres of water flows into the container between 0.5 minutes and 7.5 minutes. [1]
(b) Work out the average rate of flow, in litres per minute, of water into the container during the 8 minutes. [4]
| Answer | Marks | Part marks and guidance | |
|---|---|---|---|
| 18 × (7.5 – 0.5) or 18 × 7 | 1 | 126/18 = 7 only scores if 7 is related to the context 126/7 = 18 only scores if 18 is related to the context | |
| Answer | Marks | Part marks and guidance | |
|---|---|---|---|
| 16.87[5] or 16.88 or 16.9 oe | 4 | M3 for \(\frac{126 + 2 \times \frac{1}{2} \times 0.5 \times 18}{8}\) oe or M2 for \(126 + 2 \times \frac{1}{2} \times 0.5 \times 18\) oe may be implied by 135 or M1 for \([2\ \times]\ \frac{1}{2} \times 0.5 \times 18\) oe may be implied by 4.5 for one triangle or 9 for two triangles If 0 scored, SC1 for \(\frac{126 + 2 \times 9}{8}\) or \(\frac{126 + 18}{8}\) | e.g. \(\frac{\frac{1}{2} \times (7 + 8) \times 18}{8}\) e.g. \(\frac{1}{2} \times (7 + 8) \times 18\) or \(18 \times 8 - 2 \times \frac{1}{2} \times 0.5 \times 18\) |