
Foundation November 2017 Paper 1 Q13
13 This graph shows part of Lucy’s car journey from London to Sheffield.
The car made one stop at a service station.
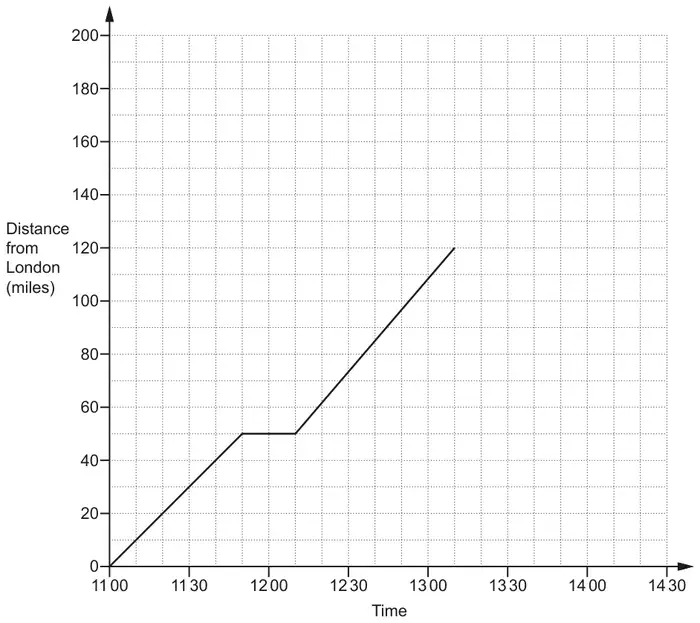
Use the graph to answer these questions.
(a) For how long did the car stop at the service station? [1]
(b) Work out the average speed of the car, in miles per hour, between London and the service station. [2]
(c) Sheffield is 180 miles from London.
Lucy arrived in Sheffield at 14 20.
Lucy arrived in Sheffield at 14 20.
Complete the graph. [2]
| Answer | Marks | Part marks and guidance | |
|---|---|---|---|
| 20 | 1 | ||
| Answer | Marks | Part marks and guidance | |
|---|---|---|---|
| 60 | 2 | M1 for 50 miles in 50 min oe \(\dfrac{50}{50}\) [\(\times\) 60] | |
| Answer | Marks | Part marks and guidance | |
|---|---|---|---|
| Line from (13 10, 120) to (14 20, 180) | 2 | B1 for line from (13 10, 120) B1 for line to (14 20, 180) | Extra stop allowed A non-decreasing curve is OK |