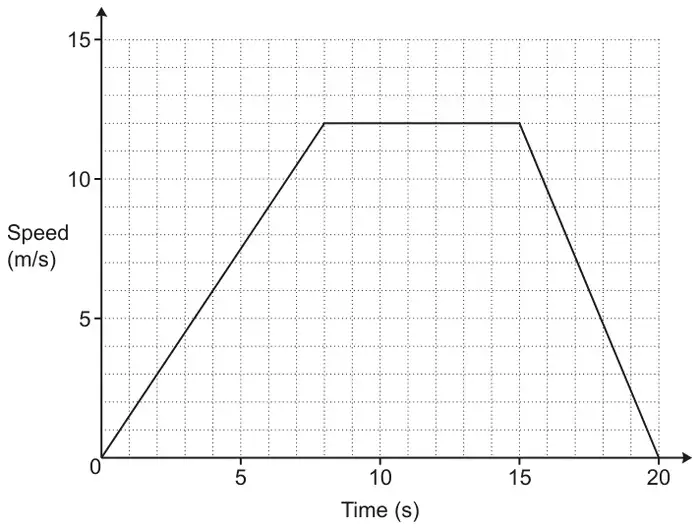
(a) The graph shows the speed of an object during the first 20 seconds of its motion.
Calculate the distance travelled by the object during the 20 seconds. [3]
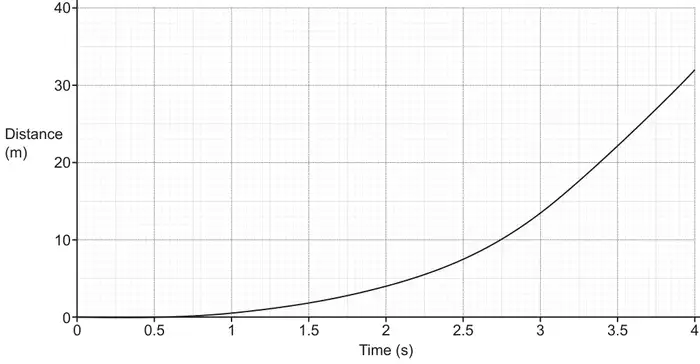
(b) The graph shows the distance travelled by an object during the first 4 seconds of its motion.
(i) Work out the average speed of this object between 2 and 4 seconds. [2]
(ii) Use the graph to estimate the speed of this object at 3 seconds. You must show working to support your estimate. [3]
(iii) What happens to the speed of this object during these 4 seconds of motion. Explain how you know. [1]
Mark scheme (a)
Answer
Marks
Part marks and guidance
162
3
M2 for \(\frac{1}{2} \times (\textit{their}7 + 20) \times \textit{their}12\) oe or M1 for one relevant area e.g. \(\frac{1}{2} \times \textit{their}8 \times \textit{their}12\) or their7 × their12 or \(\frac{1}{2} \times \textit{their}5 \times \textit{their}12\)
e.g. M2 for \(\frac{1}{2} \times \textit{their}8 \times \textit{their}12 + \textit{their}7 \times \textit{their}12 + \frac{1}{2} \times \textit{their}5 \times \textit{their}12\) implied by 48 + 84 + 30
alternative method : M2 for \(\textit{their}12 \times 20 - \frac{1}{2} \times \textit{their}8 \times \textit{their}12 - \frac{1}{2} \times \textit{their}5 \times \textit{their}12\) or M1 for one relevant area e.g. their12 × 20 or \(\frac{1}{2} \times \textit{their}8 \times \textit{their}12\) or \(\frac{1}{2} \times \textit{their}5 \times \textit{their}12\)
implied by 240 – 48 – 30
Mark scheme (b)
Answer
Marks
Part marks and guidance
(i) 14
2
M1 for \(\frac{\textit{their}32 - \textit{their}4}{4 - 2}\) oe
Allow any two points on the line joining (2,4) and (4,32)
(ii) Ruled tangent drawn at 3 seconds
B1
Tangent – mark intention to touch the curve at 3 seconds(condone thin daylight at 3), ignore other lines, condone dotty/dashed and condone line on one side only. If tangent is ruled and their value is outside the range apply FT to their tangent use accuracy of 2 sf
14.0 – 16.0
B2dep
B2 dep on B1 correct or FT or M1 for rise ÷ run with values substituted
(iii) [the speed] increases oe [because] the gradient is steeper/greater oe
1
Accept any correct response, accept accelerates for increase, see appendix
Appendix: exemplar responses for Q18(b)(iii)
Response
Mark
Increases and gradient is steeper/greater
1
Accelerates as curve is getting steeper
1
Increases as the distance per second increases
1
Increases as the distance travelled in the same time increases