
Higher November 2024 Paper 6 Q19
19 This graph shows the depth of the water, in centimetres, at a particular point in a river over a period of 10 hours.
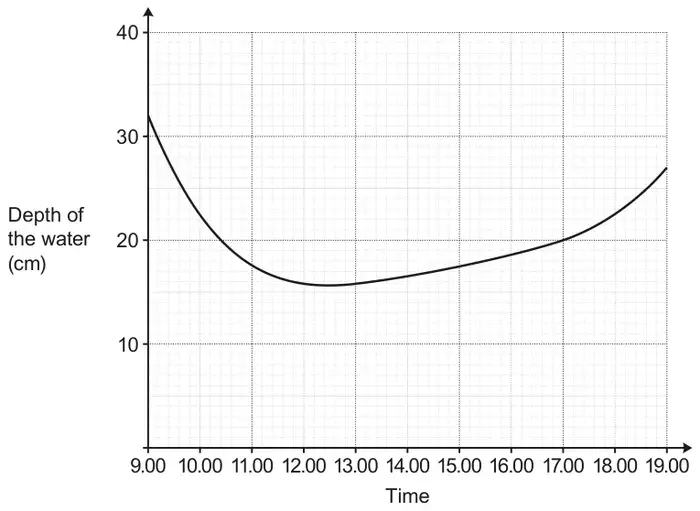
(a) Work out the average rate of change in the depth of the water over the 10 hours. [2]
(b) Use the graph to estimate the rate of change in the depth of the water at 17.00.
You must show working to support your estimate. [4]
You must show working to support your estimate. [4]
| Answer | Marks | Part marks and guidance | |
|---|---|---|---|
| −0.5 or +0.5 | 2 | M1 for \(\frac{27 - 32}{10}\) or \(\frac{32 - 27}{10}\) oe | For M1 condone one error in the figures |
| Answer | Marks | Part marks and guidance | |
|---|---|---|---|
| Tangent drawn at time 17.00 | 1 | Tangent should not cross the curve and should touch at 17.00. Condone slight daylight between tangent and curve. | |
| 1.6 to 2.0 nfww and dep on acceptable tangent drawn | 3 | M1 for using two points on their line M1 for use of \(\frac{\text{difference in } y}{\text{difference in } x}\) | |