June 2025 Paper 1 Q13
13 Here are four sketch graphs.
Circle the letter of the sketch graph that represents \(\quad y = 5^x\) [1 mark]
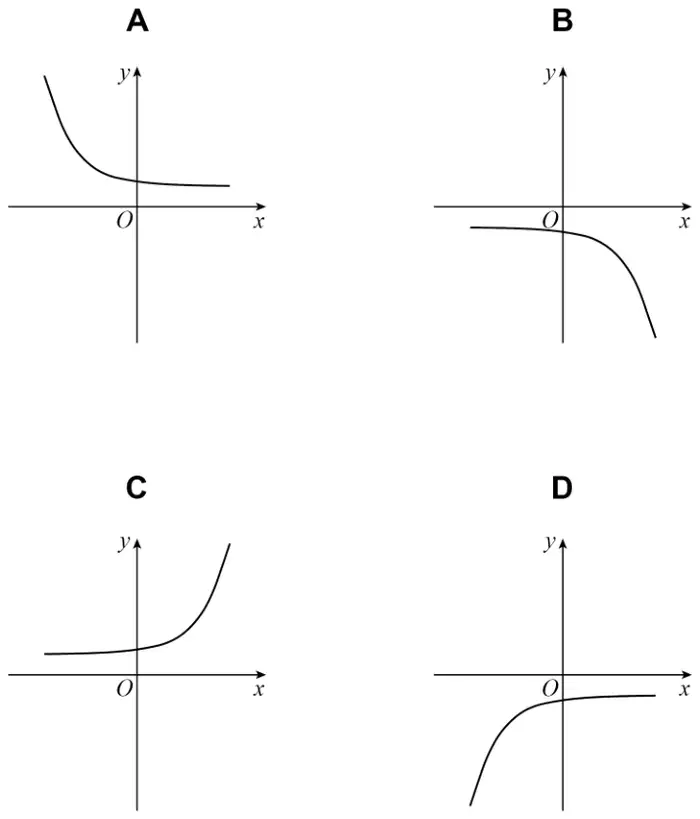
- A
- B
- C
- D
| Answer | Mark | Comments |
|---|---|---|
| C | B1 |

Understand it. Practise it. Enjoy it. All for free.
Course Support Current PowerPoint version
More questions on this topic: GCSE Algebra: Drawing & Using Graphs (331) IGCSE Algebra: Drawing & Using Graphs (144)
13 Here are four sketch graphs.
Circle the letter of the sketch graph that represents \(\quad y = 5^x\) [1 mark]
| Answer | Mark | Comments |
|---|---|---|
| C | B1 |
9
\[\begin{aligned} \mathrm{f}(x) &= x^2 + px & \qquad x &\leqslant 1 \\ &= 2p - \tfrac{1}{2}x & \qquad x &\gt 1 \end{aligned}\]A sketch of \(\quad y = \mathrm{f}(x) \quad\) is shown.
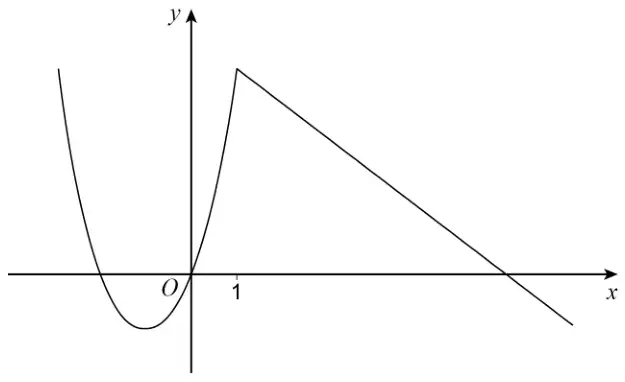
Work out the value of \(p\). [2 marks]
| Answer | Mark | Comments |
|---|---|---|
| \(1 + p = 2p - \dfrac{1}{2}\) | M1 | oe equation eg \(1^2 + p \times 1 = 2p - \dfrac{1}{2} \times 1\) |
| \(\dfrac{3}{2}\) or 1.5 | A1 | oe value eg \(1\dfrac{1}{2}\) |
5 Here is a sketch of \(\quad y = x^2 + bx + c\)
The graph passes through \((-1, 0)\) and \((5, 0)\)
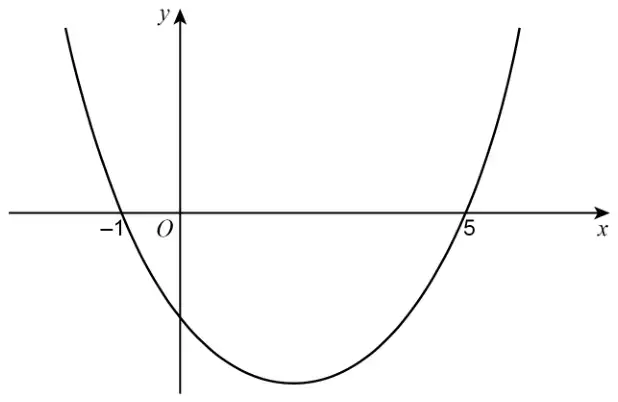
Work out the values of \(b\) and \(c\). [3 marks]
| Answer | Mark | Comments |
|---|---|---|
| Alternative method 1: by using the roots | ||
| \((x - -1)(x - 5)\) or \((x + 1)(x - 5)\) | M1 | |
| \(x^2 - 5x + x - 5\) or \(x^2 - 4x - 5\) or \(b = -4\) or \(c = -5\) with correct factors | M1dep | oe eg could be in a grid |
| \(b = -4,\ c = -5\) | A1 | |
| Alternative method 2: by substitution | ||
| \(0 = 1 - b + c\) and \(0 = 25 + 5b + c\) or \(1 - b + c = 25 + 5b + c\) | M1 | oe do not allow \(0 = (-1)^2 + (-1)b + c\) or \(0 = (5)^2 + (5)b + c\) until processed correctly |
| \(0 = 24 + 6b\) or \(0 = 30 + 6c\) | M1dep | oe eliminating either \(b\) or \(c\) |
| \(b = -4,\ c = -5\) | A1 | |
| Alternative method 3: by using the minimum from completing the square | ||
| \((x - 2)^2 + k\) or \(\left(x + \dfrac{b}{2}\right)^2 + k\) | M1 | oe \(k\) could be any letter or number or combination or 0 |
| \(0 = (3)^2 + k\) or \(k = -9\) or \(\dfrac{-b}{2} = 2\) | M1dep | oe by substituting in one pair of coordinates 3 could be \(-3\) or \(+3\) or \(\pm 3\) |
| \(b = -4,\ c = -5\) | A1 | |
| Alternative method 4: by using the minimum from differentiation | ||
| \(\dfrac{\mathrm{d}y}{\mathrm{d}x} = 2x + b\) | M1 | |
| \(2(2) + b = 0\) | M1dep | oe |
| \(b = -4,\ c = -5\) | A1 | |
| Up to M1 may be awarded for correct work with no answer or incorrect answer, even if this is seen amongst multiple attempts | |
| Both coefficients correct but no working | M2A1 |
| One coefficient correct and the other incorrect or missing and no working | M0A0 |
20 Here is the graph of \(\quad y = -x^2 + 3x + 6 \quad\) for \(\quad -2 \leqslant x \leqslant 5\)
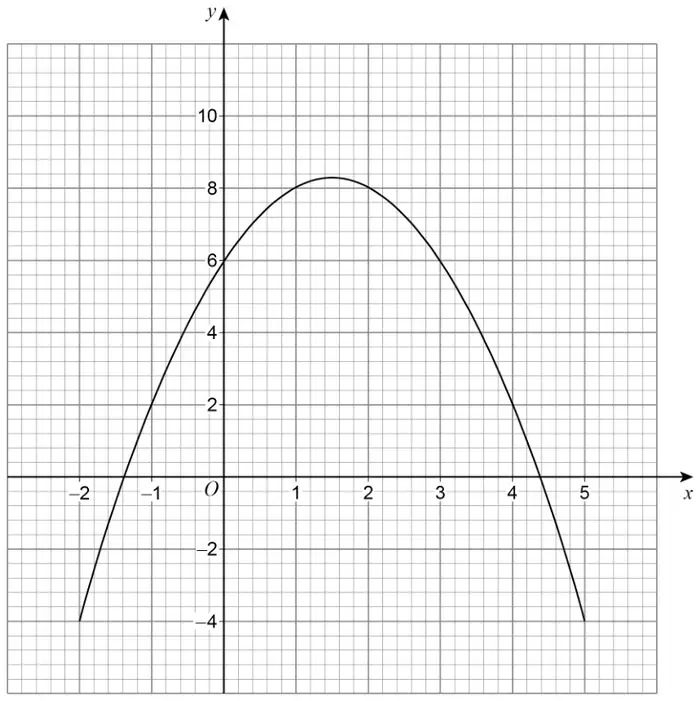
By drawing a suitable straight line, work out approximate solutions to
\[x^2 - \frac{7}{2}x - 3 = 0\][4 marks]
| Answer | Mark | Comments |
|---|---|---|
| \((y =)\ \dfrac{-x}{2} + 3\) | B2 | oe eg \(2y = -x + 6\) can be implied from correct line B1 for \((y =)\ \dfrac{x}{2} - 3\) can be implied from drawing this line or \(m = -\dfrac{1}{2}\) or \(c = +3\) not from incorrect working for either \(m\) or \(c\) |
| \(y = \dfrac{-x}{2} + 3\) accurately drawn on diagram | M1 | ft their stated linear function in \(x\) accuracy is half a square at \(x = 0\) and \(x = 4\) needs to be a straight line (mark intention) |
| \([-0.6, -0.8]\) and [4.1, 4.3] | A1 | dependent on B2M1 |
| Factorising by use of the quadratic formula alone | B0M0A0 |
| Ignore any y values for A1 | |
| Do not allow M mark for \(\dfrac{\mathrm{d}y}{\mathrm{d}x} =\) linear function drawn | |
| Graph of \(x^2 - \dfrac{7}{2}x - 3 = 0\) | B0M0A0 |
10 f is a cubic function.
The curve \(\quad y = \mathrm{f}(x) \quad\) has
a minimum point at \((a, 0)\)
and
a maximum point at \((1, b)\)
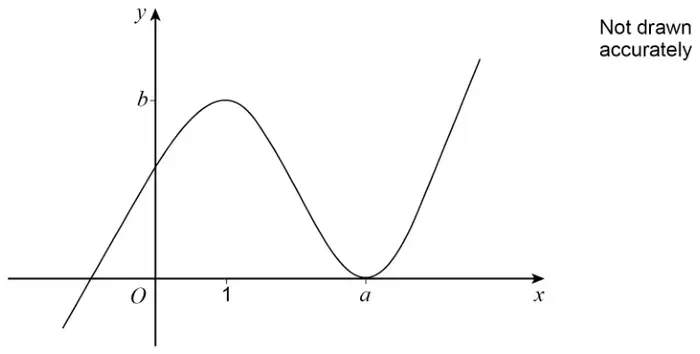
Tick one box for each statement. [2 marks]
| True | False | |
|---|---|---|
| The tangent to the curve at \((1, b)\) is parallel to the \(x\)-axis | ||
| There are three different values of \(x\) for which \(\quad y = 0\) | ||
| The function is increasing for \(\quad 0 \lt x \lt 1\) |
| Answer | Mark | Comments |
|---|---|---|
| True False True | B2 | B1 one or two correct |
| Any unambiguous indication eg only crosses in all three correct boxes | B2 |
| A tick and a cross in a row – mark the tick |
7 The equation of a curve is \(\quad y = 4 - (x - 3)^2\)
Circle the coordinates of the point where the curve crosses the \(y\)-axis. [1 mark]
| Answer | Mark | Comments |
|---|---|---|
| \((0, -5)\) | B1 |
| Answer | Mark | Comments |
|---|---|---|
| (3, 4) | B1 |
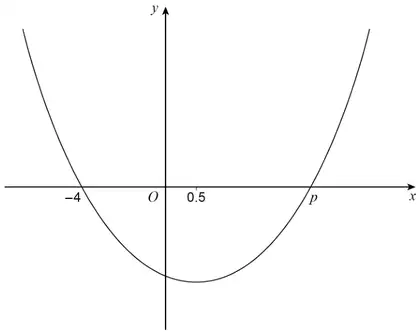
7 Here is a sketch of the curve \(\quad y = ax^2 + bx + c \quad\) where \(a\), \(b\) and \(c\) are constants.
The curve intersects the \(x\)-axis at \((-4, 0)\) and \((p, 0)\)
The turning point has \(x\)-coordinate 0.5
| Answer | Mark | Comments |
|---|---|---|
| 5 | B1 | condone (5, 0) but not (0, 5) |
| Condone 5 or (5, 0) next to \(p\) on sketch if answer line blank | B1 |
| Answer | Mark | Comments |
|---|---|---|
| Either of \(x \lt -4 \qquad x \gt \text{their } 5\) | M1 | oe eg \(-4 \gt x\) correct or ft their 5 in (a) their 5 in (a) must be greater than 0.5 condone \(\leqslant\) for \(\lt\) condone \(\geqslant\) for \(\gt\) |
| Both of \(x \lt -4 \qquad x \gt \text{their } 5\) | A1ft | correct or ft their 5 in (a) their 5 in (a) must be greater than 0.5 must be two separate inequalities |
| Ignore the use of or/and eg1 \(x \lt -4\) or \(x \gt 5\) eg2 \(x \lt -4\) and \(x \gt 5\) | M1A1 M1A1 |
| Condone embedded even if in an invalid statement for M1 but not A1 eg1 \(-4 \gt x \gt 5\) eg2 \(-4 \gt x \gt 6\) | M1A0 M1A0 |
| If answer to (a) is 4 \(x \lt -4 \qquad x \gt 4\) | M1A1ft |
| If answer to (a) is blank eg1 \(x \lt -4\) eg2 \(x \lt -4 \qquad x \gt 5\) | M1A0 M1A1 |
| \(-4 \lt x \lt 5\) | M0A0 |
| If answer to (a) is eg (0, 4) take their 5 to be 4 | |
| Condone eg \(x = \lt -4\) for M1 but not A1 | |
| Allow eg \((-\infty, -4)\) for \(x \lt -4\) (condone eg \([-\infty, -4)\) for M1 but not A1) |
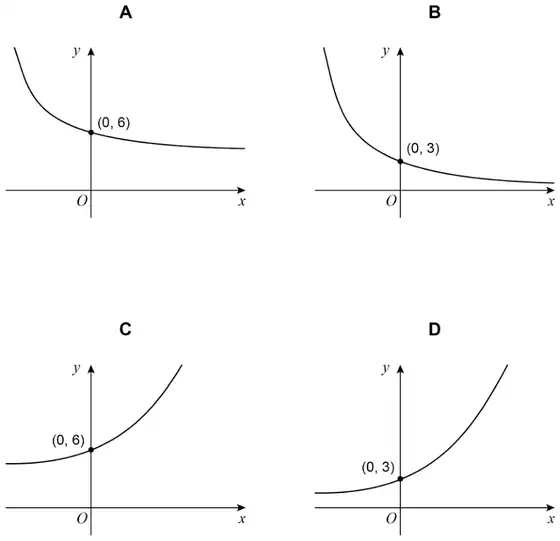
10 Here are four sketch graphs.
Circle the letter of the sketch graph that represents \(\quad y = 3 \times 2^x\) [1 mark]
| Answer | Mark | Comments |
|---|---|---|
| D | B1 |
3
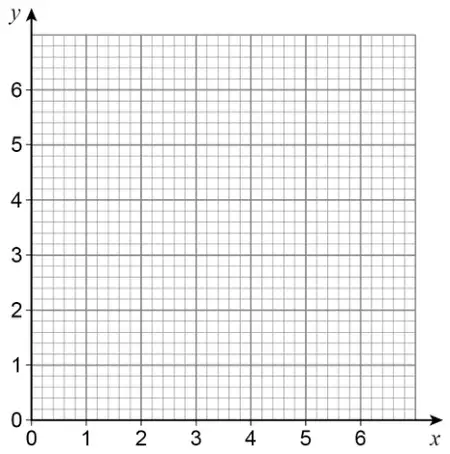
On the grid, draw the graph of \(\quad y = \mathrm{f}(x)\) [4 marks]
Work out \(\;\mathrm{g}^{-1}(x)\). [2 marks]
| Answer | Mark | Comments |
|---|---|---|
| Line joining (0,4) and (1,3) | B1 | may be drawn free hand |
| (2, 4) plotted as a maximum value | M1 | needs to be some sort of graph showing a maximum value |
| Curve drawn through (1, 3), (2, 4), (3, 3) and (4, 0) | A1 | all points should be within half a square horizontally or vertically |
| Line joining (4,0) and (6,4) | B1 | may be drawn free hand |
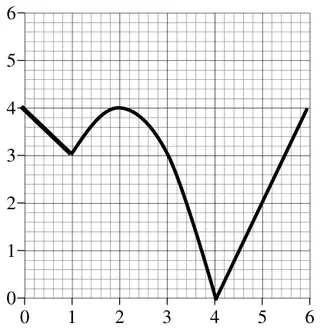 Maximum mark available if any part of the quadratic curve (it must be a quadratic curve that is concave and not convex at any point) is drawn with a ruler is B2M1 (a clear vertex at (3,3) may show the use of a ruler) Maximum mark available if any of the lines go beyond their correct domain by more than half a square is B2M1 or B1M1A1 They could lose marks for both the quadratic and straight lines Ignore slight feathering |
| Answer | Mark | Comments |
|---|---|---|
| Alternative method 1 | ||
| Rearranging first to get \(x = \dfrac{6 - \mathrm{g}(x)}{3}\) | M1 | oe eg \(x = \dfrac{6 - y}{3}\) or \(2 - \dfrac{y}{3}\) \(y - 6 = -3x\) is not enough to gain M1 |
| \(\mathrm{g}^{-1}(x) = \dfrac{6 - x}{3}\) | A1 | oe eg \(\mathrm{g}^{-1}(x) = \dfrac{x - 6}{-3}\) or \(\mathrm{g}^{-1}(x) = -\dfrac{x - 6}{3}\) or \(\mathrm{g}^{-1}(x) = \dfrac{x}{-3} + 2\) |
| Alternative method 2 | ||
| Putting the correct terminology in to get \(\;x = 6 - 3\mathrm{g}^{-1}(x)\) | M1 | oe eg \(x = 6 - 3y\) or \(3y = 6 - x\) |
| \(\mathrm{g}^{-1}(x) = \dfrac{6 - x}{3}\) | A1 | oe eg \(\mathrm{g}^{-1}(x) = \dfrac{x - 6}{-3}\) or \(\mathrm{g}^{-1}(x) = -\dfrac{x - 6}{3}\) or \(\mathrm{g}^{-1}(x) = \dfrac{x}{-3} + 2\) |
| Answer left as \(y = \dfrac{6 - x}{3}\) should gain M1 on either scheme | M1A0 |
| \(x = \dfrac{6 - y}{3}\) can gain M1 but not A1 | M1A0 |
| Condone \(\mathrm{g}^{-1}(x)\) missed on answer line (as long as nothing else is written in its place) Flow charts may be used. Mark as oe Penalise additional incorrect working |
19 \(y = \mathrm{f}(x) \quad\) is the graph of a cubic function.
\(y \lt 0 \quad\) for \(\quad x \lt 5\)
\(y \geqslant 0 \quad\) for \(\quad x \geqslant 5\)
The function is
increasing for \(\quad x \lt -1\)
decreasing for \(\quad -1 \lt x \lt 2\)
increasing for \(\quad x \gt 2\)
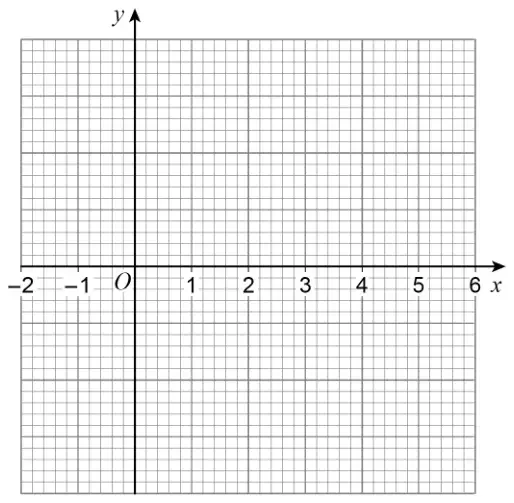
Draw a possible sketch of \(\quad y = \mathrm{f}(x) \quad\) for values of \(x\) from \(-2\) to 6 [4 marks]
| Answer | Mark | Comments |
|---|---|---|
| Cubic curve from \(x = -2\) to \(x = 6\) and maximum point at \((-1, a)\) where \(a\) is negative and minimum point at \((2, b)\) where \(b\) is less than \(a\) and increasing through (5, 0) | B4 | B3 curve from \(x = -2\) to \(x = 6\) and maximum point at \((-1, c)\) where \(c\) is any value and minimum point at \((2, d)\) where \(d\) is less than \(c\) and \(d\) is negative and increasing through (5, 0) or a B4 response apart from cubic curve not drawn from \(x = -2\) to \(x = 6\) B2 curve with maximum point at \((-1, e)\) where \(e\) is any value and minimum point at \((2, f)\) where \(f\) is less than \(e\) B1 curve with maximum point at \((-1, g)\) where \(g\) is negative or curve with minimum point at \((2, h)\) where \(h\) is negative or curve increasing through (5, 0) SC2 max and min correct and increasing through (5, 0) but with straight lines rather than a curve. |
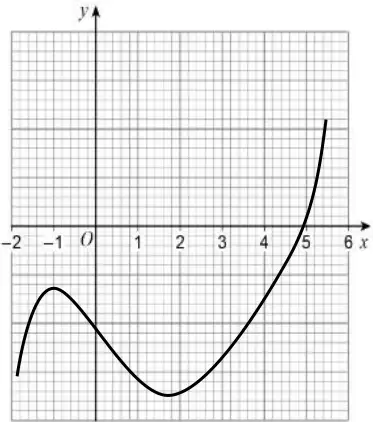 | B4 |
17 Here is the graph of \(\quad y = x^2 - 6x + 5 \quad\) for values of \(x\) between 0 and 6
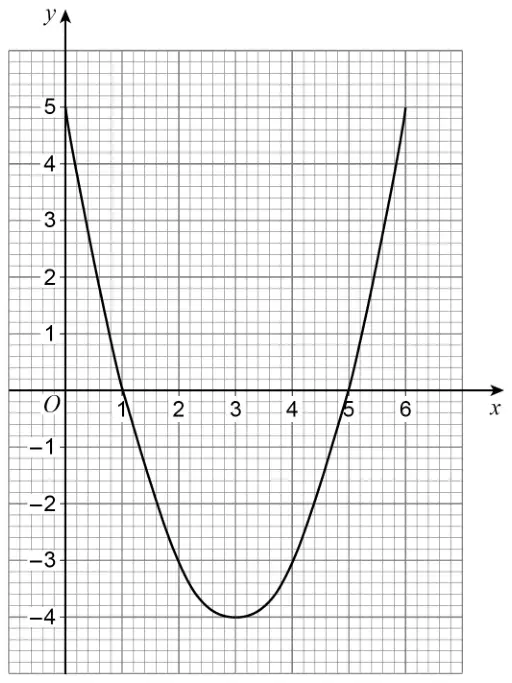
By drawing a suitable linear graph on the grid, work out approximate solutions to
\[x^2 - 7x + 9 = 0\][3 marks]
| Answer | Mark | Comments |
|---|---|---|
| \(x - 4\) or \(4 - x\) seen in working | M1 | from a subtraction of the quadratic and linear |
| \(y = x - 4\) drawn | A1 | |
| 5.3 and 1.7 and \(y = x - 4\) drawn | A1 | Allow [5.2, 5.4] and [1.6, 1.8] |
| Solutions with correct graph not seen eg from formula Solutions from quadratic graph drawn | M0A0A0 M0A0A0 |
13 Here is a sketch of \(\quad y = k^x \quad\) where \(\quad k \gt 0\)
\(A\left(2,\ 3\frac{1}{16}\right)\) is a point on the curve.
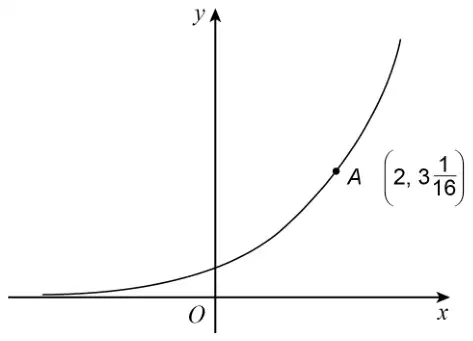
Not drawn accurately
Work out the \(y\)-coordinate of \(B\). [1 mark]
| Answer | Mark | Comments |
|---|---|---|
| \(k^2 = \dfrac{49}{16}\) or \(k = \sqrt{\dfrac{49}{16}}\) | M1 | oe |
| \(\dfrac{7}{4}\) | A1 | oe |
| \(-\dfrac{7}{4}\) or \(\pm\dfrac{7}{4}\) will not gain the A mark unless recovered | M1A0 |
| Answer | Mark | Comments |
|---|---|---|
| \(\dfrac{4}{7}\) | B1ft | oe allow decimal rounded to 2dp or better ft their (a) but not if \(k = 0\) or 1 |
| \(\dfrac{1}{\frac{4}{7}}\) | B0 |
8 A function f is given by
\[\begin{aligned} \mathrm{f}(x) &= 4x && x \lt 0 \\ &= x^2 - 8x && 0 \leqslant x \leqslant 8 \\ &= 16 - 2x && x \gt 8 \end{aligned}\]A sketch of \(\quad y = \mathrm{f}(x) \quad\) is shown.
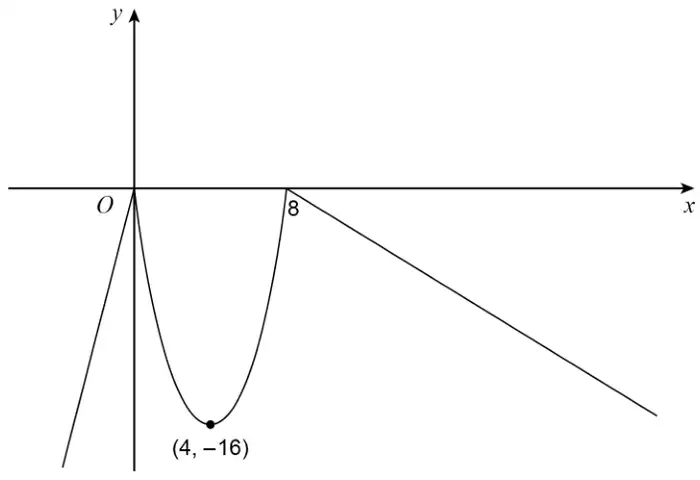
Not drawn accurately
Work out all the values of \(x\) for which \(\quad \mathrm{f}(x) = -12\) [4 marks]
| Answer | Mark | Comments |
|---|---|---|
| \(-3 \quad 2 \quad 6 \quad 14\) with no other solutions | B4 | B3 three correct with at most one incorrect B2 two correct with at most two incorrect B1 one correct with at most three incorrect SC2 \(-3 \quad 2 \quad 6 \quad 14\) with no other values seen SC1 Two or three of \(-3 \quad 2 \quad 6 \quad 14\) with no other values seen |
| Solutions may be in any order eg1 \(-3 \quad 14 \quad 6 \quad 2\) eg2 \(14 \quad -3\) | B4 B2 |
| \(x \lt -3 \quad 2 \lt x \lt 6 \quad x \gt 14\) | SC2 |
| \(2 \leqslant x \leqslant 6\) | SC1 |
| \(-3 \quad 2 \quad 6 \quad 14\) seen in working with no other values and answer line \(-3 \leqslant x \leqslant 14\) | SC2 |
8 The curve \(\quad y = 2x^3 - 3x^2 - 12x + 6\)
has a maximum point at \(L\ (-1, 13)\)
has a minimum point at \(M\ (2, -14)\)
intersects the \(y\)-axis at \(N\).
The curve crosses the \(x\)-axis at three distinct points.
On the axes below, sketch the curve.
Label the points \(L\), \(M\) and \(N\) on your sketch. [3 marks]
| Answer | Mark | Comments |
|---|---|---|
| Correct shape curve crossing \(x\)-axis twice for \(x \gt 0\) crossing \(x\)-axis once for \(x \lt 0\) maximum point \(L\) labelled minimum point \(M\) labelled \(N\ (0, 6)\) labelled | B3 | B2 Correct shape curve crossing \(x\)-axis twice for \(x \gt 0\) crossing \(x\)-axis once for \(x \lt 0\) with incomplete labelling B1 Identifies \(N\) as (0, 6) |
5 Here is a sketch of \(\quad y = \mathrm{f}(x) \quad\) where \(\mathrm{f}(x)\) is a quadratic function.
The graph
intersects the \(x\)-axis at \(A\ (-1, 0)\) and \(B\)
has a maximum point at \(\quad (0.5, 6)\)
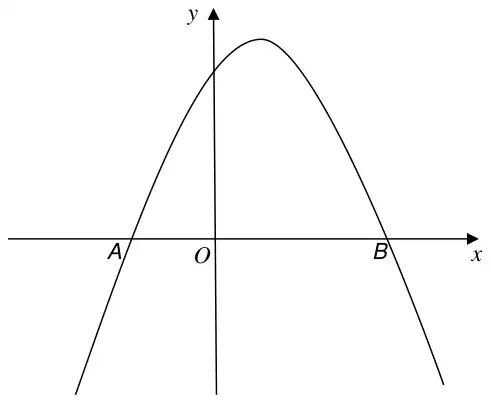
Not drawn accurately
Write down the value of \(k\). [1 mark]
| Answer | Mark | Comments |
|---|---|---|
| (2, 0) | B1 |
| Answer | Mark | Comments |
|---|---|---|
| 6 | B1 |
11 Here is a sketch of a quadratic curve which has a maximum point at \((-2,\ 5)\)
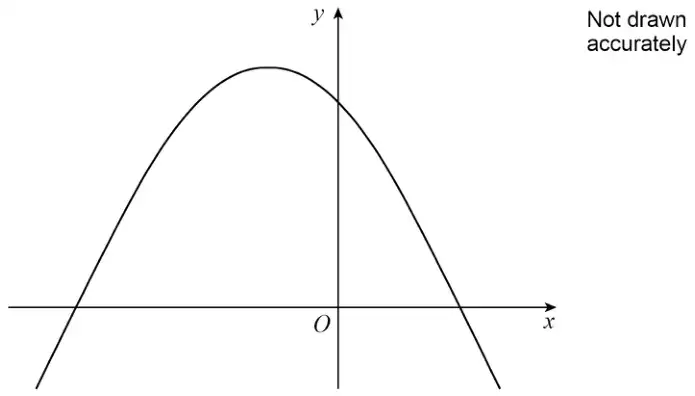
What is the equation of the normal to the curve at the maximum point?
Circle your answer. [1 mark]
| Answer | Mark | Comments |
|---|---|---|
| \(x = -2\) | B1 |
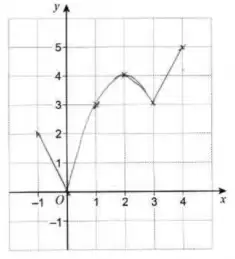
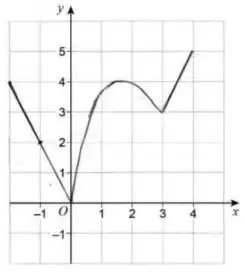
7 A function is given by
\[\begin{aligned} \mathrm{f}(x) &= -2x &\qquad& -1 \leqslant x \lt 0 \\ &= x(4 - x) && 0 \leqslant x \lt 3 \\ &= 2x - 3 && 3 \leqslant x \leqslant 4 \end{aligned}\]Draw the graph of \(\quad y = \mathrm{f}(x) \quad\) on the grid. [4 marks]
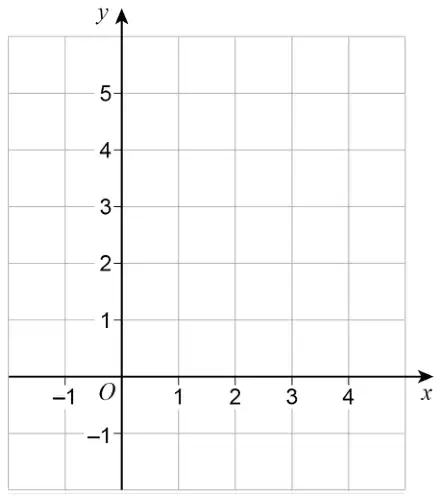
| Answer | Mark | Comments |
|---|---|---|
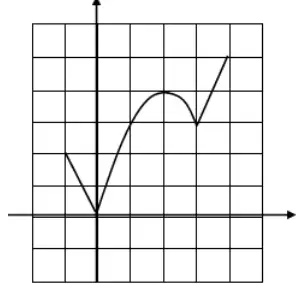 | B4 | B1 for a straight line from \((-1,\ 2)\) to \((0,\ 0)\). This should be drawn with a ruler (give BOD) B1 for a quadratic style curve through \((0,\ 0)\), \((1,\ 3)\), \((2,\ 4)\) and \((3,\ 3)\) within tolerance. Condone one straight line between only one of the sections between \((0,\ 0)\) and \((1,\ 3)\), \((1,\ 3)\) and \((2,\ 4)\) or \((2,\ 4)\) and \((3,\ 3)\) B1 for any quadratic graph drawn with correct curvature and no straight lines (see examples) with clear vertices at \((0,0)\) and \((3,3)\) and within tolerance for these points. There needs to be evidence of a maximum turning point drawn. B1 for a straight line from \((3,\ 3)\) to \((4,\ 5)\). This should be drawn with a ruler (give BOD) SC1 for all six stated points plotted correctly and clearly defined (don’t need to be joined up or could be joined up incorrectly). If any incorrect points plotted then no marks can be awarded |
| Tolerance of plot \(\pm\) 2mm for each stated point (these are 1cm squares) | |
| For \(\mathrm{f}(x) = -2x\) extending to the left of \(x = -1\) or \(\mathrm{f}(x) = 2x - 3\) extending to the right of \(x = 4\) greater than 2mm, award maximum 1 mark from B1 B1 only for a section that would have otherwise scored ie. If both lines extended then B0 B1 | |
| If more than one line drawn in any section then choice so loss of marks | |
| Ignore shading under or over the lines as long as the graph is clear | |
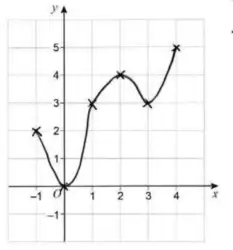 | |
 | |
 | |
 |
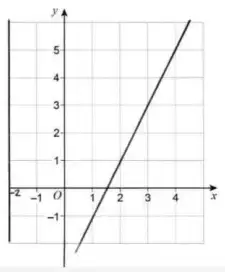
7
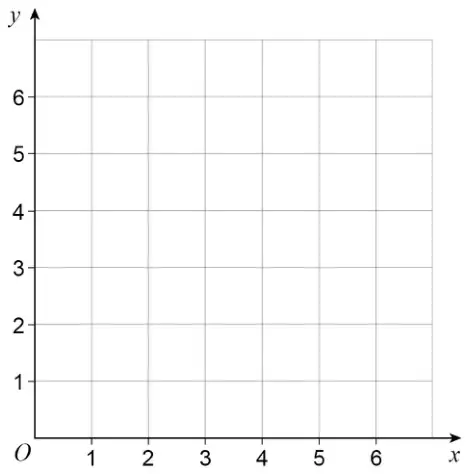
the rate of change of \(y\) with respect to \(x\) is always zero. [1 mark]
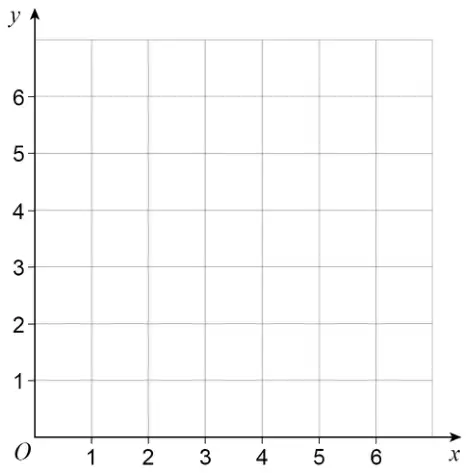
the rate of change of \(y\) with respect to \(x\) is always a positive constant. [1 mark]
| Answer | Mark | Comments |
|---|---|---|
| Horizontal straight line | B1 | mark intention |
| Ignore any attempt at an equation | |
| Mark the entire graph on the grid | |
| Ignore any graph not on the grid | |
| Line clearly drawn on the \(x\)-axis | B1 |
| Line does not need to start from the \(y\)-axis | |
| Ignore any points plotted |
| Answer | Mark | Comments |
|---|---|---|
| Straight line with gradient \(\gt 0\) | B1 | mark intention |
| Ignore any attempt at an equation | |
| Mark the entire graph on the grid | |
| Ignore any graph not on the grid | |
| Vertical line | B0 |
| A straight line joined to another line with a different gradient | B0 |
| Line does not need to start at (0, 0) | |
| Ignore any points plotted |
21 The continuous curve \(\ y = \mathrm{f}(x)\ \) has exactly two stationary points.
Here is some information about the curve.
| \(x \lt -1\) | \(x = -1\) | \(-1 \lt x \lt 2\) | \(x = 2\) | \(x \gt 2\) |
|---|---|---|---|---|
| \(\dfrac{\mathrm{d}y}{\mathrm{d}x}\) is positive | \(\dfrac{\mathrm{d}y}{\mathrm{d}x}\) is zero | \(\dfrac{\mathrm{d}y}{\mathrm{d}x}\) is negative | \(\dfrac{\mathrm{d}y}{\mathrm{d}x}\) is zero | \(\dfrac{\mathrm{d}y}{\mathrm{d}x}\) is negative |
\(\mathrm{f}(-1) = 3 \quad\) and \(\quad \mathrm{f}(2) = 1\)
State the coordinates and the nature of each of the stationary points. [3 marks]
| Answer | Mark | Comments |
|---|---|---|
| \((-1,\ 3)\) or \((2,\ 1)\) | M1 | |
| \((-1,\ 3)\) max(imum) | A1 | |
| \((2,\ 1)\) (point of) inflection | A1 | SC1 \((3,\ -1)\) max(imum) and \((1,\ 2)\) (point of) inflection |
| One correct point and nature | M1A1 |
| Ignore reference to ‘stationary points’ or ‘turning points’ or ‘local’ | |
| Condone p o i for point of inflection |
16 \(y = \mathrm{f}(x)\) is a cubic curve with a maximum and a minimum stationary point.
\(\dfrac{\mathrm{d}y}{\mathrm{d}x} = x^2 + 2x - 3\)
The \(y\)-coordinate of the minimum point is \(2\dfrac{1}{3}\)
The \(y\)-coordinate of the maximum point is 13
\((0,\ 4)\) is a point on the curve.
The tangent at \((0,\ 4)\) has a negative gradient.
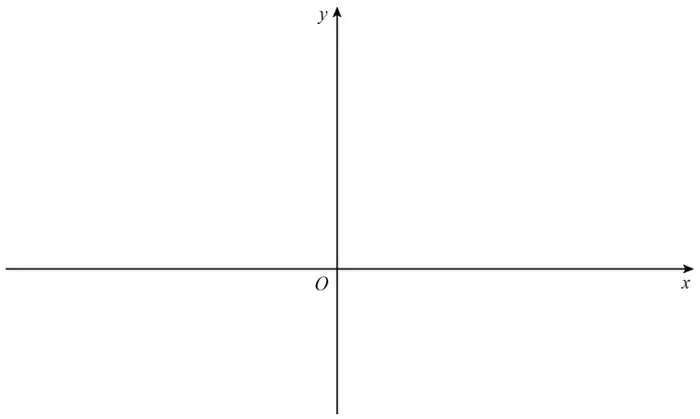
Sketch the curve on the grid below.
Show the coordinates of the stationary points. [4 marks]
| Answer | Mark | Comments |
|---|---|---|
| factorising to get \((x + 3)(x - 1)\ (= 0)\) or completing the square and getting as far as \(x + 1 = \pm 2\) or using the quadratic formula and getting as far as \(x = \dfrac{-2 \pm 4}{2}\) | M1 | 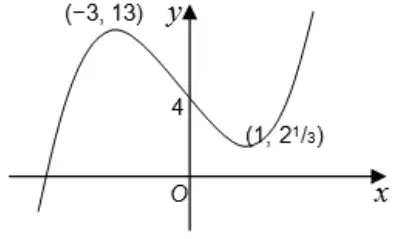 |
| \(x = -3\) and \(x = 1\) | A1 | |
| \((-3,\ 13)\) as a maximum point and \((1,\ 2\tfrac{1}{3})\) as a minimum point, plotted | M1 | |
| Smooth correct curve which must have the stationary points plotted in the correct quadrants and must cross the negative \(x\)-axis | A1 |
| SC1 for a fully correct sketch with the stationary points in the correct quadrants but lacking any detail in terms of the \(x\) coordinates of the stationary points, or with incorrect values of the stationary points, and with no evidence of a valid method to obtain \(x = -3\) and \(x = 1\) |
15 Here is the graph of \(\quad y = 3x - x^2 \quad\) for values of \(x\) from \(-1\) to 4
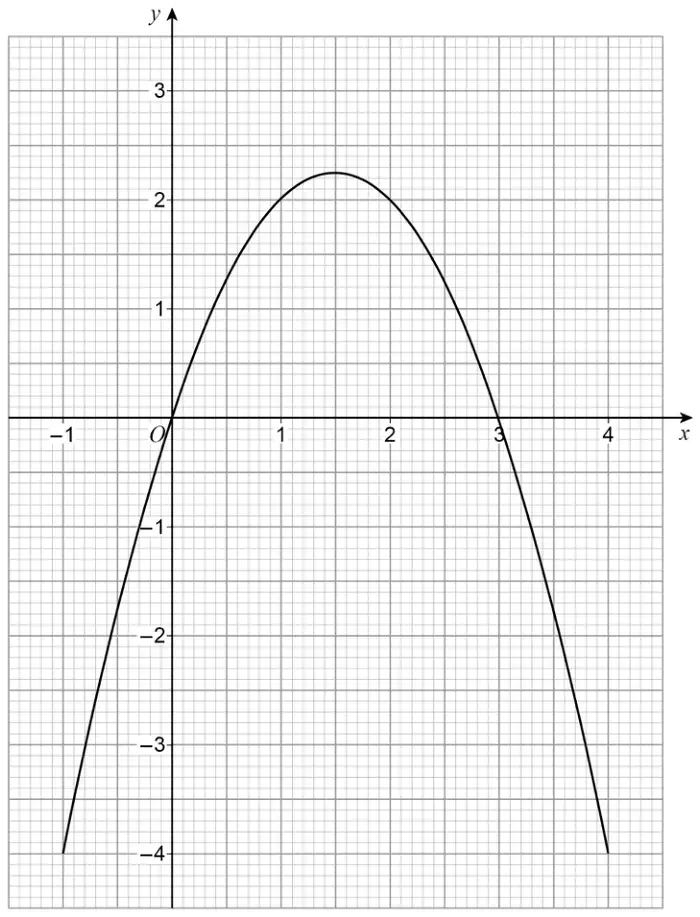
By drawing a suitable linear graph on the grid, work out approximate solutions to
\[x^2 - 4x + 2 = 0\][4 marks]
| Answer | Mark | Comments |
|---|---|---|
| \(2 - x\) or \(x - 2\) | M1 | do not award M1 if you see evidence of incorrect method for finding a linear expression |
| \(y = 2 - x\) accurately drawn | M1 | |
| 3.4 | A1 | accept 3.3 to 3.5 |
| 0.6 | A1 | accept 0.5 to 0.7 |
| For the first M1, start by looking for evidence of a correct method. eg \(\ x^2 - 4x + 2 + 3x - x^2 = -x + 2\) or \(x^2 - 4x + 2 = 0 \ \rightarrow\ x^2 - 3x - x + 2 = 0 \ \rightarrow\ -x + 2 = 3x - x^2\) | |
| Attempts to solve \(x^2 - 4x + 2 = 0\) by using the quadratic formula or by completing the square or by drawing a new quadratic graph (for \(y = x^2 - 4x + 2\)) score 0 marks You might see work which uses the quadratic formula or completing the square which leads to answers of \(2 \pm \sqrt{2}\) … and if this follows working using a correct method to find the linear graph, it can be ignored (they could be using it as a check on their answers obtained graphically), but if it looks like it is their main method, then award 0 marks, as stated above.. Ignore any \(y\) coordinates that might accompany the final \(x\) values. |
5 On the grid, draw the graph of \(\quad y = \mathrm{f}(x)\)
\[\begin{aligned} \mathrm{f}(x) &= x + 4 &\qquad& -4 \leqslant x \lt 0 \\ &= 4 - 3x && 0 \leqslant x \lt 2 \\ &= -2 && 2 \leqslant x \leqslant 5 \end{aligned}\][4 marks]
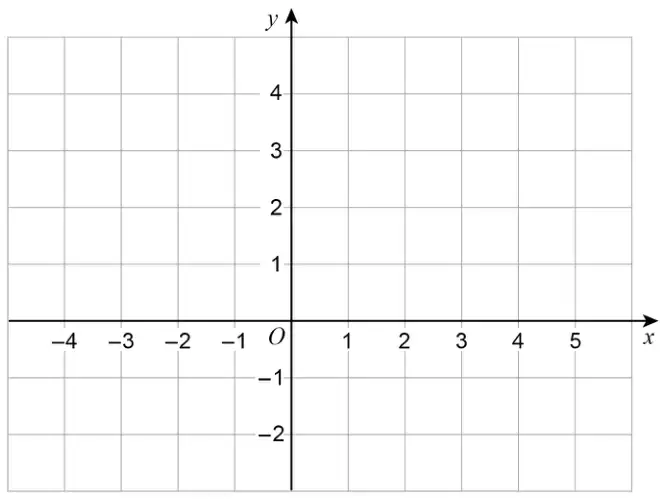
| Answer | Mark | Comments |
|---|---|---|
| Line from \((-4,\ 0)\) to \((0,\ 4)\) | M1 | mark intention |
| Line from \((0,\ 4)\) to \((2,\ -2)\) | M1 | lines do not have to be straight but must pass through all integer points |
| Line from \((2,\ -2)\) to \((5,\ -2)\) | M1 | only condone the first instance of a line that extends beyond the given domain |
| Straight line from \((-4,\ 0)\) to \((0,\ 4)\) and straight line from \((0,\ 4)\) to \((2,\ -2)\) and straight line from \((2,\ -2)\) to \((5,\ -2)\) | A1 | all straight lines must be the correct length with no other lines graph must be accurate SC3 \((-4,\ 0)\) and \((-3,\ 1)\) and \((-2,\ 2)\) and \((-1,\ 3)\) and \((0,\ 4)\) and \((1,\ 1)\) and \((2,\ -2)\) and \((3,\ -2)\) and \((4,\ -2)\) and \((5,\ -2)\) plotted (any other points plotted must be correct ones for the graph) SC2 \((-4,\ 0)\) and \((0,\ 4)\) and \((2,\ -2)\) and \((5,\ -2)\) plotted (any other points plotted must be correct ones for the graph) |
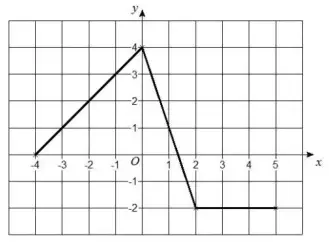 | M3A1 |
| Dashed or dotted lines can score up to M3A0 | |
| Points may be implied by a correct line | |
| M mark examples eg1 2 correct lines and 1 extended line (but otherwise correct) eg2 1 correct line and 2 extended lines (but otherwise correct) eg3 3 extended lines (but otherwise correct) | M3A0 M2A0 M1A0 |
21 Here is a sketch of \(\quad y = (x + 2)(4 - x)\)
The graph intersects the axes at \(A\) (\(-2\), 0), \(B\) (4, 0) and \(C\).
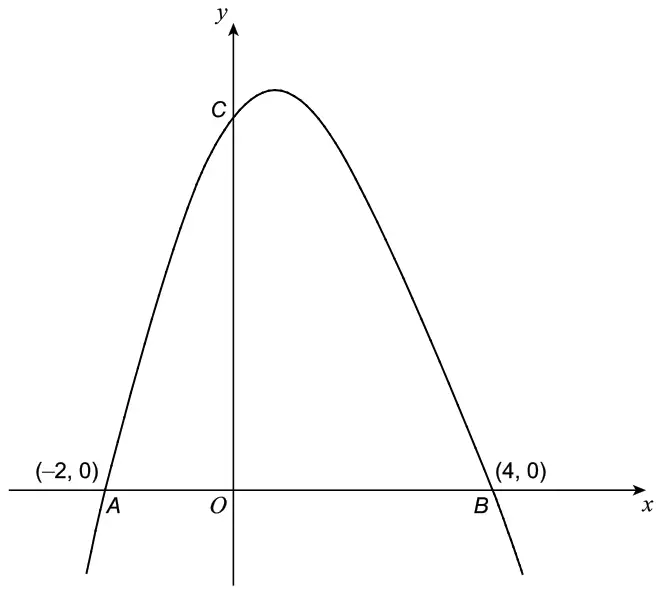
Not drawn accurately
Show that \(\qquad\) length \(BD = 2 \times\) length \(AB\) [5 marks]
| Answer | Mark | Comments |
|---|---|---|
| (0, 8) | B1 |
| Answer line takes precedence over working lines and diagram | |
| Answer line blank with \(C\) labelled (0, 8) on diagram | B1 |
| Answer line blank with 8 written next to \(C\) on diagram | B0 |
| (8, 0) | B0 |
| Answer 8 | B0 |
| Answer | Mark | Comments |
|---|---|---|
| \(-x^2 - 2x + 4x + 8\) | M1 | Allow one error but no omission Must have an \(x^2\) term Terms may be seen in a grid Implied by \(-x^2 + 2x + k \quad k \neq 0\) or \(ax^2 + 2x + 8 \quad a \neq 0\) |
| \(-x^2 - 2x + 4x + 8\) or \(-x^2 + 2x + 8\) | A1 | \(-x^2 - 2x + 4x + 8\) but an error in any collection of terms is M1A0 |
| \(-2x - 2 + 4\) or \(-2x + 2\) or \(-2(x - 1)\) or \(2(1 - x)\) | A1ft | oe ft their quadratic in \(x\) with M1 awarded |
| \(2 - 2x\) with final answer 2 (from substituting in \(x = 0\)) | M1A1A0 |
| Condone \(y = 2 - 2x\) or \(\mathrm{f}(x) = 2 - 2x\) in working for M1A1 If (\(\dfrac{\mathrm{d}y}{\mathrm{d}x}\) or \(\mathrm{f}'(x)\) =) \(2 - 2x\) on answer line also award final A1 | |
| \(y = 2 - 2x\) or \(\mathrm{f}(x) = 2 - 2x\) on answer line | M1A1A0 |
| When marking (b), a maximum of M1A1A0 can be awarded from an expansion seen on the previous page if not contradicted by an expansion in (b) The final A1 must be seen in (b) eg1 (b) no expansion seen with an answer of \(2x + 2\) At top of previous page \(\ -x^2 + 2x + 8\) eg2 (b) no expansion seen with an answer of \(-2x + 6\) In (a) \(\ -x^2 + 2x + 4x + 8 = -x^2 + 6x + 8\) | M1A1A0 M1A0A1ft |
| Correct use of product rule and gradient function \(= -2x + 2\) | 3 marks |
| Answer | Mark | Comments |
|---|---|---|
| Alternative method 1 | ||
| (gradient of curve at \(C\) =) 2 | B1ft | Correct or ft their (b) when \(x = 0\) May be implied |
| \(-\dfrac{1}{\text{their } 2}\) or \(-\dfrac{1}{2}\) | M1 | oe ft their 2 Only ft a non-zero numerical value (gradient of normal =) \(-\dfrac{1}{2}\) is B1M1 |
| \(y = \left(\text{their } -\dfrac{1}{2}\right)x +\) their 8 or \(y -\) their \(8 =\) their \(-\dfrac{1}{2}(x - 0)\) | M1dep | Must have used gradient of normal not gradient of tangent Correct or ft their 8 from (a) in the form (0, \(k\)) |
| \(0 = \left(\text{their } -\dfrac{1}{2}\right)x +\) their 8 or \(0 -\) their \(8 =\) their \(-\dfrac{1}{2}(x - 0)\) or \(x = 16\) | M1dep | Correct or ft their 8 from (a) in the form (0, \(k\)) |
| \(x = 16\) and \(BD = 12\) and \(AB = 6\) with correct method seen | A1 | oe |
| Alternative method 2 | ||
| (gradient of curve at \(C\) =) 2 | B1ft | Correct or ft their (b) when \(x = 0\) May be implied |
| \(-\dfrac{1}{\text{their } 2}\) or \(-\dfrac{1}{2}\) | M1 | oe ft their 2 Only ft a non-zero numerical value (gradient of normal =) \(-\dfrac{1}{2}\) is B1M1 |
| \(\dfrac{0 - \text{their } 8}{x - 0} =\) their \(-\dfrac{1}{2}\) or \(x = -\)their \(8 \div\) their \(-\dfrac{1}{2}\) or \(x = 16\) | M2dep | oe Correct or ft their 8 from (a) in the form (0, \(k\)) |
| \(x = 16\) and \(BD = 12\) and \(AB = 6\) with correct method seen | A1 | oe |
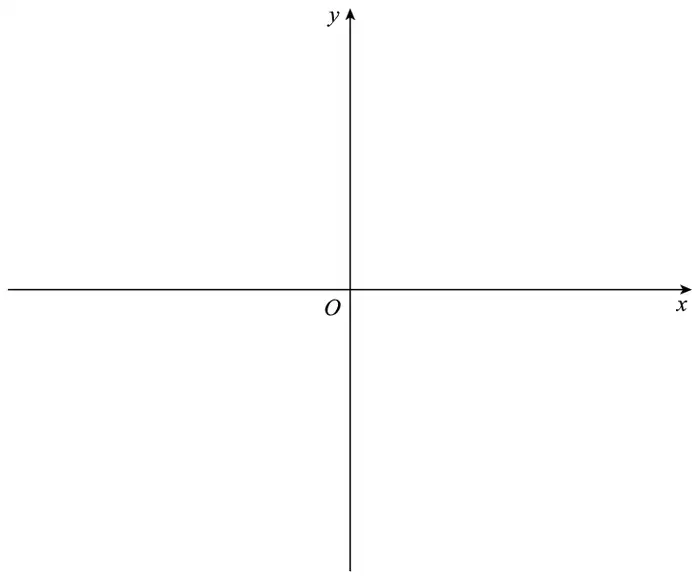
15 The continuous curve \(\ y = \mathrm{f}(x)\) has exactly three stationary points.
The three stationary points are
The curve cuts the \(x\)-axis at three distinct points.
On the axes below, sketch the curve.
Label the points \(P\), \(Q\) and \(R\) on your sketch. [4 marks]
| Answer | Mark | Comments |
|---|---|---|
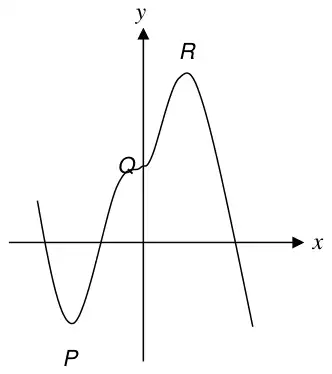 | B4 | There are five features ... minimum point in correct region ie the 3rd quadrant maximum point in correct region, ie the 1st quadrant, with \(y\)-coordinate \(\gt 3\) point of inflection on positive \(y\)-axis with attempt to show decreasing then increasing gradient three distinct \(x\)-axis crossing points, a continuous curve and no more than three stationary points their minimum and maximum points (which need not be stationary points) labelled \(P\) and \(R\) B4 for all five features B3 for four features B2 for three features B1 for two features |
Accept \((a, b)\) and \((c, d)\) instead of \(P\) and \(R\) respectively.
Condone actual values suggested for the coordinates of \(P\) and \(R\).
SC2 for a completely correct shaped sketch, with all features, BUT a reflection of the correct graph in the \(y\)-axis
11 A function \(\mathrm{f}(x)\) is defined as
\[\begin{aligned} \mathrm{f}(x) &= 3 - 2x & \qquad -2 &\leqslant x \lt 0 \\ &= (1 + x)(3 - x) & \qquad 0 &\leqslant x \lt 4 \\ &= 5x - 25 & \qquad 4 &\leqslant x \leqslant 5 \end{aligned}\]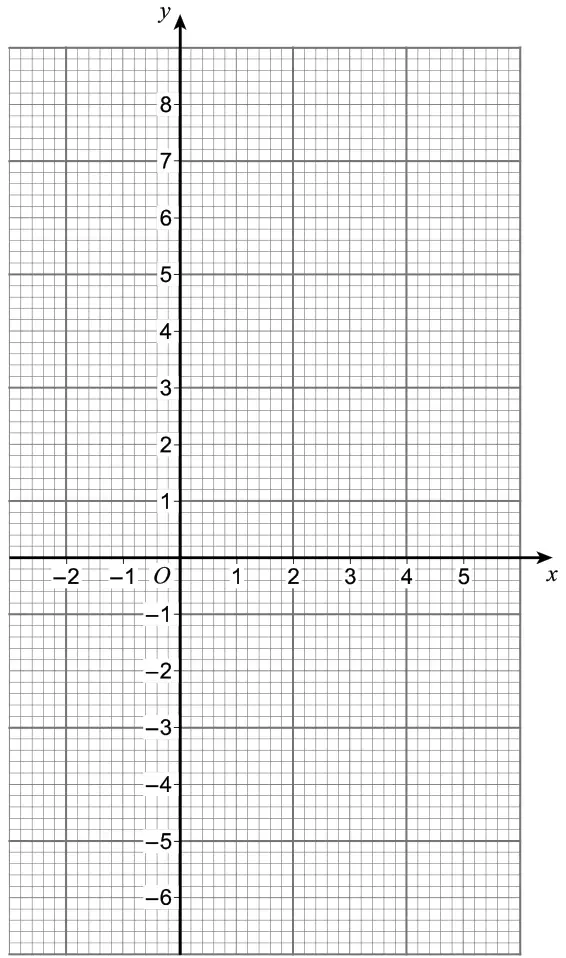
| Answer | Mark | Comments |
|---|---|---|
| Straight line between (\(-2\), 7) and (0, 3) | B1 | Tolerance of ±1 small square Allow line to be extended |
| Points (0, 3) (1, 4) (2, 3) (3, 0) (4, \(-5\)) | M1 | Tolerance of ±1 small square May be plotted or seen in a table Points can be implied |
| Correct smooth parabolic curve with maximum at (1, 4) | A1 | Tolerance of ±1 small square Allow (ruled) straight line between (3, 0) and (4, \(-5\)) Curve passing through all correct points within tolerance scores M1A1 |
| Straight line between (4, \(-5\)) and (5, 0) | B1 | Tolerance of ±1 small square Allow line to be extended |
| Ignore extra points plotted | |
Tolerance of ±1 small square means it is on the edges of or within the shaded area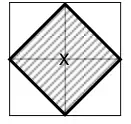 | |
| Points only can score a maximum of M1 | |
| Ruled straight lines for curve apart from between (3, 0) and (4, \(-5\)) | A0 |
| If all 4 marks would be awarded but either (i) graph has a line or a curve that extends beyond the individual domains or (ii) the curve does not meet a line at a cusp | 3 marks |
| Answer | Mark | Comments |
|---|---|---|
| \(-5 \leqslant \mathrm{f}(x) \leqslant 7\) or \(7 \geqslant \mathrm{f}(x) \geqslant -5\) or [\(-5\), 7] | B2ft | Correct or ft their graph in (a) for B2 ft their graph in (a) for B1 B1ft \(-5 \leqslant \mathrm{f}(x)\) or \(\mathrm{f}(x) \leqslant 7\) on their own or embedded within an interval for \(\mathrm{f}(x)\) or only \(-5\) and 7 chosen eg \(-5 \lt \mathrm{f}(x) \lt 7\) |
| Allow \(\mathrm{f}(x)\) to be \(y\) or f or f\(x\) eg1 \(-5 \leqslant y \leqslant 7\) eg2 \(\mathrm{f} \leqslant 7\) | B2 B1 |
| Allow as two inequalities \(\quad \mathrm{f}(x) \geqslant -5\) (and/or) \(\mathrm{f}(x) \leqslant 7\) | B2 |
| ft their graph if incomplete eg no graph drawn for \(-2 \leqslant x \lt 0\) but otherwise correct and answer \(-5 \leqslant \mathrm{f}(x) \leqslant 4\) | B2ft |
| ft their graph if drawn for \(x\) values beyond [\(-2\), 5] eg1 straight line from (\(-3\), 8) to (6, \(-1\)) and answer \(-1 \leqslant y \leqslant 8\) eg2 straight line from (\(-3\), 8) to (6, \(-1\)) and answer \(\mathrm{f}(x) \leqslant 8\) | B2ft B1ft |
| Straight line from (\(-2\), 9) to (6, \(-7\)) and answer \(-7 \leqslant y \leqslant 9\) | B2ft |
| Straight line from (0, 9) to (5, \(-4\)) and answer \(-4 \leqslant \mathrm{f}(x) \leqslant 9\) | B2ft |
| B2ft (or B1ft) can be awarded for a range beyond [\(-7\), 9] if it is clear from working (eg a table of values) where the answer is from | |
| \(-5\) to 7 inclusive is B2 whereas \(-5\) to 7 is B1 | |
| B1 for a correct inequality embedded eg1 \(-5 \lt \mathrm{f}(x) \leqslant 7\) eg2 \(-5 \leqslant \mathrm{f}(x) \leqslant 0\) eg3 \(-2 \leqslant y \leqslant 7\) | B1 B1 B1 |
| For B1 ignore incorrect notation if only \(-5\) and 7 chosen eg1 \(-5 \leqslant x \leqslant 7\) eg2 \(-5 \lt x \leqslant 7\) eg3 \(-5 \geqslant \mathrm{f}(x) \geqslant 7\) eg4 \(-5\), 7 | B1 B1 B1 B1 |
| {\(-5, -4, -3, -2, -1, 0, 1, 2, 3, 4, 5, 6, 7\)} | B0 |
| Working out a statistical range eg \(-5\) to \(7 = 12\) | B0 |
3
Label all points of intersection with the axes.
You do not need to work out the coordinates of any stationary points. [3 marks]
| Answer | Mark | Comments |
|---|---|---|
| Fully correct curve with all intersections labelled ie. \(-9\) and 2 on the \(x\)-axis and \(-18\) on the \(y\)-axis | B3 | B2 for two correct \(x\)-axis points of intersection labelled (they must have a quadratic graph drawn in the correct orientation) B1 for U shaped curve, in the correct orientation, crossing \(y\)-axis at \(-18\), (the \(x\)-axis crossing points not labelled) or two of the three \(x\) or \(y\) axis crossing points marked or stated ... eg this could be (2, 0) and (0, \(-18\)) seen in a table of values or \((x + a)(x + b)\) with \(ab = -18\) or \(a + b = +7\) |
Table of values, points plotted and graph drawn, fully correct, scores all 3 marks
Minimum point must be to the left of the \(y\)-axis to score full marks.
Both sides of the graph must be drawn above the \(x\)-axis to score full marks
Maximum of B1 if no graph drawn eg \(x = -9\) and \(x = 2\) stated, but no graph
| Answer | Mark | Comments |
|---|---|---|
| \(x = -3.5\) | B1 | oe |
It must be \(x = -3.5\), do not accept \(y = -3.5\) or \(-3.5\) on its own
19 The continuous curve \(\ y = \mathrm{g}(x)\ \) has exactly two stationary points.
The stationary points are
On the axes below, sketch the curve.
Label points \(P\) and \(Q\) on your sketch. [3 marks]
| Answer | Mark | Comments |
|---|---|---|
| Continuous curve with point of inflection, labelled \(P\) or (1, 2), in first quadrant and minimum point, labelled \(Q\) or \((a, b)\), in fourth quadrant, with \(x\)-coordinate of Q > \(x\)-coordinate of \(P\) eg 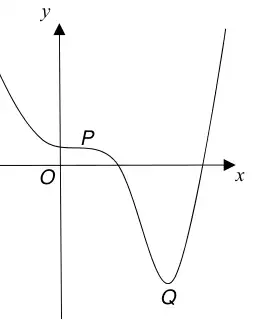 | B3 | For B3, allow the labelling of one coordinate as sufficient for each point B2 As B3 but not sufficiently labelled B1 Curve with point of inflection, labelled \(P\) or (1, 2), in first quadrant or curve with minimum point, labelled \(Q\) or \((a, b)\), in fourth quadrant For B1, allow labelling using one coordinate as sufficient SC2 As B3 but \(x\)-coordinate of Q < \(x\)-coordinate of \(P\) eg 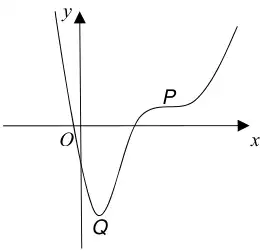 |
For B3, curve does not have to cross the \(x\)-axis after \(Q\) and does not have to cross the \(y\)-axis before \(P\)
For a stationary point, curve must not stop at the point
At \(P\), the curve must change from concave upward to concave downward for B3 or B2 or vice-versa for B1 or SC2
Note that other non-stationary points of inflection may also be seen (up to B3 possible)
Curve may have horizontal asymptotes as \(x \to \pm\infty\) (up to B3 possible)
Mark intention for stationary points, positioning of labels and smoothness of curve
More than 1 stationary point of inflection and/or more than 1 minimum point and/or maximum point(s) can score a maximum of B1
Labelling using a coordinate or coordinates may be seen by labelling on an axis or on axes (axes may also show other numbers)
13 Here is a sketch of \(\quad y = a + bx - 2x^2 \quad\) where \(a\) and \(b\) are constants.
The graph intersects the \(x\)-axis at \((-1, 0)\) and \(\left(\dfrac{7}{2}, 0\right)\) and the \(y\)-axis at point \(P\).
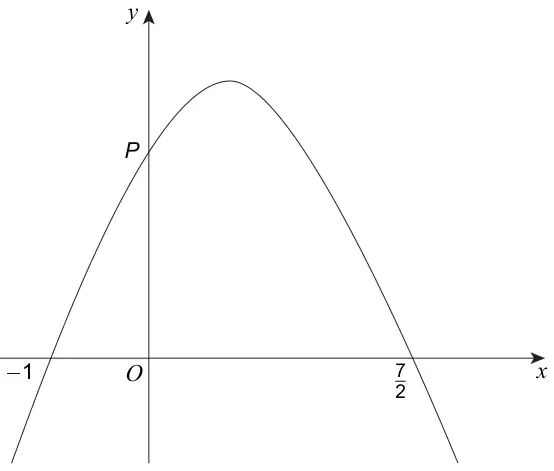
Not drawn accurately
Work out the coordinates of point \(P\).
You must show your working. [4 marks]
| Answer | Mark | Comments |
|---|---|---|
| Alternative method 1 | ||
| \(a - b - 2 = 0\) or \(a + \dfrac{7}{2}b - \dfrac{49}{2} = 0\) | M1 | oe equation Allow an unsimplified equation eg \(a + b \times (-1) - 2(-1)^2 = 0\) Missing brackets can be recovered |
| \(a - b - 2 = 0\) and \(a + \dfrac{7}{2}b - \dfrac{49}{2} = 0\) | M1 | oe two equations Allow unsimplified equations |
| \(\dfrac{7}{2}a + a = 7 + \dfrac{49}{2}\) or \(\dfrac{7}{2}b - -b = \dfrac{49}{2} - 2\) and \(a\) − their \(b - 2 = 0\) | M1dep | oe dep on first M1 Correct method to form an equation in \(a\) or correct method to form an equation in \(b\) and substitutes to form an equation in \(a\) Their two equations must both contain \(a\) and \(b\) |
| \((0, 7)\) | A1 | SC4 Answer \((0, 7)\) from \((2x - 7)(1 + x)\) or \(2x^2 + 2x - 7x - 7\) or \(2x^2 - 5x - 7\) |
| Alternative method 2 | ||
| \((7 - 2x)\) or \((1 + x)\) or \((2x - 7)\) or \((-1 - x)\) or \((x - 3.5)\) or \((3.5 - x)\) or \(2x^2 + 2x - 7x - 7\) or \(2x^2 - 5x - 7\) | M1 | oe Brackets not needed |
| \((7 - 2x)(1 + x)\) or \((2x - 7)(-1 - x)\) or \(7 + 7x - 2x - 2x^2\) or \(7 + 5x - 2x^2\) | M1 | oe eg \(-(2x^2 - 5x - 7)\) \(y =\) not needed Expansion not needed |
| Substitutes \(x = 0\) in their quadratic or selects the constant term from their quadratic | M1dep | dep on first M1 Expansion not needed for their quadratic but must be correct if attempted May be implied by the final answer |
| \((0, 7)\) | A1 | SC4 Answer \((0, 7)\) from \((2x - 7)(1 + x)\) or \(2x^2 + 2x - 7x - 7\) or \(2x^2 - 5x - 7\) |
| Alternative method 3 | ||
| \(b - 2 \times 2x\) or \(b - 4x\) | M1 | Differentiates correctly |
| \(b - 2 \times 2 \times 1.25 = 0\) or \(b - 4 \times 1.25 = 0\) or \(b = 5\) | M1 | |
| \(a\) + their \(b \times (-1) - 2 \times (-1)^2 = 0\) or \(a\) + their \(b \times \left(\dfrac{7}{2}\right) - 2 \times \left(\dfrac{7}{2}\right)^2 = 0\) | M1dep | oe dep on first M1 Must have substituted a value into \(b - 4x\) and equated to 0 Missing brackets can be recovered |
| \((0, 7)\) | A1 | SC4 Answer \((0, 7)\) from \((2x - 7)(1 + x)\) or \(2x^2 + 2x - 7x - 7\) or \(2x^2 - 5x - 7\) |
| Alternative method 4 | ||
| \(-2\left\{\left(x - \dfrac{b}{4}\right)^2 \ldots\ldots\right\}\) | M1 | oe completed square |
| \(\dfrac{b}{4} = 1.25\) or \(b = 5\) | M1 | |
| \(a\) + their \(b \times (-1) - 2 \times (-1)^2 = 0\) or \(a\) + their \(b \times \left(\dfrac{7}{2}\right) - 2 \times \left(\dfrac{7}{2}\right)^2 = 0\) | M1dep | oe dep on first M1 Must have equated \(\dfrac{b}{4}\) to a value Missing brackets can be recovered |
| \((0, 7)\) | A1 | SC4 Answer \((0, 7)\) from \((2x - 7)(1 + x)\) or \(2x^2 + 2x - 7x - 7\) or \(2x^2 - 5x - 7\) |
| Answer \((7, 0)\) | A0 |
| Answer only \((0, 7)\) | M3 A1 |
| Alt 1 3rd M1 Follow correct method rules as in Q4 Alt 1 2nd M1 | |
| Answer \((0, 7)\) with working may not score full marks Check the working each time eg (Alt 2) \(2x^2 - 3x + 7\) (no method seen) Answer \((0, 7)\) | Zero |
2 The function \(\quad \mathrm{f}(x) = x^2 - 4x + 1 \quad\) has domain \(\ -1 \leqslant x \leqslant 5\)
Here is the graph of \(\quad y = \mathrm{f}(x)\)
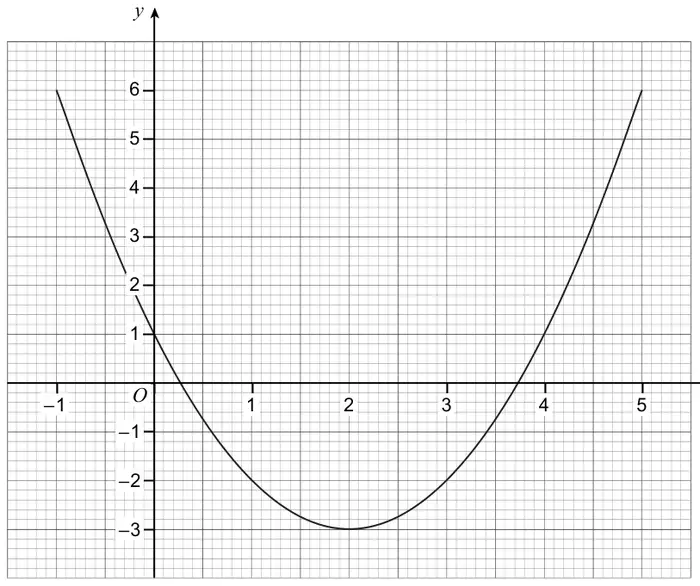
Give your answers to 1 decimal place. [2 marks]
| Answer | Mark | Comments |
|---|---|---|
| \(x = 2\) | B1 |
| \(2 = x\) | B1 |
| \(y = 2\) | B0 |
| 2 | B0 |
| Answer | Mark | Comments |
|---|---|---|
| \(-0.8\) and 4.8 with no other answers | B2 | Both correct in either order B1 One correct and one incorrect or missing |
| The word ‘and’ is not needed If their answer has both \(-0.8\) and 4.8 with no other solutions award B2 eg 4.8, \(-0.8\) with no other solutions | B2 |
| Answer | Mark | Comments |
|---|---|---|
| \(-3 \leqslant \mathrm{f}(x) \leqslant 6\) or \(6 \geqslant \mathrm{f}(x) \geqslant -3\) or [\(-3\), 6] | B2 | oe B1 \(\mathrm{f}(x) \geqslant -3\) or \(\mathrm{f}(x) \leqslant 6\) on their own or embedded within an interval for \(\mathrm{f}(x)\) or only \(-3\) and 6 chosen |
| Allow as two inequalities \(\mathrm{f}(x) \geqslant -3 \quad \mathrm{f}(x) \leqslant 6\) | B2 |
| \(-3\) to 6 inclusive | B2 |
| \(\mathrm{f}(x)\) may be replaced by f or \(y\) or \(x^2 - 4x + 1\) for B2 and B1 | |
| B1 may be seen with an incorrect inequality eg1 \(-3 \lt \mathrm{f}(x) \leqslant 6\) eg2 \(-3 \leqslant \mathrm{f}(x) \lt 6\) eg3 \(-3 \leqslant \mathrm{f}(x) \leqslant 5\) | B1 B1 B1 |
| For B1 ignore incorrect notation if only \(-3\) and 6 chosen eg1 \(-3 \leqslant x \leqslant 6\) eg2 \(-3 \lt x \leqslant 6\) eg3 \(-3\) to 6 eg4 \(-3\) to \(6 = 9\) (working out a statistical range) eg5 \(-3 \geqslant \mathrm{f}(x) \geqslant 6\) eg6 \(-3\), 6 | B1 B1 B1 B1 B1 B1 |
| {\(-3, -2, -1, 0, 1, 2, 3, 4, 5, 6\)} | B0 |
No questions match these filters.