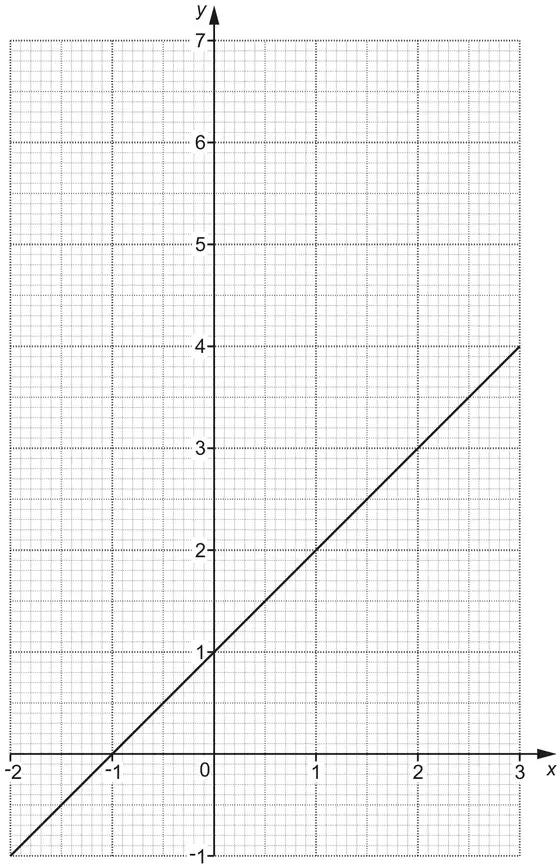
(b) The graph of \(y = x + 1\) is shown on the grid.
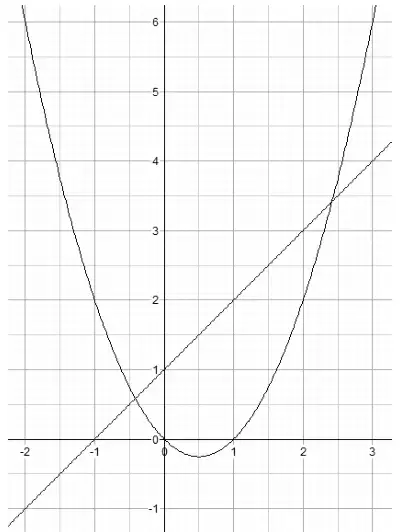
On the same grid, use part (a) to draw the graph of \(y = x^2 - x\) for values of x from \({}^{-}2\) to 3.
[3]
(c) Write down the \(x\)-coordinates of the points where \(y = x^2 - x\) and \(y = x + 1\) cross. [2]
Mark scheme (a)
Answer
Marks
Part marks and guidance
2 0
2
B1 for each
Mark scheme (b)
Answer
Marks
Part marks and guidance
Correct curve
3
B2FT for all points correctly plotted or B1FT for 4 or 5 points correctly plotted
FT their values from the table in (a) for points but accept only the correct curve. Accuracy ± half small square Correct curve must have at least one square of daylight below \(x\)-axis at minimum point and not intended straight
Mark scheme (c)
Answer
Marks
Part marks and guidance
\({}^{-}[0].4\) and 2.4
2
Correct answer or FTtheir graph for both B1 for each
-0.45 to -0.35 and 2.35 to 2.45 FT from their line with half square accuracy (may be straight)