
Higher November 2018 Paper 4 Q21
21 The number of gannets on an island is assumed to follow this exponential growth model.
\[N = 0.45 \times 1.07^x\]\(N\) is the number of gannets, in thousands.
\(x\) is the number of years after 1st January 2010.
(a) Complete the table for \(N = 0.45 \times 1.07^x\).
| \(x\) | 0 | 5 | 10 | 15 | 20 |
|---|---|---|---|---|---|
| \(N\) | 0.45 | 0.63 | 1.24 |
[2]
(b) Draw the graph of \(N = 0.45 \times 1.07^x\).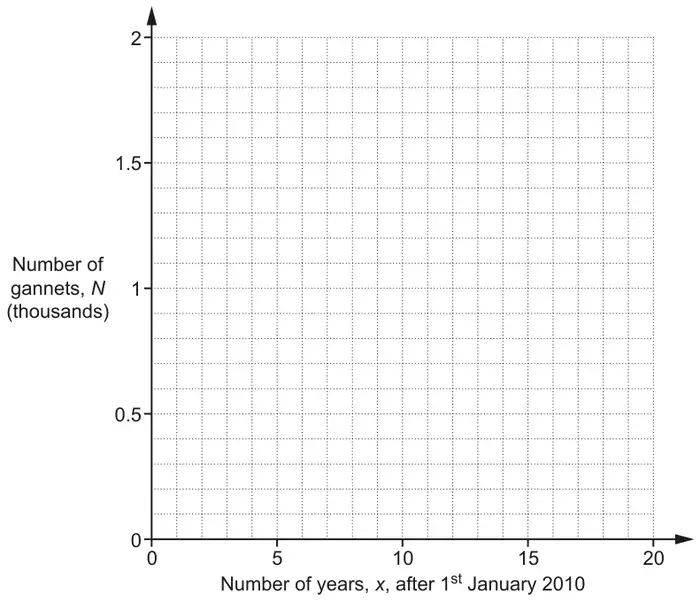
[2]
(c) Use the graph to find the year when the gannet population is predicted to reach 1000. [2]
| Answer | Marks | Part marks and guidance | |
|---|---|---|---|
| [0].88 or [0].89 1.7[4] | 2 | B1 for each | |
| Answer | Marks | Part marks and guidance | |
|---|---|---|---|
| Correct curve | 2 | B1 for 3 or 4 correct points plotted FT their table | tolerance ± \(\frac{1}{2}\) square |
| Answer | Marks | Part marks and guidance | |
|---|---|---|---|
| 2021 or 2022 | 2 | B1 for \(x\) = 11 to 12 | |