
Foundation June 2019 Paper 2 Q9
9 The graph shows Sarah’s journey from her home to a shopping centre.
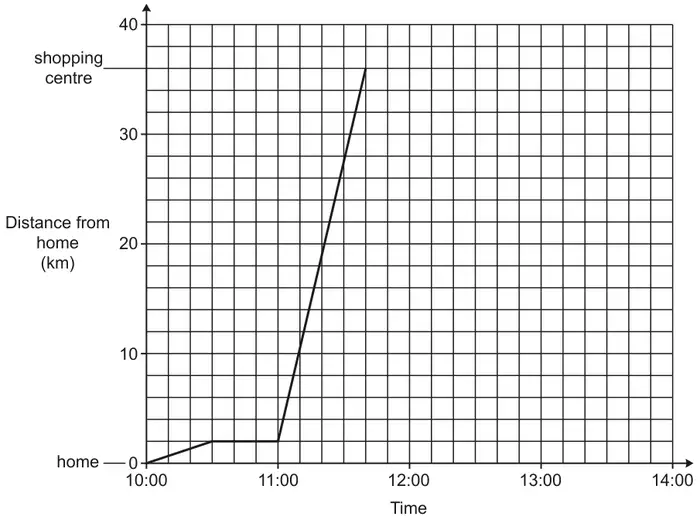
(a) State an assumption that has been made when the graph was drawn. [1]
(b) What is the distance from Sarah’s home to the shopping centre? [1]
(c) Between which two times did Sarah stop?
Explain how the graph shows this. [2]
Explain how the graph shows this. [2]
(d)
(i) Sarah stays at the shopping centre until 13:00.
She then travels home without stopping.
Her journey home takes 40 minutes.
She then travels home without stopping.
Her journey home takes 40 minutes.
Complete the graph to show this information. [3]
(ii) Work out Sarah’s average speed for her journey home.
Give your answer in kilometres per hour. [3]
Give your answer in kilometres per hour. [3]
| Answer | Marks | Part marks and guidance | |
|---|---|---|---|
| She travels at constant speeds oe | 1 | Any incorrect statement invalidates the reasoning eg implying a constant speed for the entire journey SEE APPENDIX | |
Appendix
Exemplar responses for Q9a
| Response | Mark |
|---|---|
| Her speed was the same (this does not imply the whole journey) | 1 |
| She stayed at a constant speed (BOD as doesn’t refer to whole journey) | 1 BOD |
| Sarah drove at the same speed 2km from home all the way to the shopping centre. | 1 |
| The straight lines on the graph show steady speed. | 1 |
| She walked at the same pace (BOD, question doesn’t state form of transport) | 1 |
| She stayed at the same speed on the way to the shopping centre (implies whole journey) | 0 |
| That she was constantly moving and through no traffic. Therefore going at a constant speed. (The first sentence invalidates the reason) | 0 |
| She was going the same speed throughout. (implies whole journey so 0) | 0 |
| That she rest for 30 minutes after doing 30 minutes of her journey | 0 |
| She walked slowly at the beginning and fast at the end (doesn’t imply constant speed) | 0 |
| Her journey to the shopping centre would take less than 4 hours (reference to the size of the graph not relevant) | 0 |
| Her route did not alter. She went straight to the shopping centre (Incorrect) | 0 |
| When she left home she started off and then she goes into constant speed and then she accelerated. Or Sarah was at a constant acceleration. (reference to acceleration is wrong) | 0 |
| There was no traffic. (no indication of speed) | 0 |
| There are no major issues which cause delay. (Reference to conditions on the journey are irrelevant we need a comment about why we are drawing a straight line) | 0 |
| That Sarah did not stop off | 0 |
| Her journey is faster from 11:00 (true but nothing about constant speed) | 0 |
| She will leave exactly on time (answer MUST refer to constant speed) | 0 |
| Answer | Marks | Part marks and guidance | |
|---|---|---|---|
| 36 | 1 | ||
| Answer | Marks | Part marks and guidance | |
|---|---|---|---|
| 10:30[am] and 11:00[am] | 1 | Accept. eg 11, 1100, 10 30, 10.30 Do not accept eg 11h, 10h30 | |
| distance from home stays the same or zero gradient oe | 1 | SEE APPENDIX | |
Appendix
Exemplar responses for Q9c
| Response | Mark |
|---|---|
| It goes horizontally | 1 |
| Because it’s a straight line not moving up or down which means no distance is being made | 1 |
| A horizontal line with no gradient (BOD ‘no’ rather than ‘zero’) | 1BOD |
| It has a flat part | 1 |
| The line which goes straight across which means she stopped (word ‘across’ is needed) | 1 |
| The distance stayed the same | 1 |
| The line during this time does not move in distance but the line still moves on the time showing she was stationary | 1 |
| The graph stays on the same level | 1BOD |
| The line doesn’t carry on increasing it stays constant for half an hour. (BOD time referred to therefore ‘it’ must imply distance) | 1 |
| The line has no incline | 1 |
| Straight line which indicates when Sarah stopped | 0 |
| A straight line that does not increase (just ‘straight line’ is not enough – needs to imply distance hasn’t changed with time) | 0 |
| The straight parallel line (parallel to ‘time axis’ would be fine to score) | 0 |
| The consistent line between the two times meaning that she stopped for 30 minutes (‘consistent’ is not correct) | 0 |
| The slope on the graph shows that Sarah stopped (reference to, ‘no slope’ would score) | 0 |
| Not going up in a diagonal line and staying straight (‘straight across’ in this statement would be enough to score) | 0 |
| A steady line that does not go up (so could go down, horizontal not implied) | 0 |
| Answer | Marks | Part marks and guidance | |
|---|---|---|---|
| (i) Horizontal line from (1140, 36) to (1300, 36) | 1 | Condone freehand line Ignore construction lines Mark endpoint as the vertex with their second line | |
| Line from (their 1300, 36) to reach time axis after their 1300 | 1 | Could be a curve provided no horizontal sections | If no/wrong horizontal section drawn assume (their 1300, 36) to be the start of their line with negative gradient |
| at (1340, 0) or FT (their 1300 + 40 mins, 0) | 1 | eg 2 marks for one line such as (1140, 36) to (1220, 0) | |
| (ii) 54 | 3 | M2 for \(\dfrac{36 \text{ or their (b)}}{40} \times 60\) oe or M1 for \(\dfrac{36 \text{ or their (b)}}{40}\) soi by 0.9 or for an equivalent distance to time ratio | Condone 36000 used for M2 and M1 eg 18 associated with 20 but not 36 to 40 |