
1MA0 Higher March 2013 Paper 1 Q6
6 You can use this conversion graph to change between pounds (£) and dollars ($).
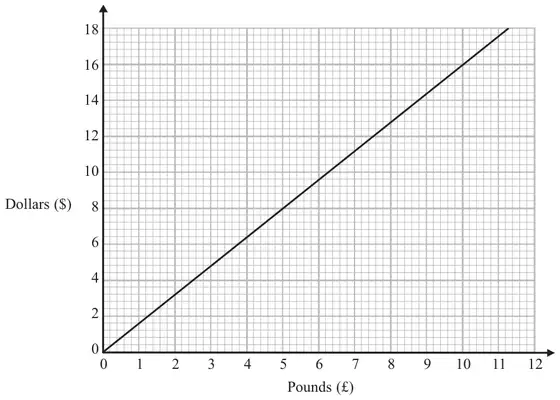
(a) Use the conversion graph to change £5 to dollars. (1)
Ella has $200 and £800
Her hotel bill is $600
Ella pays the bill with the $200 and some of the pounds.
(b) Use the conversion graph to work out how many pounds she has left. (4)
| Answer | Mark | Notes |
|---|---|---|
| 8 | 1 | B1 for 8 (.00) |
| Answer | Mark | Notes |
|---|---|---|
| 550 | 4 | M1 for 600 – 200 ( = 400) M1 for correct method to convert ‘$400’ to £ M1 (dep on the previous M1) for 800 – ‘$400’ in £s A1 for value in the range 540 – 560 OR M1 for correct method to convert $600 and $200 to pounds M1 for ‘375’ – ‘125’ M1 (dep on the previous M1) 800 – ‘250’ A1 for a value in the range 540 – 560 OR M1 for correct method to convert £800 to dollars M1 for ‘1280’ + 200 – 600 M1 (dep on the previous M1) for attempt to convert ‘$880’ back to £ A1 for value in the range 540 – 560 |