
Higher June 2024 Paper 6 Q1
1 Below are six graphs, numbered 1 to 6, that show different relationships between \(x\) and \(y\).
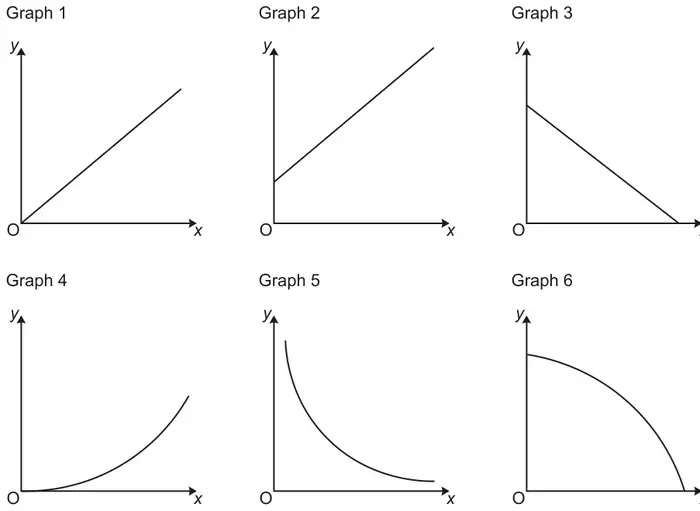
For each description below, write down the number of the graph that best represents the relationship between \(x\) and \(y\).
| \(x\): temperature in °C \(y\): temperature in °F, where \(y = 1.8x + 32\). | Graph ............ |
| \(x\): average speed when running 200 m \(y\): time taken to run 200 m. | Graph ............ |
| \(x\): mass of a solid object made from clay \(y\): volume of the same solid object. | Graph ............ |
| Answer | Marks | Part marks and guidance | |
|---|---|---|---|
| 2 5 1 | 3 | B1 for each | |