
Higher November 2021 Paper 3 Q15
15 The graph gives the volume of water, in litres, in a container at time \(t\) seconds after the water started to flow out of the container.
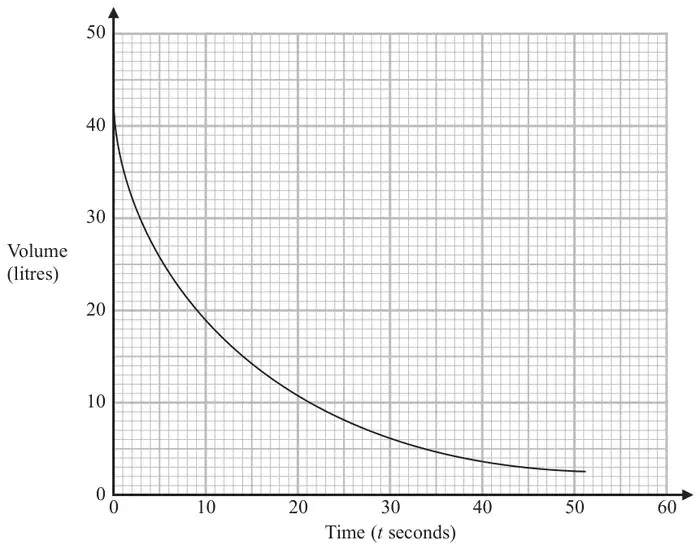
Using the graph, work out an estimate for the rate at which the water is flowing out of the container when \(t = 12\)
You must show your working. (3)
| Answer | Mark | Mark scheme |
|---|---|---|
| 0.7 to 1.1 | M1 | for tangent to the curve drawn at \(t = 12\) |
| M1 | for method to find the gradient of their tangent, eg \(28 \div 30\) | |
| A1 | for answer in the range 0.7 to 1.1 dependent upon tangent drawn |
Additional guidance
Working may be seen on the diagram
Ignore negative signs