
Higher November 2022 Paper 5 Q16
16 The graph shows the distance travelled by a particle over the first 20 seconds of its motion.
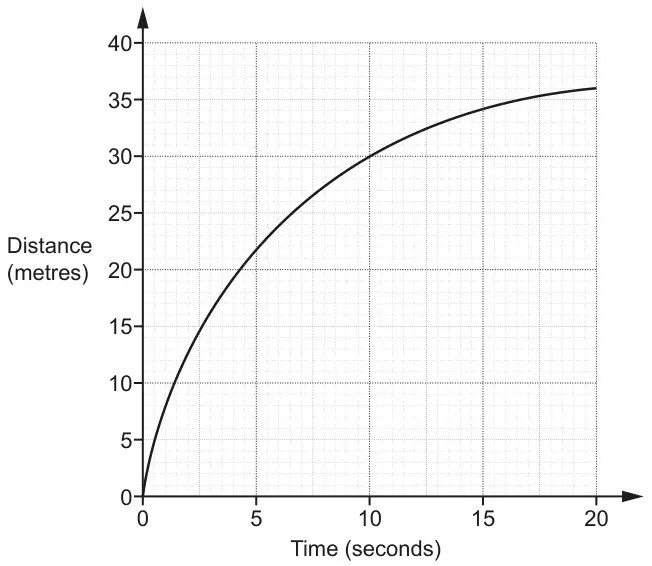
(a) Show that the average speed of the particle over the first 20 seconds of its motion is 1.8 m/s. [1]
(b) Estimate the speed of the particle at 10 seconds, in m/s.
You must show working to support your estimate. [3]
You must show working to support your estimate. [3]
| Answer | Marks | Part marks and guidance | |
|---|---|---|---|
| 36 ÷ 20 | 1 | Accept \(\frac{36}{20}\) | |
| Answer | Marks | Part marks and guidance | |
|---|---|---|---|
| Tangent drawn to graph at \(t\) = 10 | B1 | Tangent - mark intention but no daylight | |
| 1[.0] to 1.5 | B2 | Dep on tangent or close attempt M1dep for rise/run with values substituted | |