
Higher November 2022 Paper 6 Q12
12 The graph shows the speed of a car during the first 40 seconds of a journey.
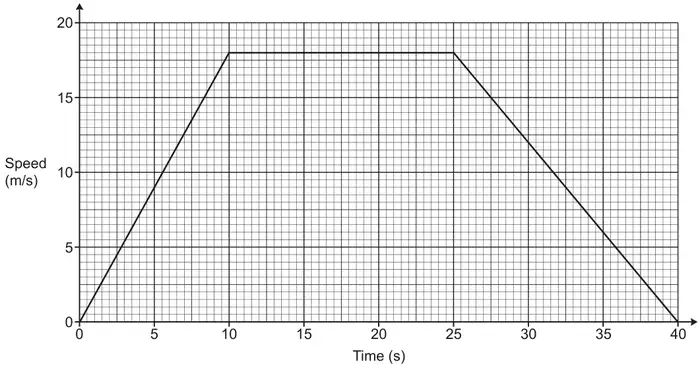
(a) Write down the acceleration of the car between 10 seconds and 25 seconds, in m/s2. [1]
(b) Work out the average speed of the car, in m/s, during the 40 seconds.
You must show your working. [5]
You must show your working. [5]
| Answer | Marks | Part marks and guidance | |
|---|---|---|---|
| 0 | 1 | ||
| Answer | Marks | Part marks and guidance | |
|---|---|---|---|
| 12.37[5] or 12.38 or 12.4 all oe and with correct working | 5 | M3 for \(\frac{(15 + 40) \times 18}{2}\) or M2 for attempt at total area with one reading or one calculation error or M1 for one area calculation AND M1dep for their 495 ÷ 40 If 0 or 1 scored, instead award SC2 for answer 12.37[5] or 12.38 or 12.4 all oe with no working or insufficient working If 0 scored SC1 for 495 with no working or insufficient working | “Correct working” requires evidence of at least M3 Areas may be found in stages e.g. M3 for \(\left(\frac{1}{2} \times 10 \times 18\right) + (15 \times 18) + \left(\frac{1}{2} \times 15 \times 18\right)\) implied by 90 + 270 + 135 e.g. use of 16 rather than 18 throughout is one error but both triangles incorrect is two errors e.g. one of the above soi by 90, 270 or 135 Dep on at least M1 |