
Higher June 2017 Paper 4 Q15
15 The graph shows the speed, \(v\) metres per second (m/s), of a car at time \(t\) seconds.
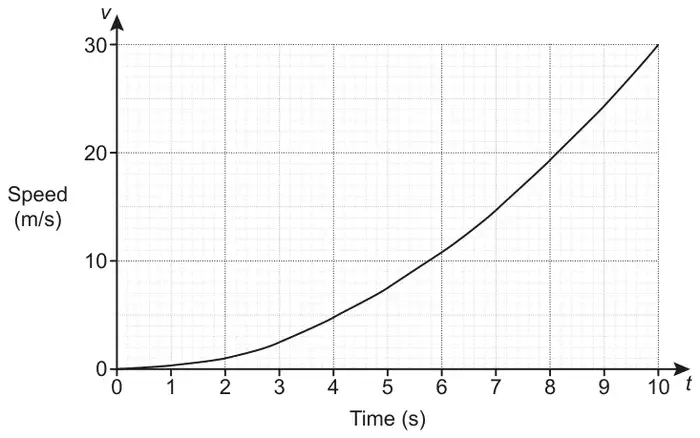
(a) Find the speed of the car at \(t = 7\). [1]
(b) It is claimed that the car has accelerated from 0 to 60 miles per hour in the first 10 seconds.
Does the graph support this claim? Show your reasoning.
Does the graph support this claim? Show your reasoning.
Use 1 mile = 1.6 kilometres. [5]
(c) Use the graph to estimate the acceleration at \(t = 7\). [3]
(d) The speed of this car is directly proportional to the square of the time.
Find a formula linking \(v\) and \(t\). [3]
(e) Georgina says that the graph shows that the speed of the car will continue to increase after 10 seconds.
Make one comment to show that this statement is incorrect. [1]
| Answer | Marks | Part marks and guidance | |
|---|---|---|---|
| 14 – 15 | 1 | ||
| Answer | Marks | Part marks and guidance | |
|---|---|---|---|
| 30 from graph | B1 | accept any correct method e.g. | |
| Starting with their 30 (using mph) These method marks could be awarded in any order | Starting with 60 (using m/s) These method marks could be awarded in any order M1 × 1.6 soi by 96 M1 × 1000 soi M1 \(\div 60^2\) soi B1 for 30 from graph A1 for 26.6 to 26.7 and 30 so yes | (using km/hr) M1 for 60 × 1.6 soi by 96 B1 for 30 from graph Starting with their 30 These method marks could be awarded in any order M1 \(\times 60^2\) soi M1 ÷ 1000 soi A1 for 96 and 108 so yes | |
| \(\times 60^2\) soi | M1 | ||
| ÷ 1000 soi | M1 | ||
| ÷ 1.6 soi | M1 | ||
| 67.5 so yes | A1 | ||
| Answer | Marks | Part marks and guidance | |
|---|---|---|---|
| Attempt at a tangent drawn at \(t = 7\) | B1 | Accept answer as a fraction and tolerance on reading from graph ± ½ small square Gradient for M1 could be from a chord. Ignore any negative sign | |
| 4.0 to 4.5 oe | B2 | M1 for an attempt at speed ÷ time, could be on the graph e.g. 30 ÷ 10 or their (a) ÷ 7 soi 2.07… or 2.14.. | |
| Answer | Marks | Part marks and guidance | |
|---|---|---|---|
| \(v = kt^2\) where \(0.25 \leqslant k \leqslant 0.33\) | 3 | SC2 for \(v \propto kt^2\) where \(0.25 \leqslant k \leqslant 0.33\) or B1 for \(v = kt^2\) AND M1 for \(30 = k(10)^2\) or FT their reading from the graph for values of \(v\) and \(t\) or B1 for \(0.25 \leqslant k \leqslant 0.33\) | Condone use of other letters especially \(s\) for speed Can be implied by eg \(30 = k(10)^2\) \(k\) could be a fraction e.g. \(\frac{15}{49}\) |
| Answer | Marks | Part marks and guidance | |
|---|---|---|---|
| any correct comment e.g. graph only valid/information only available up to 10 secs or car will eventually reach max. speed | 1 | See appendix | |
Appendix: Exemplar responses for Q15(e)
| Response | Mark |
|---|---|
| graph only valid/information only available up to 10 secs | 1 |
| car will eventually reach max. speed | 1 |
| It could stay at a constant speed | 1BOD |
| It gains enough acceleration its speed becomes constant | 0 |
| He drove the whole route | 0 |