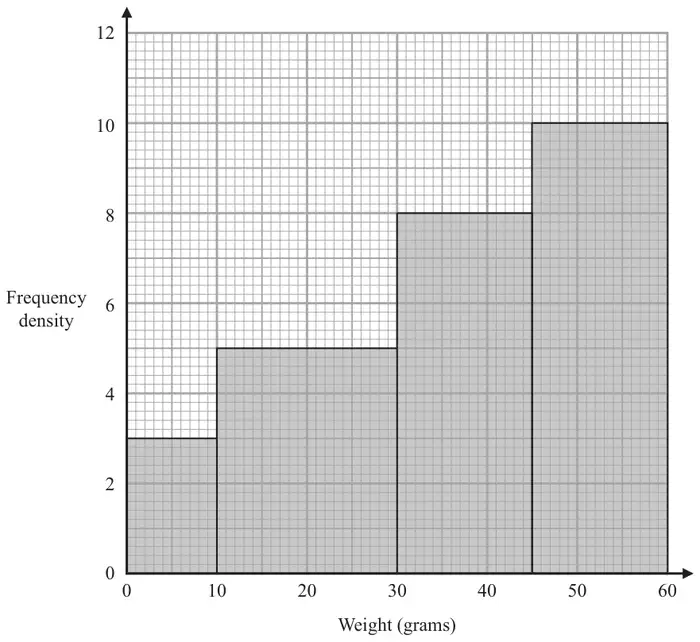
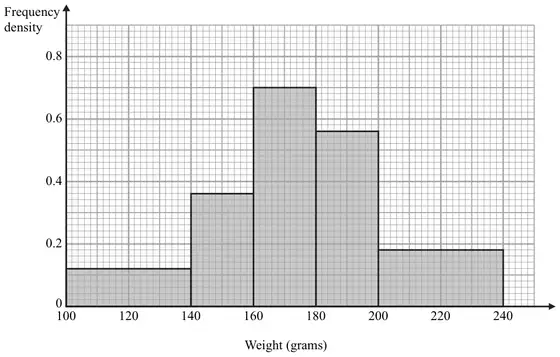
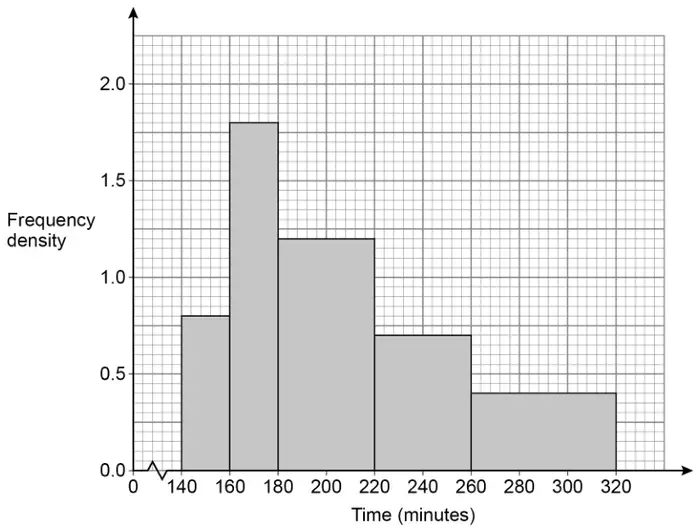
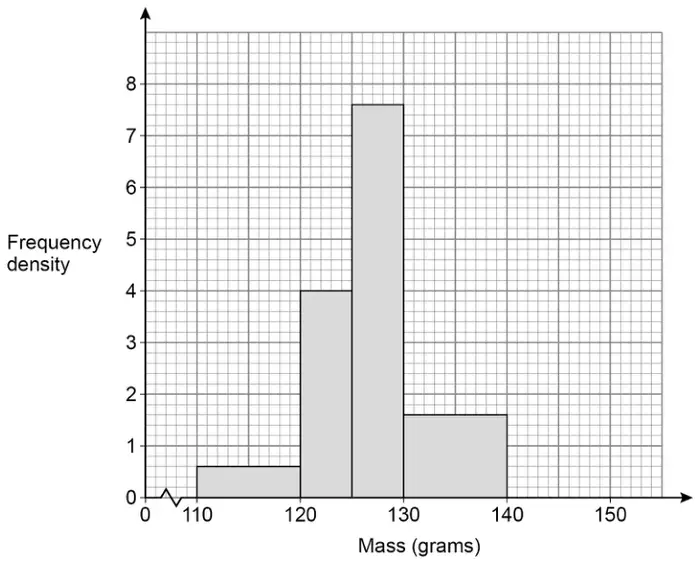
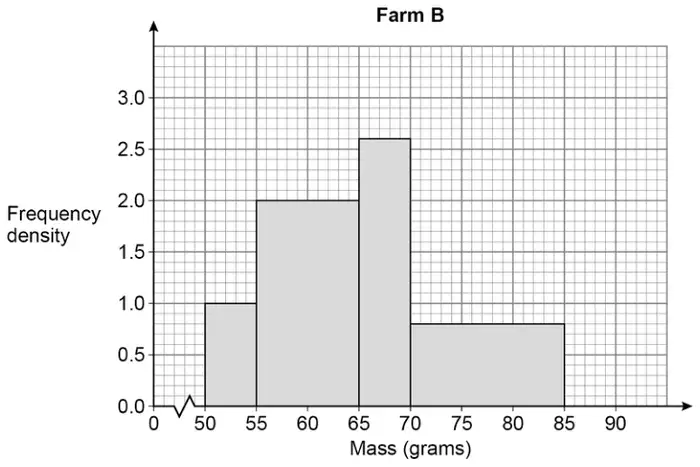
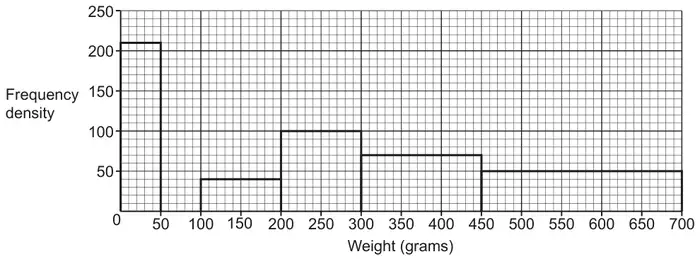
15 The histogram gives information about the weights, in grams, of some biscuits.
One of these biscuits is taken at random.
Work out an estimate for the probability that the biscuit will have a weight between 20 grams and 40 grams. (4)
Mark scheme
Answer
Mark
Mark scheme
\(\dfrac{130}{400}\) oe
M1
for a method to find the frequency (or area) of one relevant interval, eg \(3 \times 10\ (= 30)\) or \(5 \times 20\ (= 100)\) or \(8 \times 15\ (= 120)\) or \(10 \times 15\ (= 150)\) or \(5 \times 10\ (= 50)\) or \(8 \times 10\ (= 80)\)
or, using 1 cm2 = 1 unit, \(3 \times 2\ (= 6)\) or \(5 \times 4\ (= 20)\) or \(8 \times 3\ (= 24)\) or \(10 \times 3\ (= 30)\) or \(5 \times 2\ (= 10)\) or \(8 \times 2\ (= 16)\)
M1
for a method to find the total frequency (or area), eg \(\text{``}30\text{''} + \text{``}100\text{''} + \text{``}120\text{''} + \text{``}150\text{''}\ (= 400)\) or \(\text{``}6\text{''} + \text{``}20\text{''} + \text{``}24\text{''} + \text{``}30\text{''}\ (= 80)\)
M1
for a method to find the frequency (or area) between 20 g and 40 g, eg \(\text{``}50\text{''} + \text{``}80\text{''}\ (= 130)\) or \(\text{``}10\text{''} + \text{``}16\text{''}\ (= 26)\)
A1
for \(\dfrac{130}{400}\) oe
Additional guidance
Evidence for this mark may be seen on the diagram
Accept equivalent methods
For M marks condone use of 2.5 for fd of 3 and/or 4.5 for fd of 5
Accept any equivalent fraction, decimal form, 0.32(5) or 0.33 or percentage form, 32.(5)% or 33%
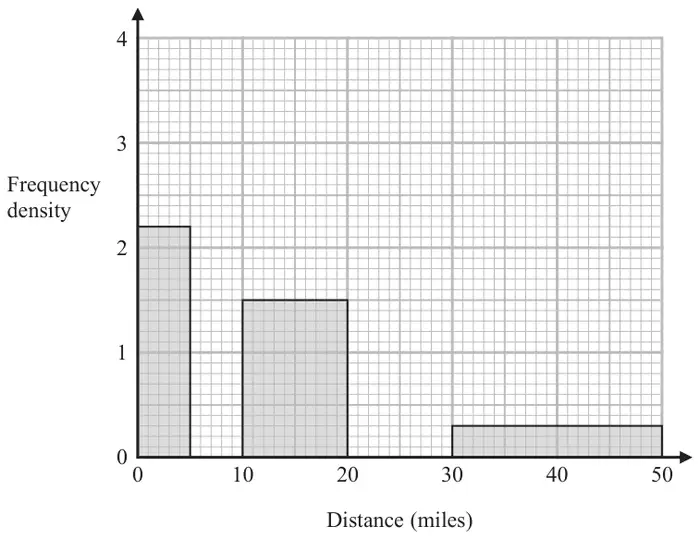
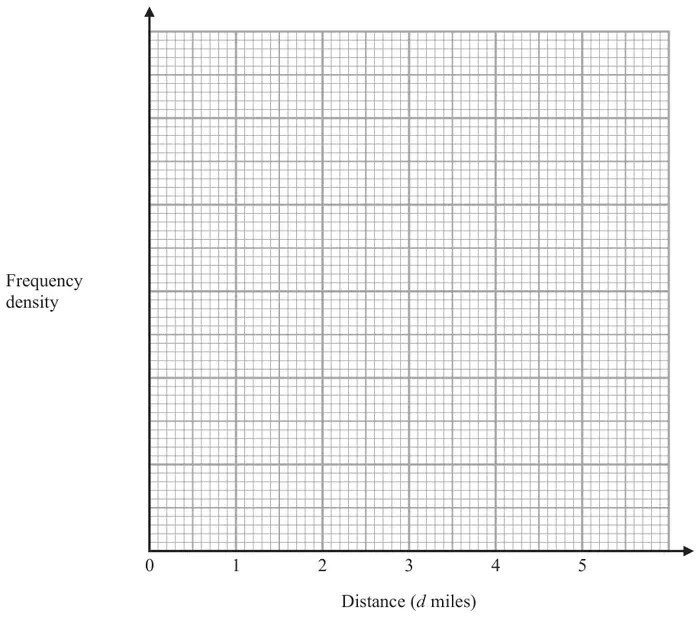
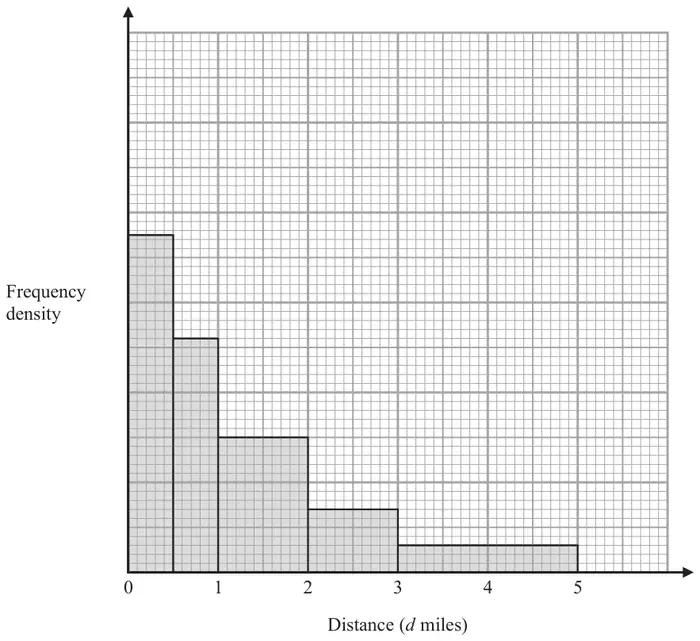
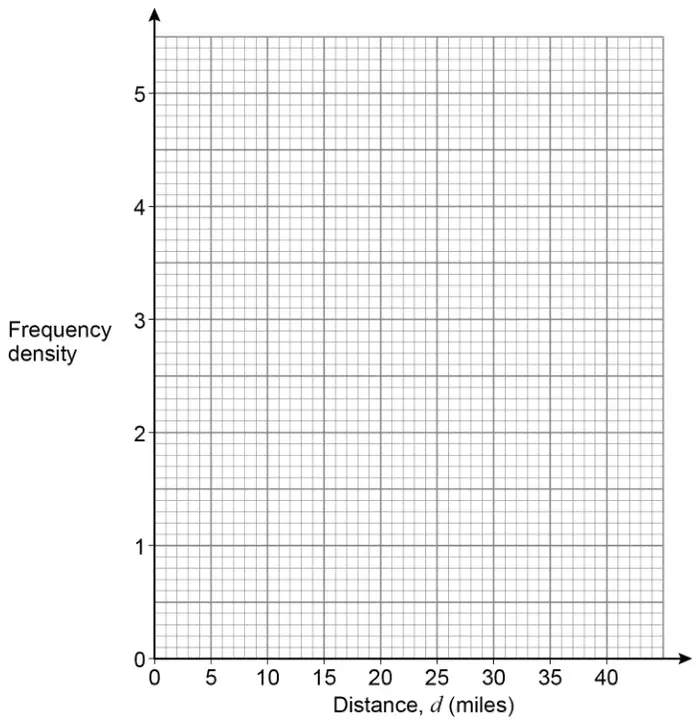
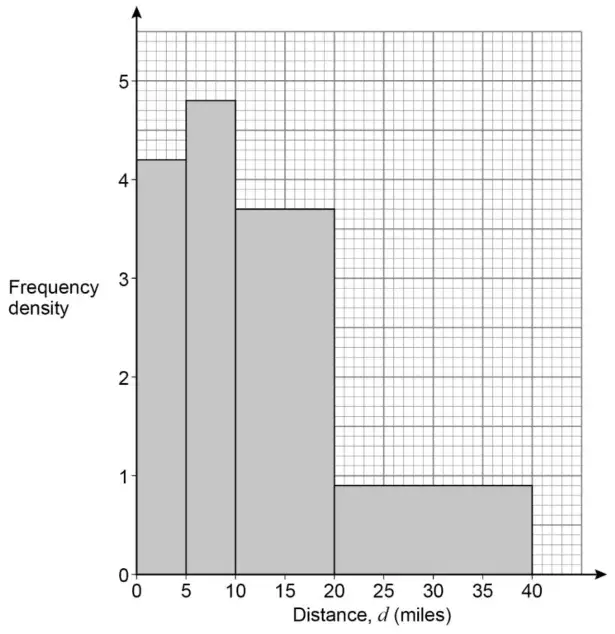
16 The histogram gives information about the distances that 60 teachers travelled to school on Monday. The histogram is incomplete.
11 of the teachers travelled between 0 miles and 5 miles. None of the teachers travelled a distance greater than 50 miles.
The number of teachers who travelled between 5 miles and 10 miles is the same as the number of teachers who travelled between 20 miles and 30 miles.
Complete the histogram. (4)
Mark scheme
Answer
Mark
Mark scheme
Histogram completed
M1
for method to use area to find at least one other frequency (not 11), eg \(10 \times 1.5\ (= 15)\) or \(20 \times 0.3\ (= 6)\)
M1
for method to find unknown frequencies, eg \((60 - 11 - \text{``}15\text{''} - \text{``}6\text{''}) \div 2\ (= 14)\)
M1
ft for method to find an unknown frequency density, eg \(\text{``}14\text{''} \div 5\ (= 2.8)\) or \(\text{``}14\text{''} \div 10\ (= 1.4)\) or one correct bar drawn
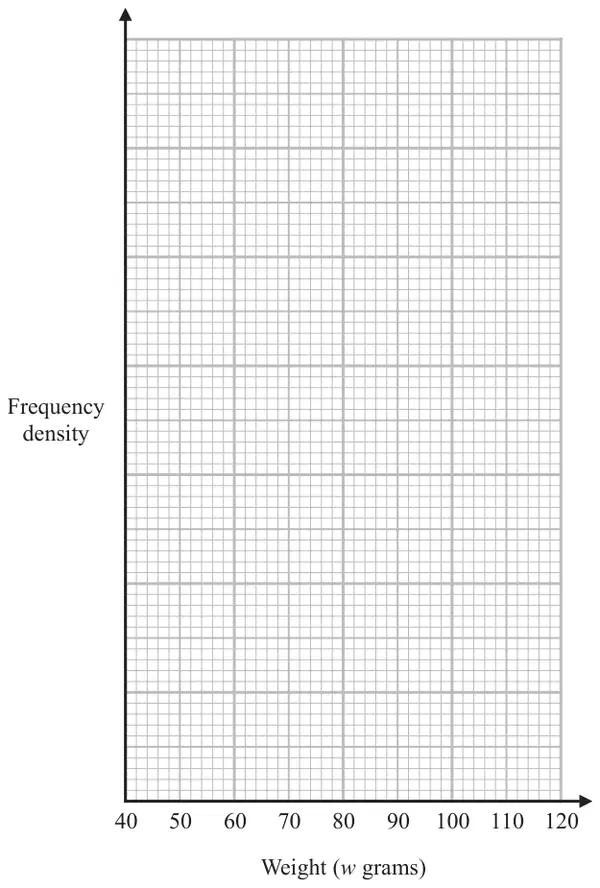
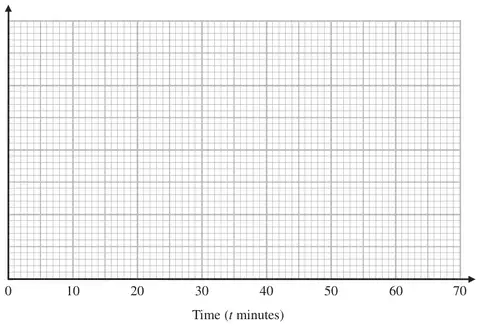
13 The table gives information about the amount of time that each of 150 people were in a shop.
Time (\(t\) minutes)
Frequency
\(0 \lt t \leqslant 10\)
20
\(10 \lt t \leqslant 30\)
70
\(30 \lt t \leqslant 35\)
22
\(35 \lt t \leqslant 50\)
30
\(50 \lt t \leqslant 60\)
8
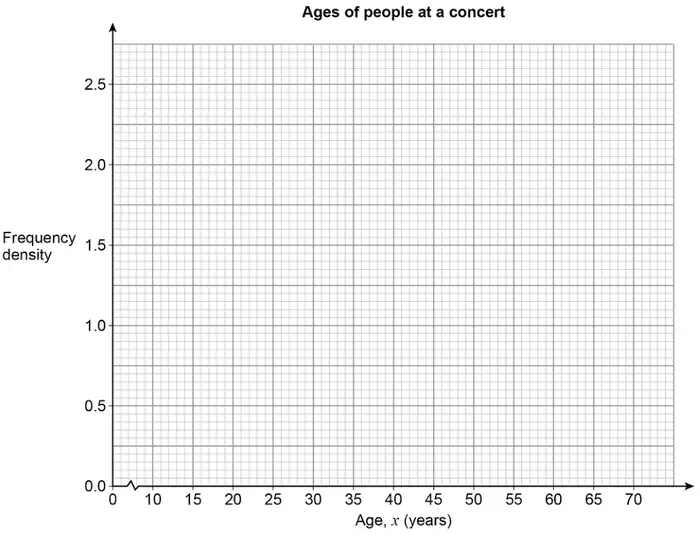
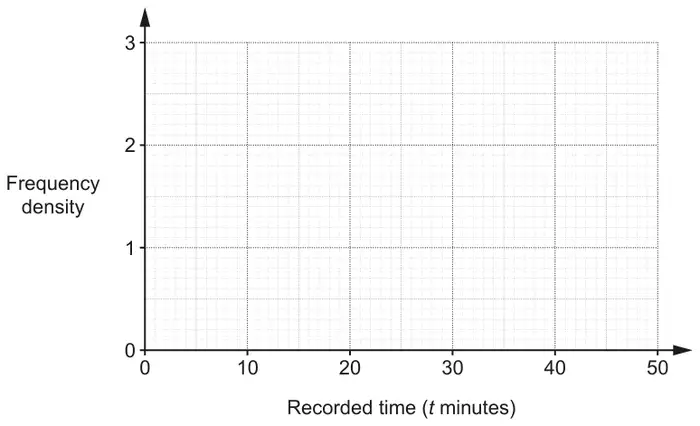
(a) On the grid, draw a histogram for this information.(3)
(b) Work out an estimate for the fraction of these 150 people who were in the shop for between 20 minutes and 40 minutes. (2)
Mark scheme (a)
Answer
Mark
Mark scheme
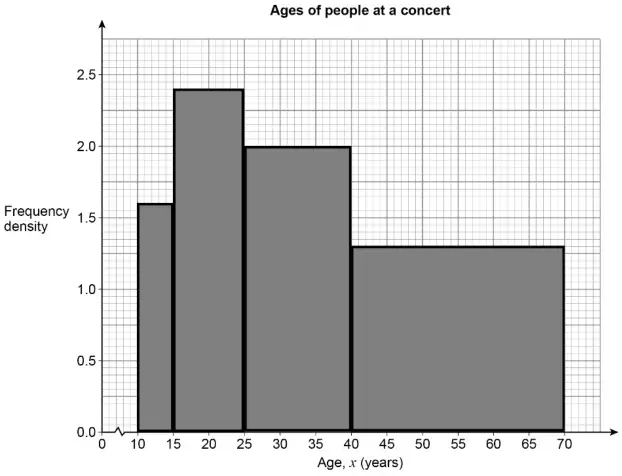
Histogram drawn
B3
for fully correct histogram with axes scaled and labelled
(B2
for 4 correct bars or for frequency \(\div\) class width for all 5 frequencies and 2 correct bars of different widths)
(B1
for 2 correct bars of different widths or for frequency \(\div\) class width for at least 3 frequencies)
Additional guidance
Relative heights 2, 3.5, 4.4, 2, 0.8
Mark scheme (b)
Answer
Mark
Mark scheme
\(\dfrac{67}{150}\)
M1
for a method to find number of people in interval eg \(\dfrac{1}{2} \times 70 + 22 + \dfrac{1}{3} \times 30\ (= 67)\) or \(150 - 20 - 8 - \dfrac{1}{2} \times 70 - \dfrac{2}{3} \times 30\ (= 67)\) or \(10 \times [3.5] + 5 \times [4.4] + 5 \times [2]\) ft their histogram
A1
for \(\dfrac{67}{150}\) or ft their histogram
Additional guidance
Where [3.5], [4.4] and [2] are the heights of the bars of their histogram
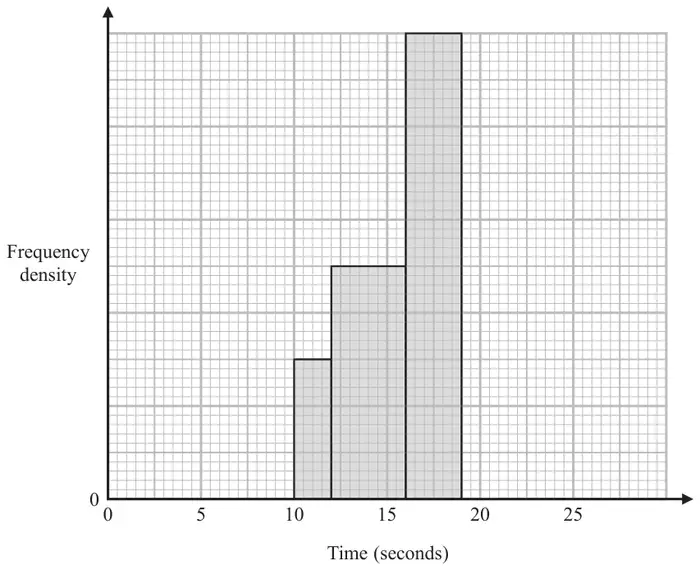
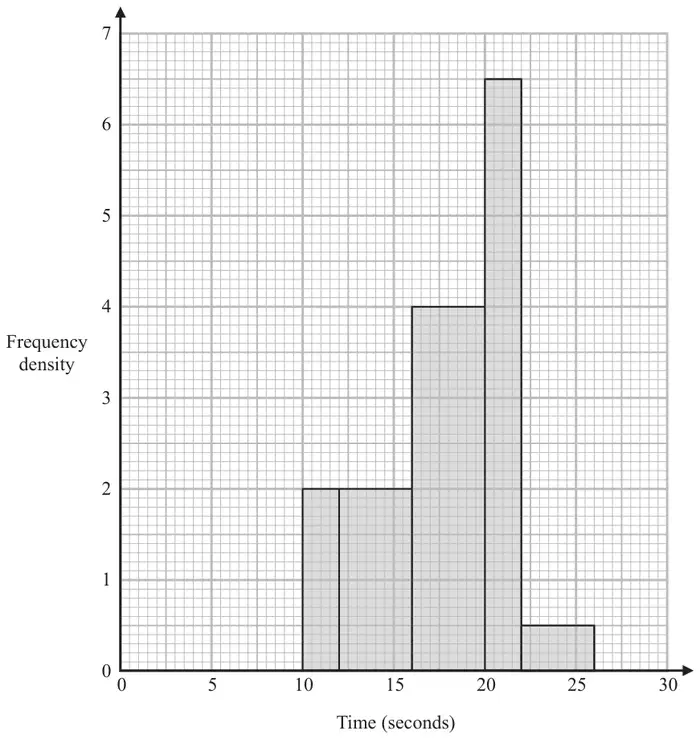
15 The incomplete table and the incomplete histogram give information about the times taken by some students to run a race.
Time (\(t\) seconds)
Frequency
\(10 \lt t \leqslant 12\)
\(12 \lt t \leqslant 16\)
10
\(16 \lt t \leqslant 19\)
15
\(19 \lt t \leqslant 21\)
9
\(21 \lt t \leqslant 26\)
7
None of these students had a time for the race such that \(t \leqslant 10\) or \(t \gt 26\)
(a) Use the histogram to complete the table. (1)
(b) Use the table to complete the histogram. (2)
The histogram below gives information about the times taken by 43 students to run a different race.
(c) Work out an estimate for the median of the times taken by these 43 students to run the race. (3)
Mark scheme (a)
Answer
Mark
Mark scheme
3
B1
for 3 correctly placed in the first row
Mark scheme (b)
Answer
Mark
Mark scheme
Correct bars
B2
for both bars correct, heights of 4.5 and 1.4
(B1
for one bar correct out of a maximum of 2 bars)
Mark scheme (c)
Answer
Mark
Mark scheme
18.5
M1
for finding the area of at least 2 bars eg, \(2 \times 2\ (= 4)\) or \(4 \times 2\ (= 8)\) or \(4 \times 4\ (= 16)\) or \(2 \times 6.5\ (= 13)\) or \(4 \times 0.5\ (= 2)\)
M1
for \((\text{``}43\text{''} + 1) \div 2\ (= 22)\) and \(10 \div 16 \times 4\ (= 2.5)\) or \(\text{``}43\text{''} \div 2\ (= 21.5)\) and \(9.5 \div 16 \times 4\ (= 2.375)\)
A1
For 18.5 or 18.375
Additional guidance
Condone 1 error in reading fd values or measurements.
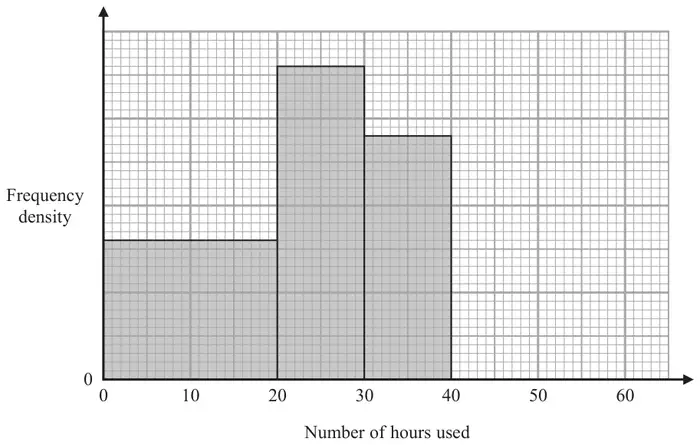
16 The histogram gives information about the number of hours some students used their phones last week. The histogram is incomplete.
28 students used their phones for between 30 and 40 hours. 24 students used their phones for between 40 and 60 hours.
(a) Use this information to complete the histogram. (2)
No student used their phone for more than 60 hours.
(b) Work out the total number of students. (2)
Mark scheme (a)
Answer
Mark
Mark scheme
Bar of height 2.4 cm (fd = 1.2) drawn for interval 40 – 60 hours
M1
for using area to represent frequency, eg 11.2 (cm2) represents 28 (students) or for showing correct scale on fd axis, 2 cm = 1 unit or correct process to find the height of bar, eg \(\dfrac{28}{10}\ (= 2.8)\) or \(\dfrac{24}{20}\ (= 1.2)\)
A1
cao
Additional guidance
May use any unit of area. Can be implied by frequency of 32 or 36.
Can ignore scale if bar is correct
Mark scheme (b)
Answer
Mark
Mark scheme
120
M1
ft their histogram for method to find total frequency, eg \((1.6 \times 20) + (3.6 \times 10) + 28 + 24\) oe or for method to find total area under the histogram, eg \((4 \times 3.2) + (2 \times 7.2) + (2 \times 5.6) + (4 \times 2.4)\ (= 48)\) oe
A1
for 120 ft
Additional guidance
Condone 1 error in reading fd values or measurements.
for 4 correct bars or for frequency \(\div\) class interval for all 5 frequencies and 2 correct bars of different widths)
(B1
for 2 correct bars of different widths or for frequency \(\div\) class interval for at least 3 frequencies)
Mark scheme (b)
Answer
Mark
Mark scheme
\(0.4n\)
M1
for finding ratio of heights or widths of bars, eg \(5 : 1\) or \(\dfrac{1}{5}\), \(1 : 2\) or \(\dfrac{n}{5}\) oe or \(2n\) oe as answer or compares areas of bars, eg 6 and 2.4 or 3 and 1.2 or 150 and 60
A1
for \(0.4n\) oe
Additional guidance
Evidence for this mark may be seen on the diagram Any 2 numbers in the ratio \(2.5 : 1\) score M1
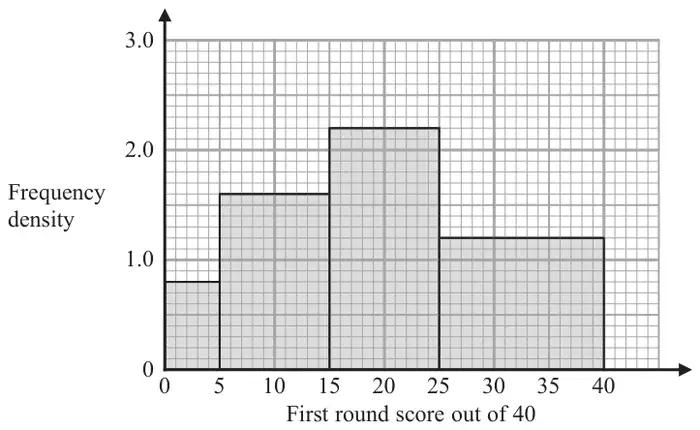
17 Some people took part in the first round of a competition.
The histogram gives information about the scores of these people in the first round.
20% of the people got a score high enough for them to qualify for the second round.
Work out an estimate for the score needed to qualify for the second round. You must show all your working. (4)
Mark scheme
Answer
Mark
Mark scheme
30
P1
for process to find one correct frequency, eg. \(0.8 \times 5\ (= 4)\) or \(1.6 \times 10\ (= 16)\) or \(2.2 \times 10\ (= 22)\) or \(1.2 \times 15\ (= 18)\)
or to find one correct area eg \(5 \times 8\ (= 40)\) or \(10 \times 16\ (= 160)\) or \(10 \times 22\ (= 220)\) or \(15 \times 12\ (= 180)\)
P1
for process to find total number of people, eg. \(\text{``}4\text{''} + \text{``}16\text{''} + \text{``}22\text{''} + \text{``}18\text{''}\ (= 60)\)
or for process to find total area eg \(\text{``}40\text{''} + \text{``}160\text{''} + \text{``}220\text{''} + \text{``}180\text{''}\ (= 600)\)
P1
for process to find 20% of the total number of people, eg. \(\text{``}60\text{''} \times 0.2\) oe \((= 12)\) or for process to find 20% of the total area \(\text{``}600\text{''} \times 0.2\) oe \((= 120)\)
A1
cao
Additional guidance
Accept equivalent methods proportional to those shown.
Condone 1 error in reading from the graph for 2nd and 3rd P marks
NB: correct answer without supportive working gets 0 marks
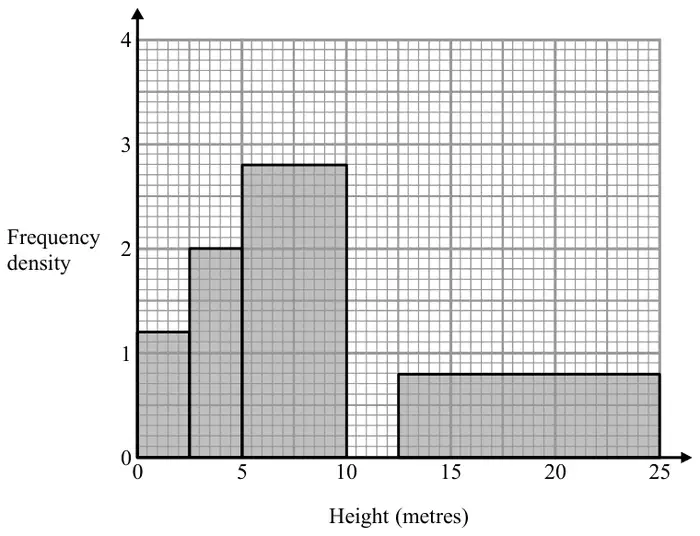
18 The histogram gives information about the heights, in metres, of the trees in a park. The histogram is incomplete.
20% of the trees in the park have a height between 10 metres and 12.5 metres. None of the trees in the park have a height greater than 25 metres.
Complete the histogram. (3)
Mark scheme
Answer
Mark
Mark scheme
Bar of height 3.2
M1
method to find any frequency eg \(1.2 \times 2.5\ (= 3)\) or \(2 \times 2.5\ (= 5)\) or \(2.8 \times 5\ (= 14)\) or \(0.8 \times 12.5\ (= 10)\) or method to use areas eg \(12 \times 5\ (= 60)\) or \(20 \times 5\ (= 100)\) or \(28 \times 10\ (= 280)\) or \(8 \times 25\ (= 200)\)
M1
complete method to find total frequency for the four intervals eg \(\text{``}3\text{''} + \text{``}5\text{''} + \text{``}14\text{''} + \text{``}10\text{''}\ (= 32)\) or \(\text{``}60\text{''} + \text{``}100\text{''} + \text{``}280\text{''} + \text{``}200\text{''}\ (= 640)\)
C1
cao
Additional guidance
Accept equivalent methods proportional to those shown
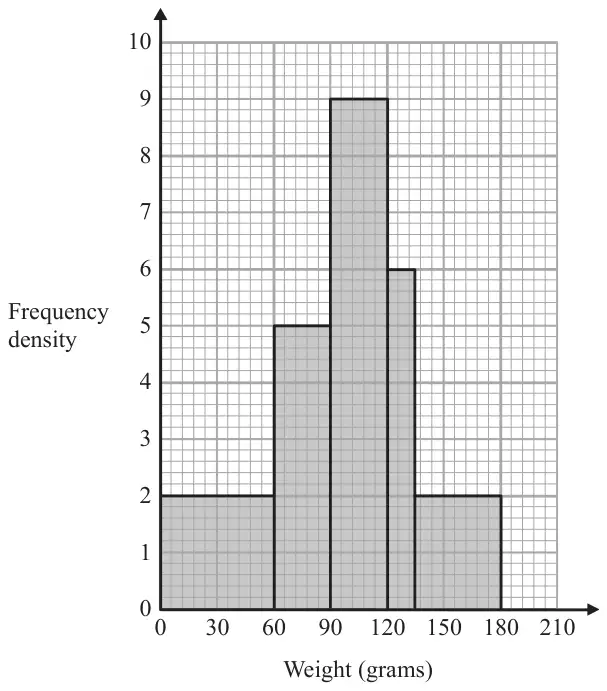
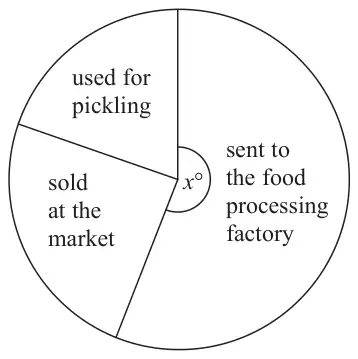
21 The histogram gives information about the distribution of the weights of some onions grown by a farmer.
Onions less than 60 grams in weight are used for pickling. Onions greater than 120 grams in weight are sold at the market. The rest of the onions are sent to a food processing factory.
A pie chart is drawn using the information above to show what the farmer does with the onions he grows.
The angle of the sector for the onions sent to the food processing factory is \(x^\circ\).
Work out the value of \(x\). (4)
Mark scheme
Answer
Mark
Mark scheme
210
M1
for method to find total frequency, \(60 \times 2\ (= 120) + 30 \times 5\ (= 150) + 30 \times 9\ (= 270) + 15 \times 6\ (= 90) + 45 \times 2\ (= 90)\) or 720 OR for method to find the total area, \(4 + 5 + 9 + 3 + 3\) (= 24 cm2)
M1
for finding the number of onions less than 60 g or greater than 120 g = \(120 + 90 + 90\ (= 300)\), OR for finding the number of onions between 60 g and 120 g = \(150 + 270\ (= 420)\) OR for finding the area under the graph less than 60 or greater than 120 = \(4 + 3 + 3\) (= 10 cm2) OR for finding the area under the graph between 60 and 120 = \(5 + 9\) (= 14 cm2)
M1
(dep M2) for \(1 - \dfrac{\text{``}300\text{''}}{\text{``}720\text{''}}\ \left(= \dfrac{7}{12}\right)\) oe OR for \(\dfrac{\text{``}420\text{''}}{\text{``}720\text{''}}\ \left(= \dfrac{7}{12}\right)\) oe OR for \(\dfrac{\text{``}14\text{''}}{\text{``}24\text{''}}\ \left(= \dfrac{7}{12}\right)\) oe
A1
cao
Additional guidance
Accept one error in total for the award of the method marks 24 must be from adding areas of bars not heights of bars
14 must be from adding areas of bars not heights of bars
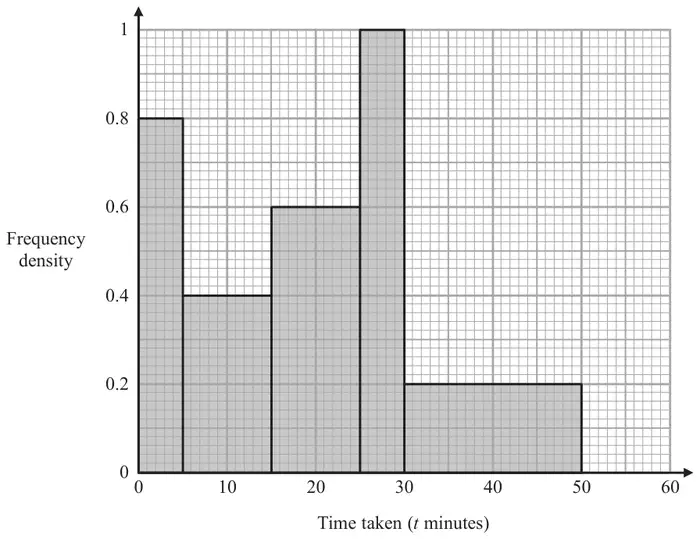
17 The histogram shows information about the times taken by some students to finish a puzzle.
(a) Complete the frequency table for this information.
Time taken (\(t\) minutes)
Frequency
\(0 \lt t \leqslant 5\)
4
\(5 \lt t \leqslant 15\)
\(15 \lt t \leqslant 25\)
\(25 \lt t \leqslant 30\)
\(30 \lt t \leqslant 50\)
(2)
(b) Find an estimate for the lower quartile of the times taken to finish the puzzle. (2)
Mark scheme (a)
Answer
Mark
Mark scheme
4, 6, 5, 4
M1
for a correct method to find at least 2 frequencies from bars of different widths, eg \(10 \times 0.4\) (=4), \(10 \times 0.6\) (=6), \(5 \times 1\) (=5), \(20 \times 0.2\) (=4)
A1
cao
Mark scheme (b)
Answer
Mark
Mark scheme
10
M1
for \(\dfrac{23 + 1}{4}\) (=6) or \(\dfrac{23}{4}\) (=5.75) could ft from their table in (a)
A1
for 10 or 9.375
Additional guidance
Be aware of 10 coming from incorrect working ft does not apply to the A1
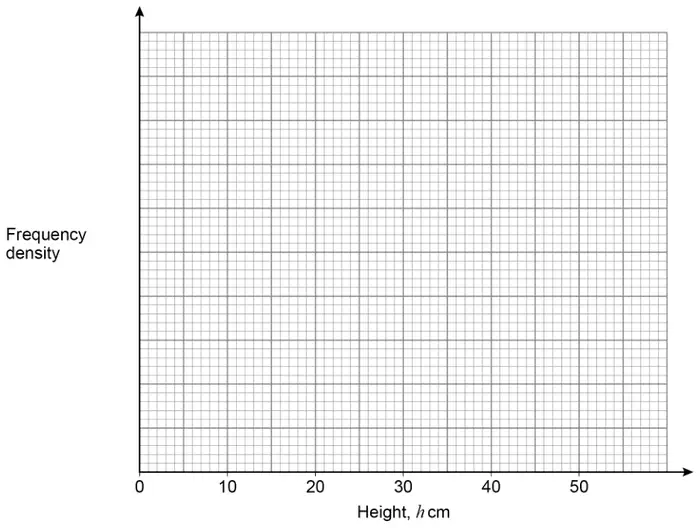
17 The table gives information about the heights of 150 students.
Height (\(h\) cm)
Frequency
\(140 \lt h \leqslant 150\)
15
\(150 \lt h \leqslant 155\)
30
\(155 \lt h \leqslant 160\)
51
\(160 \lt h \leqslant 165\)
36
\(165 \lt h \leqslant 180\)
18
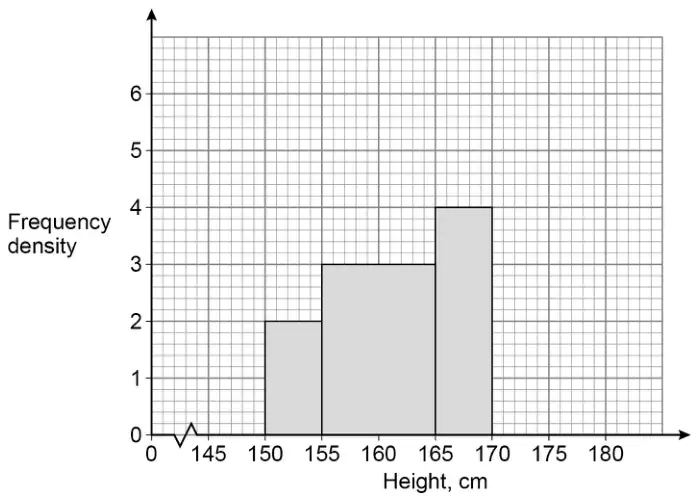
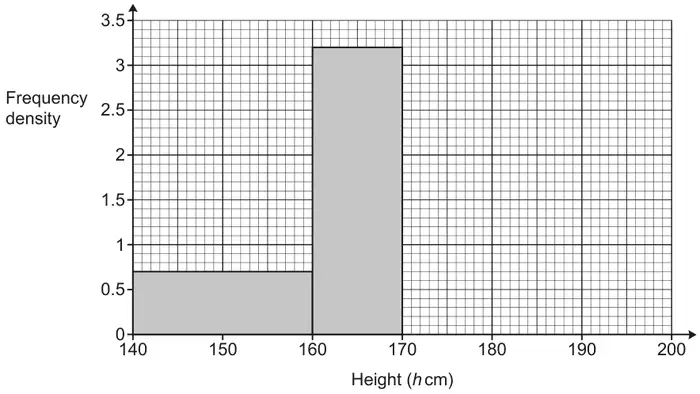
(a) On the grid, draw a histogram for this information.(3)
(b) Work out an estimate for the fraction of the students who have a height between 150 cm and 170 cm. (2)
Mark scheme (a)
Working
Answer
Mark
Notes
1.5, 6, 10.2, 7.2, 1.2
Histogram drawn
C1
for 2 correct bars of different widths or at least 3 correct frequency densities.
C1
for all bars in correct proportions or 4 correct bars with axes scaled and labelled.
C1
for fully correct histogram with axes scaled and labelled.
Mark scheme (b)
Answer
Mark
Notes
\(\dfrac{123}{150}\)
M1
for a method to find number of students in interval, eg \(30 + 51 + 36 + \dfrac{1}{3} \times 18\ (= 123)\) or \(150 - 15 - \dfrac{2}{3} \times 18\ (= 123)\)
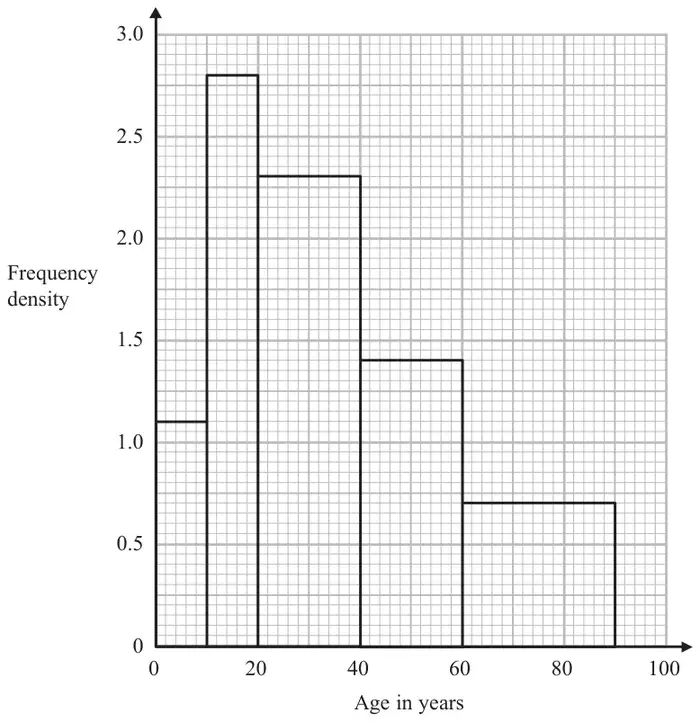
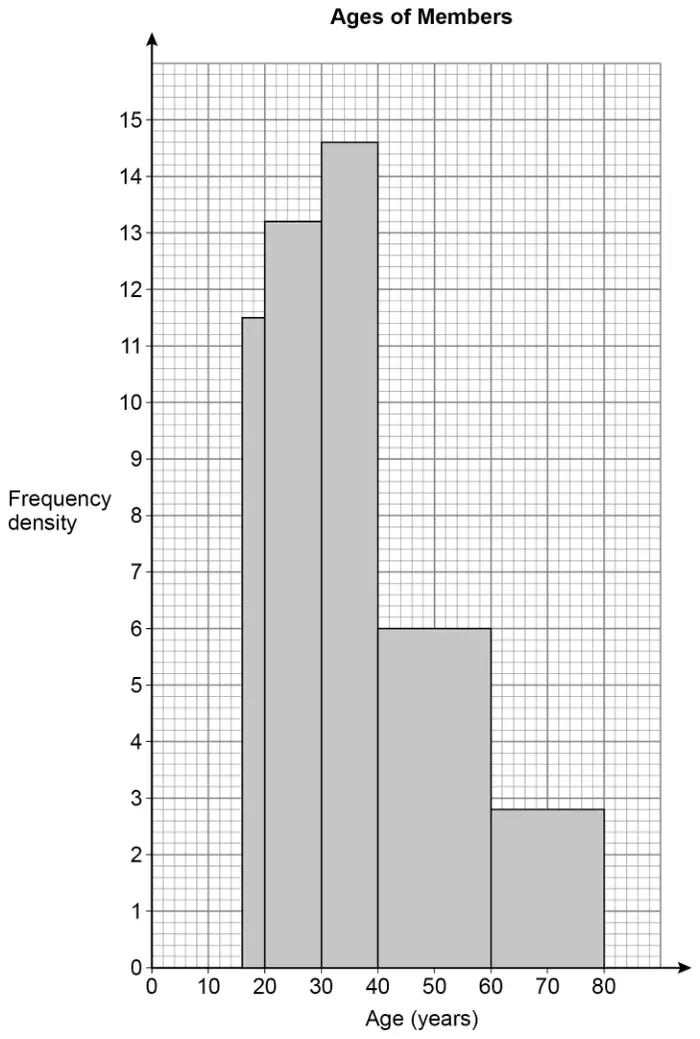
13 The histogram shows some information about the ages of the 134 members of a sports club.
20% of the members of the sports club who are over 50 years of age are female.
Work out an estimate for the number of female members who are over 50 years of age. (3)
Mark scheme
Answer
Mark
Notes
7
P1
for correct process to find any frequency, eg. \(\text{``}1.1\text{''} \times 10\ (= 11)\) or \(\text{``}2.8\text{''} \times 10\ (= 28)\) or \(\text{``}2.3\text{''} \times 20\ (= 46)\) or \(\text{``}1.4\text{''} \times 20\ (= 28)\) or \(\text{``}1.4\text{''} \times 10\ (= 14)\) or \(\text{``}0.7\text{''} \times 30\ (= 21)\) or for a correct process to find the total area and an area of any block, eg. using 1 cm2 = 1 unit of area to get 53.6 and one of 4.4, 11.2, 18.4, 11.2, 5.6, 8.4
P1
(dep P1) for complete process to find 20% of \((\text{``}1.4\text{''} \times 10 + \text{``}0.7\text{''} \times 30)\), eg. \(\dfrac{20}{100} \times \text{``}35\text{''}\) or \(\dfrac{\text{``}5.6\text{''} + \text{``}8.4\text{''}}{\text{``}53.6\text{''}} \times 134 \times \dfrac{20}{100}\)
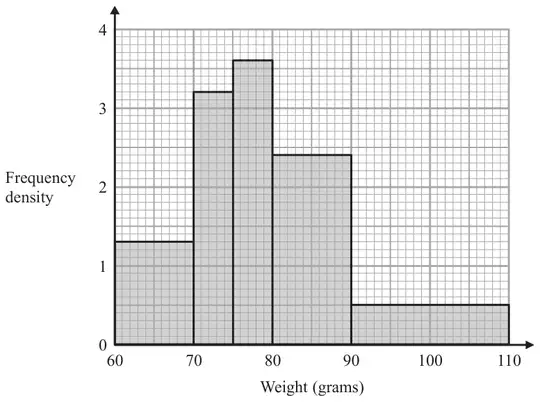
23 The histogram shows information about the weights, in grams, of some plums.
Work out an estimate for the proportion of these plums with a weight of less than 100 grams. (3)
Mark scheme
Answer
Mark
Notes
0.94 or 94% or \(\dfrac{76}{81}\)
3
M1 for method to work out total area eg \(1.3 \times 10 + 3.2 \times 5 + 3.6 \times 5 + 2.4 \times 10 + 0.5 \times 20\) (=81) or area up to 100 grams eg \(1.3 \times 10 + 3.2 \times 5 + 3.6 \times 5 + 2.4 \times 10 + 0.5 \times 10\) (=76) (In either case allow one error in reading a bar height) M1 for \(1 - ((0.5 \times 10) / \text{``}81\text{''})\) oe or for method to work out the total area and the area up to 100 grams (In both cases allow one error in reading a bar height) A1 for answer in range 0.938 to 0.94 or 93.8% to 94% or \(\dfrac{76}{81}\) oe
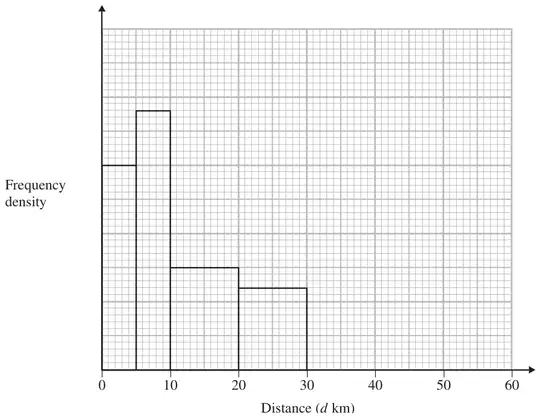
23 The incomplete histogram and table give some information about the distances some people travel to work.
(i) Use the information in the histogram to complete the frequency table.
Distance (\(d\) km)
Frequency
\(0 \lt d \leqslant 5\)
30
\(5 \lt d \leqslant 10\)
\(10 \lt d \leqslant 20\)
\(20 \lt d \leqslant 30\)
24
\(30 \lt d \leqslant 50\)
16
(ii) Use the information in the table to complete the histogram.
(3)
Mark scheme
Answer
Mark
Notes
(i) 38 30
3
M1 for evidence of frequency density calculation, eg 6 on the frequency density axis for the height of the first column or 5 is 1 cm\(^2\) can be implied by 30 as the second missing frequency A1 for 38 and 30
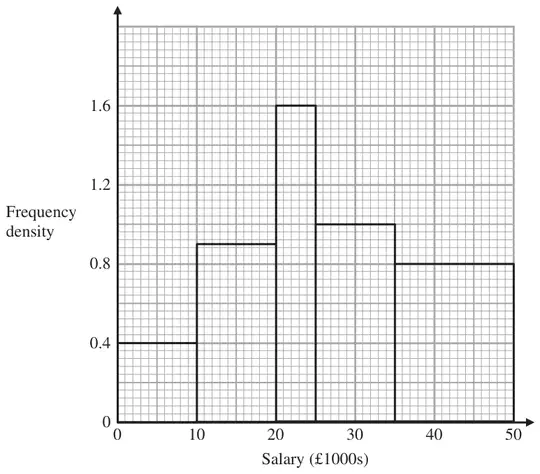
26 The histogram shows some information about the salaries of a sample of people.
(a) Use the histogram to complete the frequency table.
Salary (\(p\)) in £1000s
Frequency
\(0 \lt p \leqslant 10\)
4
\(10 \lt p \leqslant 20\)
\(20 \lt p \leqslant 25\)
\(25 \lt p \leqslant 35\)
\(35 \lt p \leqslant 50\)
(2)
(b) Work out the proportion of people in the sample who have a salary greater than £40 000 (2)
(c) Find an estimate for the median salary. (2)
Mark scheme (a)
Answer
Mark
Notes
(4), 9, 8, 10, 12
2
M1 for correct calculation to find one frequency e.g. \(0.9 \times 10\) or \(1.6 \times 5\) or \(1 \times 10\) or \(0.8 \times 15\) or for one frequency correct or shows that 1 cm\(^2\) = 1 A1 for all frequencies correct
Mark scheme (b)
Answer
Mark
Notes
\(\dfrac{8}{43}\)
2
M1 for 8 (people) or \(\tfrac{2}{3}\) of “12” A1ft for 8 out of 43 stated as a percentage or fraction or decimal
Mark scheme (c)
Answer
Mark
Notes
26000
2
M1 ft for finding the interval in which the “21.5th” or “22nd” value lies or 26 or 25.5 A1 for 26000 or 25500
M1 for \(fx\) consistently within interval including ends (allow 1 error) M1 consistently using appropriate midpoints M1 (dep on first M1) for \(\Sigma fx \div \Sigma f\) A1 for 18.2 cao
Mark scheme (b)
Working
Answer
Mark
Notes
\(0 \leqslant t \lt 10\) fd 0.8 \(10 \leqslant t \lt 15\) fd 3 \(15 \leqslant t \lt 20\) fd 2.2 \(20 \leqslant t \lt 30\) fd 1 \(30 \leqslant t \lt 50\) fd 0.3
Correct histogram
3
B3 fully correct histogram with vertical axis correctly scaled. (B2 for 4 correct blocks or 5 correct blocks with incorrect or no scale) (B1 for 2 correct blocks of different widths or any 3 correct blocks or correct FD values for at least 3 frequencies) eg fd of 0.8, 3, 2.2, 1, 0.3
M1 for attempt to work out total area (eg =600) or area greater than 60 (eg =72) by using fd or counting squares M1 (dep) for \(\dfrac{\text{‘}72\text{’}}{\text{‘}600\text{’}} \times 100\) oe (=12) A1 cao (must have % otherwise 2 marks)
B3 for fully correct histogram (B2 for 4 correct blocks) (B1 for 3 correct blocks) (If B0, SC B1 for correct key eg 1cm² = 2 (calls) Or frequency ÷ class interval for at least 3 frequencies) NB Apply the same mark scheme if a different frequency density is used.
M1 for a method to find the frequency or the area of any one block M1 for a method (with correct values) to find total area of all blocks or 44.4 or 1110 or a correct method (with correct values) to find total area of middle 3 blocks or 32.4 or 810 M1 (dep on M2) for a correct method to find required proportion (could lead to a decimal or a percentage or a fraction) A1 for answer which rounds to 0.73 or 73% or \(\frac{27}{37}\) or equivalent fraction
24 The table gives information about the heights, \(h\) metres, of trees in a wood.
Height (\(h\) metres)
Frequency
\(0 \lt h \leqslant 2\)
7
\(2 \lt h \leqslant 4\)
14
\(4 \lt h \leqslant 8\)
18
\(8 \lt h \leqslant 16\)
24
\(16 \lt h \leqslant 20\)
10
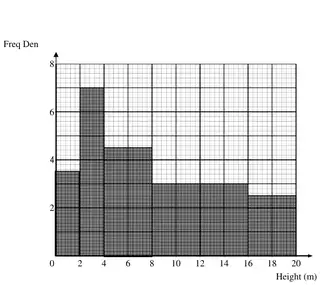
Draw a histogram to show this information. (3)
Mark scheme
Working
Answer
Mark
Notes
Height \(h\) m
Freq
FD
\(0 \lt h \leqslant 2\)
7
3.5
\(2 \lt h \leqslant 4\)
14
7
\(4 \lt h \leqslant 8\)
18
4.5
\(8 \lt h \leqslant 16\)
24
3
\(16 \lt h \leqslant 20\)
10
2.5
Correct histogram
3
B3 fully correct histogram with horizontal axis correctly scaled (B2 for 4 correct blocks or 5 correct blocks with incorrect or no scale ) (B1 for 2 correct blocks of different widths or any 3 correct blocks) SC : B1 for key, eg. 1 cm2 = 2 (trees) or correct values shown for (freq ÷ class interval) for at least 3 frequencies (3.5, 7, 4.5, 3, 2.5)
Notes
(corrected from the printed mark scheme: the Answer column is printed as “3”)
22 The table gives some information about the speeds, in km/h, of 100 cars.
Speed (\(s\) km/h)
Frequency
\(60 \lt s \leqslant 65\)
15
\(65 \lt s \leqslant 70\)
25
\(70 \lt s \leqslant 80\)
36
\(80 \lt s \leqslant 100\)
24
(a) On the grid, draw a histogram for the information in the table.(3)
(b) Work out an estimate for the number of cars with a speed of more than 85 km/h. (2)
Mark scheme (a)
Working
Answer
Mark
Notes
F
15
25
36
24
Fd
3
5
3.6
1.2
Correct histogram
3
B3 for fully correct histogram (overlay) (B2 for 3 correct blocks) (B1 for 2 correct blocks of different widths) SC : B1 for correct key, eg. 1 cm2 = 5 (cars) or correct values for (freq ÷ class interval) for at least 3 frequencies (3, 5, 3.6, 1.2) NB: The overlay shows one possible histogram, there are other correct solutions.
Mark scheme (b)
Working
Answer
Mark
Notes
\(\frac{3}{4} \times 24\)
18
2
M1 for \(\frac{3}{4} \times 24\) (=18) oe or \(\frac{1}{4} \times 24\) (=6) oe A1 cao OR M1 ft histogram for 15 × “1.2” or 5 × “1.2” A1 ft
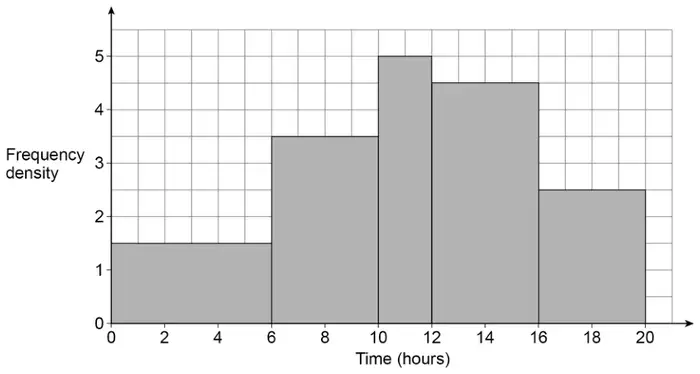
23 61 students recorded how many hours they spent revising for a test.
The histogram represents the results.
(a) Work out an estimate of the mean time the 61 students spent revising.
You may use the table to help you. [4 marks]
Time, \(x\) (hours)
Frequency
Midpoint
\(0 \leqslant x \lt 6\)
\(6 \leqslant x \lt 10\)
\(10 \leqslant x \lt 12\)
\(12 \leqslant x \lt 16\)
\(16 \leqslant x \lt 20\)
(b) Give a reason why the answer to part (a) is an estimate. [1 mark]
Mark scheme (a)
Answer
Mark
Comments
\(1.5 \times 6\) or 9 or \(3.5 \times 4\) or 14 or \(5 \times 2\) or 10 or \(4.5 \times 4\) or 18 or \(2.5 \times 4\) or 10
M1
oe values 9, 14, 10 or 18 must be in the correct row in the table or linked to the correct bar on the histogram
\(1.5 \times 6 \times 3\) or \(9 \times 3\) or 27 or \(3.5 \times 4 \times 8\) or \(14 \times 8\) or 112 or \(5 \times 2 \times 11\) or \(10 \times 11\) or 110 or \(4.5 \times 4 \times 14\) or \(18 \times 14\) or 252 or \(2.5 \times 4 \times 18\) or \(10 \times 18\) or 180 or 681
M1dep
oe values 27, 112, 110, 252 or 180 must be in the correct row in the table
(their 27 + their 112 + their 110 + their 252 + their 180) ÷ (their 9 + their 14 + their 10 + their 18 + their 10) or \(681 \div 61\)
M1dep
oe full correct method eg (their 27 + their 112 + their 110 + their 252 + their 180) \(\div\) 61
[11.16, 11.2]
A1
accept 11 with M3 scored and no errors
Additional guidance
Up to M2 may be awarded for correct work with no answer, or incorrect answer, even if this is seen amongst multiple attempts
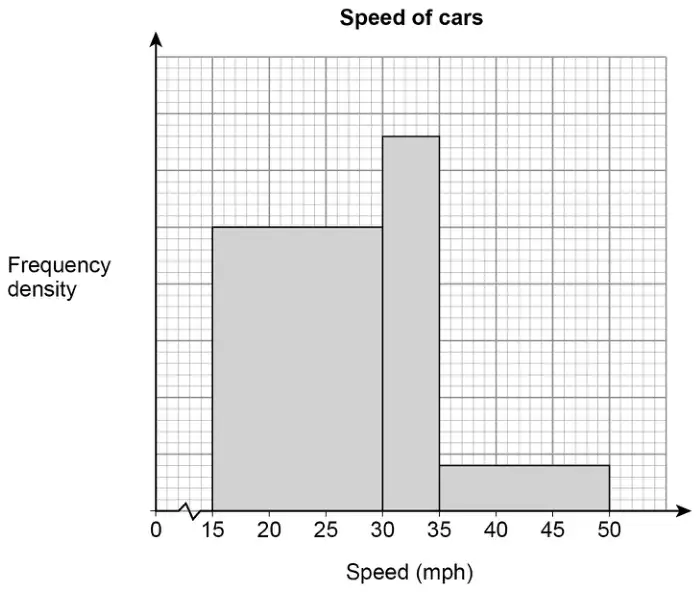
26 The histogram shows information about the speed of cars as they pass a checkpoint.
The scale on the frequency density axis is missing.
The histogram shows information about 480 cars.
(a) How many cars does the first bar represent? [4 marks]
(b) Cars with a speed greater than 40 mph are over the speed limit.
Use the histogram to estimate the number of cars that are over the speed limit. [2 marks]
Mark scheme (a)
Answer
Mark
Comments
Alternative method 1 – Counting squares
15 or 6.6 or 2.4 (cm squares)
M1
375 or 165 or 60 (small squares)
their 15 + their 6.6 + their 2.4 or 24 (total cm squares)
M1dep
allow one error their 375 + their 165 + their 60 or 600 (total small squares)
\(\dfrac{\text{their } 15}{\text{their } 24}\) or \(\dfrac{\text{their } 375}{\text{their } 600}\) or 0.625 or \(\dfrac{480}{\text{their } 600}\) or 0.8 (cars per small square) or \(\dfrac{480}{\text{their } 24}\) or 20 (cars per cm square)
M1dep
oe
\(\dfrac{\text{their } 600}{480}\) or 1.25 (small squares per car) \(\dfrac{\text{their } 24}{480}\) or 0.05 (cm square per car)
300
A1
Alternative method 2 – Using f.d. scale of \(x\) per unit
\(5x \times 15\) or \(75x\) or \(6.6x \times 5\) or \(33x\) or \(0.8x \times 15\) or \(12x\) (\(x\) per cm)
M1
\(25x \times 15\) or \(375x\) or \(33x \times 5\) or \(165x\) or \(4x \times 15\) or \(60x\) (\(x\) per small square)
\(5x \times 15 + 6.6x \times 5 + 0.8x \times 15\) or \(75x + 33x + 12x\) or \(120x\) (\(x\) per cm)
M1dep
allow one error \(25x \times 15 + 33x \times 5 + 4x \times 15\) or \(375x + 165x + 60x\) or \(600x\) (\(x\) per small square)
their \(120x = 480\) or \(x = 4\)
M1dep
oe \(\dfrac{480}{\text{their } 120}\) or 4
300
A1
Alternative method 3 – Using a number scale of f.d. axis
\(5 \times 15\) or 75 or \(6.6 \times 5\) or 33 or \(0.8 \times 15\) or 12
M1
\(25 \times 15\) or 375 or \(33 \times 5\) or 165 or \(4 \times 15\) or 60
\(5 \times 15 + 6.6 \times 5 + 0.8 \times 15\) or \(75 + 33 + 12\) or 120 (1 per cm)
M1dep
allow one error \(25 \times 15 + 33 \times 5 + 4 \times 15\) or \(375 + 165 + 60\) or 600 (1 per small square)
\(\dfrac{\text{their } 15}{\text{their } 24}\) or \(\dfrac{\text{their } 375}{\text{their } 600}\) or 0.625 or \(\dfrac{480}{\text{their } 600}\) or 0.8 (cars per small square) or \(\dfrac{480}{\text{their } 24}\) or 20 (cars per cm square)
M1dep
oe
\(\dfrac{\text{their } 600}{480}\) or 1.25 (small squares per car) \(\dfrac{\text{their } 24}{480}\) or 0.05 (cm square per car)
300
A1
Additional guidance
Check diagram for working
Alternative method 1 Total squares must be the sum of three numbers
Alternative method 2 Must be the sum of three expressions
The correct f.d. labels for the heights of the bars are 20, 26.4 and 3.2
A correct frequency density scale using 1 cm = 4 units eg
4 seen on vertical scale at 1 cm
M1M1M1
20 seen on vertical scale at 5 cm
M1M1M1
Mark scheme (b)
Answer
Mark
Comments
\(\dfrac{2}{3} \times 2.4\) or 1.6 or \(\dfrac{2}{3} \times 60\) or 40 or \(\dfrac{2}{3} \times 48\) or \(10 \times 0.8 \times 4\)
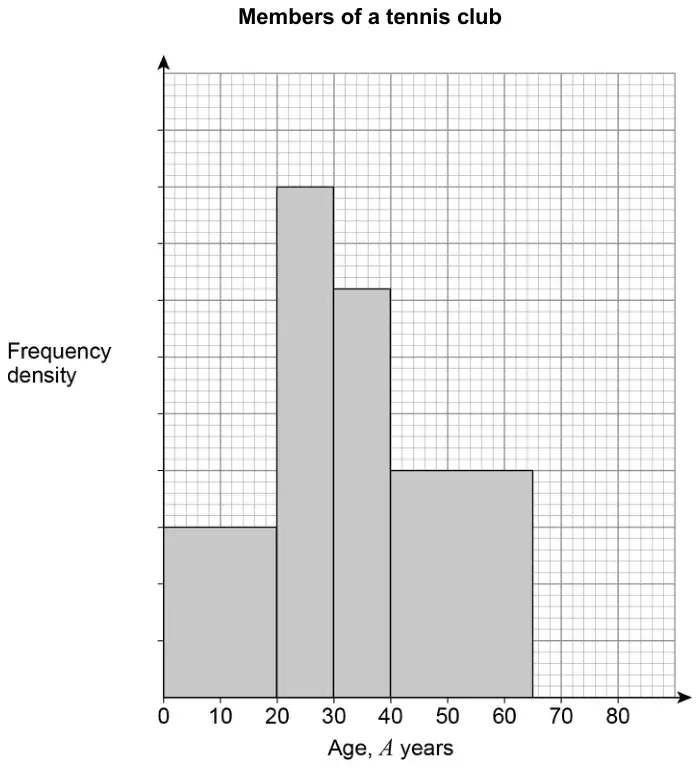
There are 30 members with \(A \lt 20\) There are 12 members with \(65 \leqslant A \lt 80\) There are no members with \(A \geqslant 80\)
(a) Complete the histogram. [3 marks]
(b) Work out the total number of members of the club. [2 marks]
Mark scheme (a)
Answer
Mark
Comments
Alternative method 1
\(30 \div 20\) or 1.5
M1
May be implied by correct labelling on vertical axis
\(12 \div 15\) or 0.8
M1
Draws block for \(65 \leqslant x \lt 80\) with height 8 small squares
A1
Mark intention
Alternative method 2
\(12 \div (30 \div 6)\) or \(12 \div 5\) or 2.4
M1
their \(2.4 \div 1.5\) or 1.6
M1dep
Draws block for \(65 \leqslant x \lt 80\) with height 8 small squares
A1
Mark intention
Alternative method 3
\(12 \div (30 \div 150)\) or \(12 \div 0.2\) or 60
M1
their \(60 \div 7.5\) or 8
M1dep
Draws block for \(65 \leqslant x \lt 80\) with height 8 small squares
A1
Mark intention
Alternative method 4
\(1.5 \times (30 \div 6)\) or \(1.5 \times 5\) or 7.5
M1
\(12 \div\) their 7.5 or 1.6
M1dep
Draws block for \(65 \leqslant x \lt 80\) with height 8 small squares
A1
Mark intention
Additional guidance
Draws block for \(65 \leqslant x \lt 80\) with height 8 small squares
3 marks
Mark scheme (b)
Answer
Mark
Comments
\(10 \times 4.5\) or \(9 \times 30 \div 6\) or \(225 \div (30 \div 6)\) or 45 or \(10 \times 3.6\) or \(7.2 \times (30 \div 6)\) or \(180 \div (30 \div 6)\) or 36 or \(25 \times 2\) or \(10 \times (30 \div 6)\) or \(250 \div (30 \div 6)\) or 50 or \(34.6 \times 30 \div 6\) or \(865 \div (30 \div 6)\)
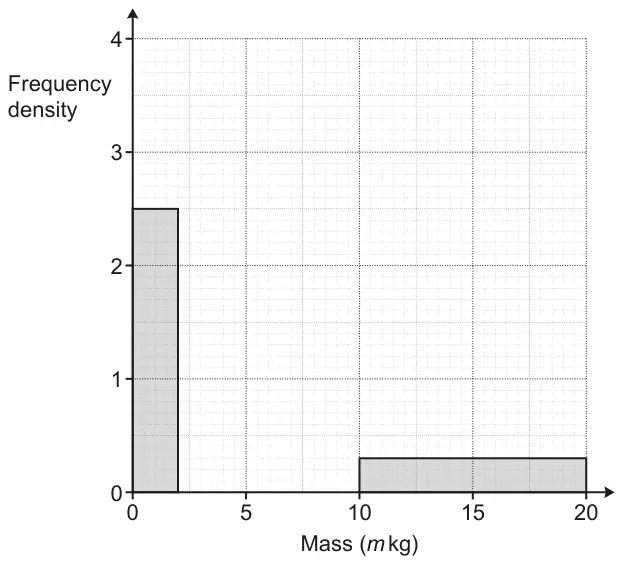
The table and the histogram each show part of this information.
Mass (\(m\) kg)
\(0 \lt m \leqslant 2\)
\(2 \lt m \leqslant 5\)
\(5 \lt m \leqslant 10\)
\(10 \lt m \leqslant 20\)
Frequency
12
18
(a) Complete the table and the histogram. [4]
(b) The heaviest parcel is 19.5 kg.
Complete the inequality to represent the range, \(R\) kg, of the masses of the parcels.
\(\ldots\ldots \leqslant R \lt \ldots\ldots\) [2]
Mark scheme (a)
Answer
Marks
Part marks and guidance
Completes table with \(0 \lt m \leqslant 2\) = 5 and \(10 \lt t \leqslant 20\) = 3
4
B2 for both frequencies correct in table or B1 for one frequency correct in table
and
Draws correct bars on histogram \(2 \lt m \leqslant 5\) to 4 \(5 \lt m \leqslant 10\) to 3.6
B2 for both bars correct
or B1 for one bar correct or M1 for [FD’s =] 12 ÷ 3 oe and 18 ÷ 5 oe soi
Bar must touch correct horizontal line for the majority of the interval For B2 no gaps between bars Do not accept omission of horizontal line at 4 on first bar
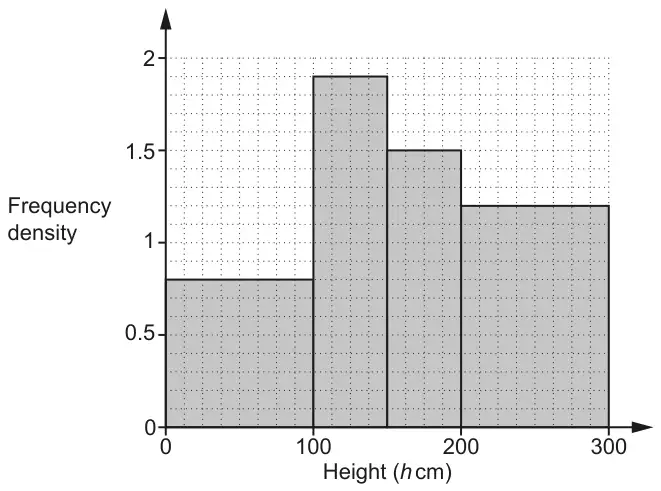
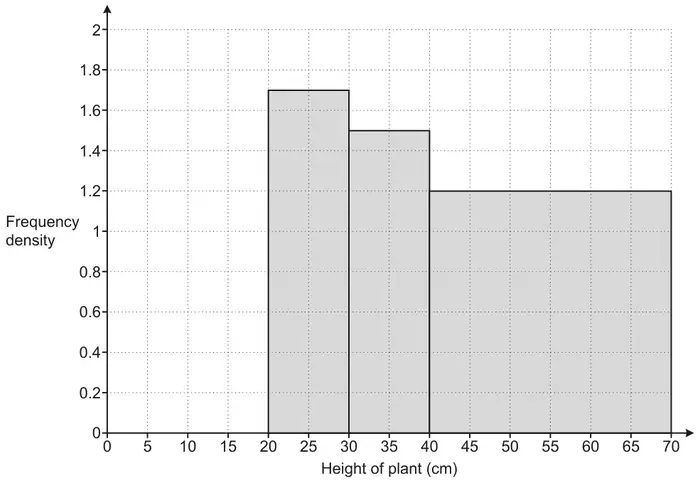
14 The histogram summarises the heights, \(h\) cm, of some plants in a garden centre.
(a) Show that there are 80 plants with a height in the interval \(0 \lt h \leqslant 100\). [1]
(b) The value, in pounds, of each plant depends on the plant’s height. The table below shows this information.
Height (\(h\) cm)
Value (£)
\(0 \lt h \leqslant 100\)
2.50
\(100 \lt h \leqslant 150\)
3.40
\(150 \lt h \leqslant 200\)
5.00
\(200 \lt h \leqslant 300\)
6.30
Use this information to find the total value of the plants represented in the histogram. [4]
Mark scheme (a)
Answer
Marks
Part marks and guidance
0.8 × 100
1
accept \(\frac{8}{10}\) oe fraction for 0.8
Mark scheme (b)
Answer
Marks
Part marks and guidance
1 654
4
M3 for 80 × 2.5 + 95 × 3.4 + 75 × 5 + 120 × 6.3 or 200 + 323 + 375 + 756 or M2 for the expression with two errors or B1 for one of 95, 75 and 120 or M1 for 80 × 2.5 + their95 × 3.4 + their75 × 5 + their120 × 6.3
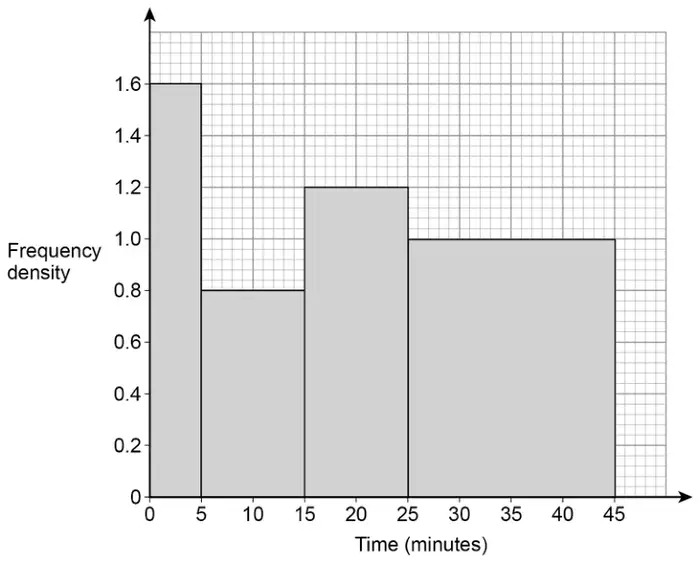
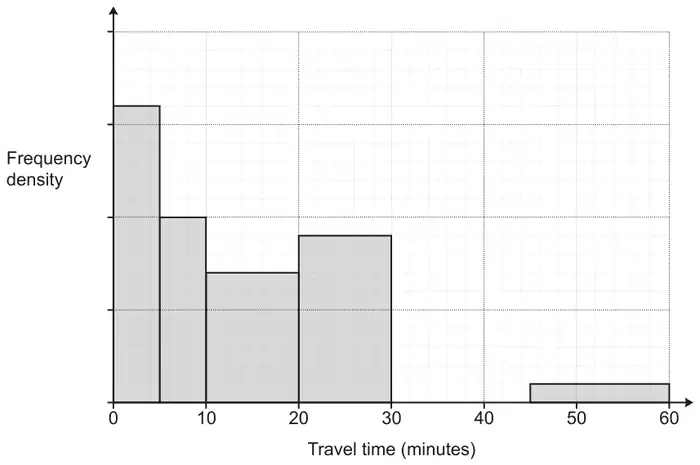
13 A group of students record the time taken to travel to school. All students in the group took less than an hour to travel to school. Some of their results are recorded on this histogram.
16 students took less than 5 minutes to travel to school.
(a) How many students took less than 20 minutes to travel to school? [4]
(b) 9 students took between 30 and 45 minutes to travel to school.
Add these students’ results to the histogram. [2]
Mark scheme (a)
Answer
Marks
Part marks and guidance
40 nfww
4
B1 for freq density 3.2 for 0-5 bar soi
M2 for 1.4 × 10 and 2 × 5 may be implied by 14 and 10 or M1 for 1.4 × 10 may be implied by 14
Figures may be seen on bars Could be implied by correct fd used for bars 2 and 3 or from scale on diagram
OR
For \(k \ne 1\) M3 for their \((16k + 10k + 14k) \div k\) or M2 for \(16k + 10k + 14k\) or M1 for two from \(16k\), \(10k\), \(14k\)
e.g M3 for (40 + 25 + 35) ÷ 2.5 or M2 for 40 + 25 + 35 or M1 two from 40, 25, 35
M3 for (80 + 50 + 70) ÷ 5 or M2 for 80 + 50 + 70 or M1 two from 80, 50, 70
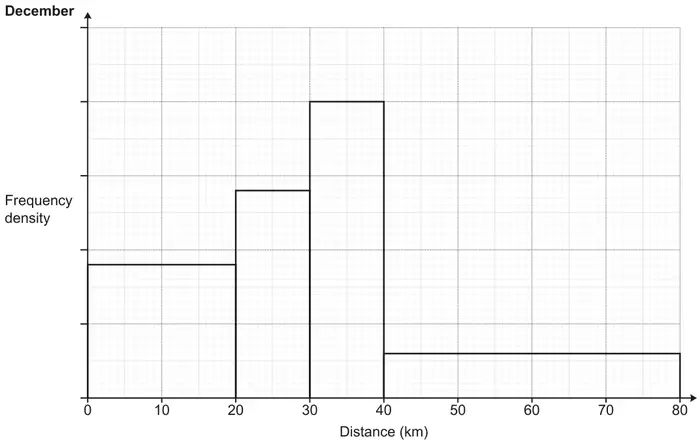
13 A running club records the distances run by each member during December. The results are shown in this histogram.
(a) 18 members run less than 20 km.
(i) Work out the number of members who run more than 30 km. [3]
(ii) Finley says
To estimate the range, I subtracted the smallest possible value from the largest possible value. So, 80 – 0 = 80 km.
Explain why Finley’s method is likely to overestimate the true value of the range. [1]
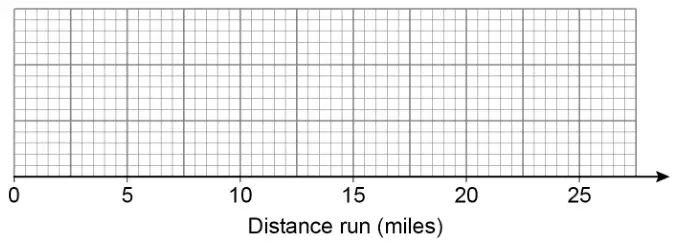
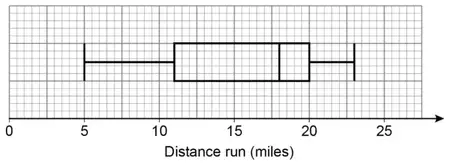
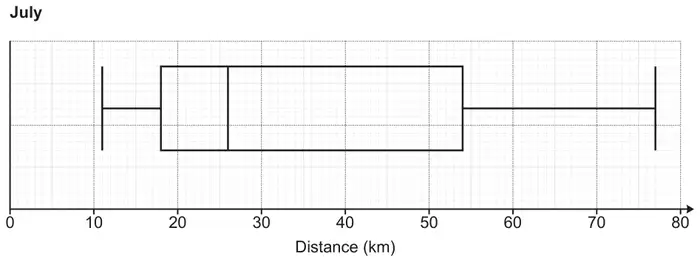
(b) This box plot shows the distribution of the distance run by each member of the running club during July.
During December,
the median distance run was 30 km
the interquartile range of the distance run was 20 km.
Make two comparisons between the distances run during December and the distances run during July. Include values to support your comparisons. [4]
Mark scheme (a)
Answer
Marks
Part marks and guidance
(a)(i)
32
3
M1 for 18 ÷ 20 soi by 0.9
M1 for \(2k \times 10\) [+] \(0.3k \times 40\) implied by 20 and 12 may be on diagram
May be soi on the vertical axis (eg. labelling the scale with [0.5,]1, [1.5, 2].
Where \(k\) is a consistent scaling of the height of the bars eg 4 × 10 [+] 0.6 × 40, 40 × 10 [+] 6 × 40 etc
Ignore extras
(a)(ii)
Unlikely the largest value will be 80 oe or The longest distance could be anywhere between 40 and 80 oe or Unlikely the smallest value will be 0 oe or The shortest distance could be anywhere between 0 and 20 oe
1
Accept: Exact distances are not known The data is in groups
Mark scheme (b)
Answer
Marks
Part marks and guidance
Median for July = 26
1
Condone mean or average for July = 26
If 0 scored overall SC1 for two correct comparisons lacking values
See appendix Condone not repeating the given values for December Need figures in comment/work space Comparison comment must be general and have context for second and fourth marks Accept for first mark “median is 4 more in Dec” oe Accept for third mark “IQR is 16 less in Dec” oe
eg SC1 for “median for July was lower” and “IQR for July was higher” oe
July distances were lower [on average] oe
1dep
IQR for July = 36
1
July distances were more varied oe
1dep
Appendix: Question 13b
Response
Comment
Marks
The median in Dec is 30 compared to July 26. This means on average people ran further in December. The IQR in Dec is 20 compared to July 36. This means the distances run were more variable in July.
Value. Compare the meaning of “on average” with “average” in the ninth example. We want a general interpretation in context. Value. Interpretation in context.
1 1 1 1
The median in Dec is 30 compared to July 26. This means the distances run in December were greater. The IQR in Dec is 20 compared to July 36. More people tended to run similar distances in December.
Value. A general interpretation in context. Value. Interpretation in context.
1 1 1 1
In July the runners on average ran shorter distances at 26km, while in December they ran further at 30km. In July the runners had a much larger IQR of distances at 36km, while in December they had a smaller IQR.
Value. Comparison in context. “on average” is a general comparison, which is what is looked for. Value. IQR not interpreted as a measure of variation.
1 1 1 0
December has a higher median distance run (26km < 30km). December has a smaller IQR compared to July (20km < 36km). This means December has a smaller spread of distances compared to July.
Value. Not an interpretation. Value. Interpretation in context.
1 0 1 1
The mean in July is 26. The range in July is 36.
Condone mean for value mark. Condone range for value mark.
1 0 1 0
The mean in July is 26. The IQR in July is 36. This means there is a bigger range of distances in July.
Condone mean for value mark. Not accepting “range” in the interpretation as it also has a technical meaning.
1 0 1 0
The median distance run in July was 26 compared to 30 in December The IQR in July is 36 compared to 20 in December
Value. Not an interpretation. Value. Not an interpretation.
1 0 1 0
The median distance in December was 4km more than in July. The IQR is 16km higher in July than in December.
Implies July is 26km. Not an interpretation. Implies July is 36km. Not an interpretation.
1 0 1 0
The median distance run in Dec is 30km compared to July 26km. This means their average is more than July. The IQR for December is less than July so it’s more consistent.
Value. ”average” being used as another word for “median” rather than as a general descriptor. No value. No context; dependent on the previous mark in any case.
1 0 0 0
There was a higher average of km in December. More spread out results in July.
No values. Comparison marks are dependent on value marks. However, they have two correct comparisons lacking values and context.
SC1
December had a higher median meaning people were running further. July had a larger average compared to December.
No value. Correct comparison in context but mark is dependent on value mark. The second statement contradicts the first and is not about IQR. Therefore, SC1 cannot be awarded.
0 0 0 0
The distance run in July was more than the distance run in December. More people run further in July than December.
No value. Incorrect and dependent on value in any case. Not about IQR.
13 The height, \(h\) cm, of each member of a tennis club is recorded. The histogram shows some of the results.
40% of the members have a height in the interval \(160 \leqslant h < 170\). 30% of the members have a height in the interval \(170 \leqslant h < 180\). 100% of the members have a height in the interval \(140 \leqslant h < 200\).
Complete the histogram for the intervals \(170 \leqslant h < 180\) and \(180 \leqslant h < 200\). [6]
Mark scheme
Answer
Marks
Part marks and guidance
First bar (\(170 \leqslant h < 180\)) at ‘height’ 2.4
Second bar (\(180 \leqslant h < 200\)) at height 0.5
6
M2 for \(\dfrac{3.2 \times 3 \times 10}{4 \times 10}\) oe or M1 for 3.2 × 10 B1 for their bar correctly drawn at \(\dfrac{\textit{their } 24}{10}\)
M2 implied by ‘first bar height’ 2.4 M1 implied by 24, 32 or 80
AND M2 for \(\dfrac{\textit{their } 80 - \textit{their } 24 - 32 - \textit{their } 0.7 \times 20}{20}\) oe or M1 for their 80 – their 24 – 32 – their 0.7 × 20 oe AND B1 for their bar correctly drawn at \(\dfrac{\textit{their } 10}{20}\)
(a) The masses, \(m\) kg, of some parcels are shown below.
4 15 14 11 12 3 1 18 13 2 16 10
Jack constructs this grouped frequency table to record the masses.
Mass (m kg)
Tally
Frequency
\(0 \leqslant m \leqslant 5\)
\(5 \leqslant m \leqslant 10\)
\(10 \leqslant m \leqslant 15\)
\(15 \leqslant m \leqslant 20\)
Explain why Jack’s table is unsuitable to record the masses. [1]
(b) The histogram summarises the times taken, in minutes, by some students to complete a race.
(i) Show that 70 students took between 45 and 70 minutes to complete the race. [2]
(ii) Calculate an estimate of the mean time taken to complete the race. Show your working. [5]
Mark scheme (a)
Answer
Marks
Part marks and guidance
Refers to overlapping intervals
1
eg 10 could go into 2 intervals The same number can go in 2 places Upper value in interval should be < Both inequalities are ≤ when only one should be
Mark scheme (b)
Answer
Marks
Part marks and guidance
(i) 5 × 6 and 2 × 20
2
M1 for 5 × 6 or 2 × 20
Could be written on graph Allow eg 2 × 10 + 2 × 10 for 2 × 20 Not just 30 + 40, must show products
(ii) 50.25 with correct working
5
B1 for frequencies 10, 20, 30, 40 M1 for mid-interval values 35, 42.5, 47.5, 60 soi M1 for \(\sum ft\) where \(t\) is in the interval including boundaries FT their frequencies
M1 for \(\sum ft \div \sum f\) dep on previous M1 FT their frequencies
If 0 scored, SC2 for answer 50.25 or SC1 for 5025 with no working
“Correct working” requires evidence of at least B1M1M1 Condone 1 error, could be on graph,
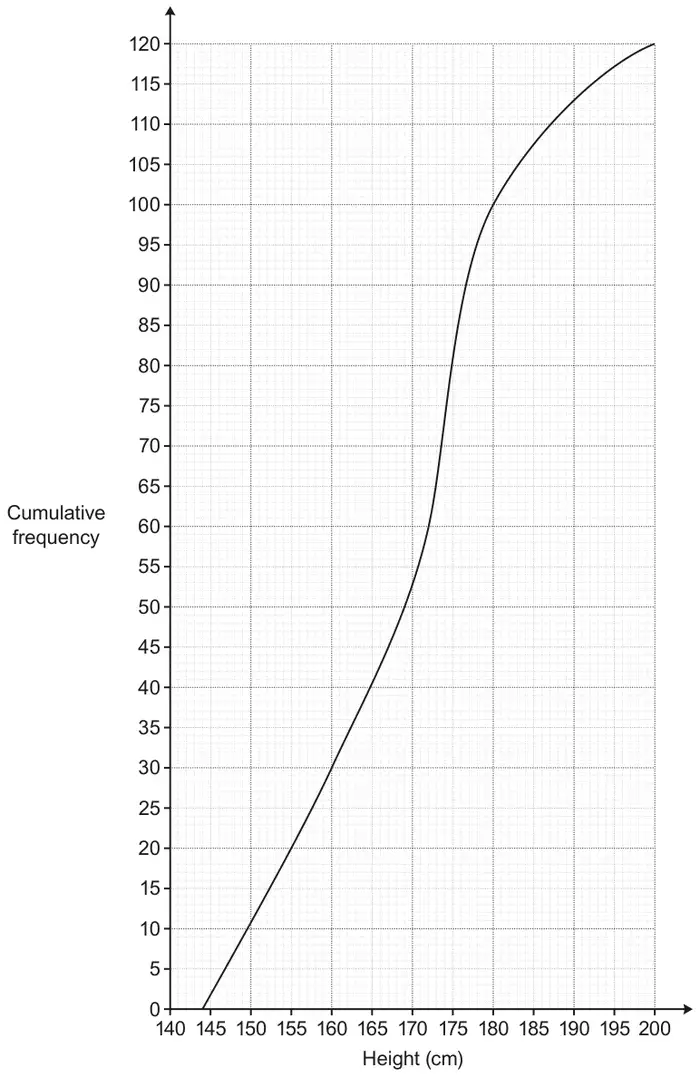
(a) The cumulative frequency graph shows the distribution of the heights of members of a rowing club.
(i) Find the median. [1]
(ii) Find the interquartile range. [2]
(iii) Calculate the percentage of the members who are at least 180 cm tall. [3]
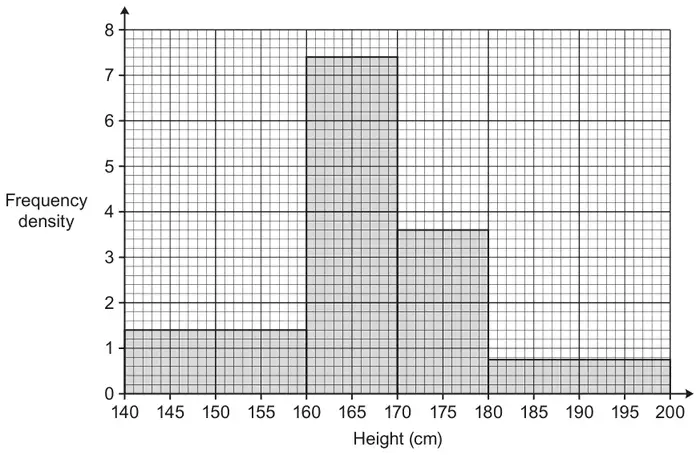
(b) The histogram summarises the heights of the 153 members of a swimming club.
Which club has the greater median height? You must show all your working. [5]
Mark scheme (a)
Answer
Marks
Part marks and guidance
(i) 172
1
(ii) 16 to 17
2
B1 for 160 or 176 to 177 (may be written or indicated on graph, not just a line through it)
(iii) 16.6 to 16.7 or 17
3
B2 for [0].83[3…] or 83[.3…]% or [0].166… or [0].167 or [0].17 OR B1 for 100 (from graph) or 20 M1 for \(\frac{\textit{their }100}{120}\) [× 100] or \(\frac{\textit{their }20}{120}\) [× 100]
Mark scheme (b)
Answer
Marks
Part marks and guidance
76.5 or 77 and 102 or both 28 (or 14+14) and 74
Swimming club has a median in group 160 to 170 oe [Rowing club has median their 172] So rowing club [has higher median] oe FTtheir(a)(i) for conclusion
5
B1 for 76.5 or 77 M2 for 20 × 1.4 and 10 × 7.4 soi by 102 or both 28 (or 14+14) and 74 or M1 for 20 × 1.4 or 10 × 7.4 soi by 28 (or 14+14) or 74 Accept any correct alternative methods (e.g. 5 squares = 1 person) B1 for [swimming club has a median in group] 160 to 170 oe e.g. “\(\leqslant 170\)” (if they use a proportional calculation answer 166 to 167) A1dep on previous 4 marks for “rowing club [has higher median]” oe FTtheir(a)(i) for conclusion
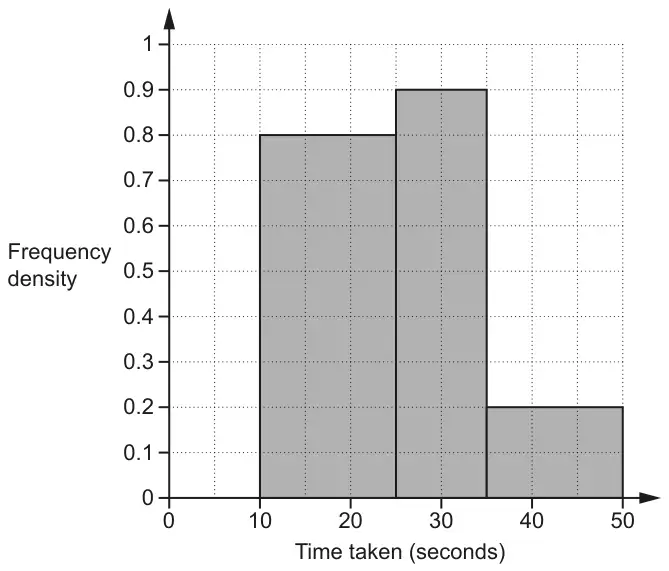
12 30 students completed a puzzle and their times were recorded. All of the students completed the puzzle in less than 50 seconds. The histogram shows information about some of their times.
Complete the histogram for those completing the puzzle in less than 10 seconds. [5]
Mark scheme
Answer
Marks
Part marks and guidance
correct bar width and ‘height’ of 0.6
5
M2 for 15 × 0.8 + 10 × 0.9 + 15 × 0.2 or better e.g. 12 + 9 + 3 or 24 or M1 for two correct frequencies calculated from 12, 9 and 3 AND M1 for 30 – their 24 soi 6 M1 for their 6 ÷ 10 soi 0.6
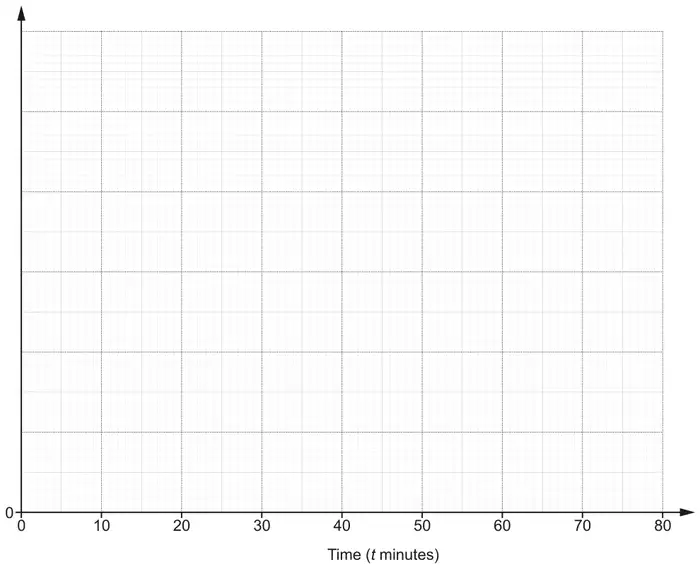
19 Ceri records the time taken, \(t\) minutes, to travel to school for a sample of 168 students at her Academy.
Time taken (\(t\) minutes)
Frequency
\(0 \lt t \leqslant 10\)
54
\(10 \lt t \leqslant 20\)
50
\(20 \lt t \leqslant 40\)
44
\(40 \lt t \leqslant 80\)
20
(a) Draw a histogram to represent this information.[4]
(b) Ceri says
The longest time that any of these students took to travel to school was 80 minutes.
Is she correct? Give a reason for your answer. [1]
(c) Ceri also claims that 25% of all of the students at this Academy took more than 30 minutes to travel to school.
(i) Show how Ceri might have worked out her claim. [2]
(ii) State one assumption that Ceri has made in making her claim. [1]
Mark scheme (a)
Answer
Marks
Part marks and guidance
Correct histogram with blocks of height 5.4, 5, 2.2 and 0.5
3
B2 for 3 correct blocks or B1 for 2 correct blocks of different widths
½ small square accuracy for heights, no gaps between blocks Condone good freehand if in tolerance Condone omission of vertical line at \(t\) = 80 Other correct histograms may be possible with different scales
If 0 scored, SC1 for 3 correct freq densities soi 5.4 oe, 5 , 2.2 oe and 0.5 oe
For SC1 oe accept e.g. \(\dfrac{44}{20}\) isw for 2.2
Vertical axis labelled ‘frequency density’ and a correct linear scale shown
1
At least 2 numbers shown for linear scale (other than zero), A correct linear scale could use e.g. 2 cm to 1 unit or 2 cm for 2 units Accept FD for frequency density label
Mark scheme (b)
Answer
Marks
Part marks and guidance
We don’t know oe and correct reason
1
e.g. Not sure, as exact data not given.
Accept No with correct reason but do not accept ‘yes’ with any reason e.g. No, all we know is that the longest time is in the group from 40 to 80 See AG
Appendix: exemplar responses for Q19b
Response
Mark
No all we know is that it lies between 40 and 80
1
They may have taken 80 minutes but we don’t know that for sure – they may have all been less than 60
1
No [because the time section says \(40 \lt t \leqslant 80\),] they may have been less than 80
1
No there is a range of values for the time so not definitely 80
1
No as the time is given as a range
1
No we are not give the accurate values
1
It might be but we would need to know the exact values to find out
1
Yes 80 is the highest value
0
Yes with any comment
0
Mark scheme (c)
Answer
Marks
Part marks and guidance
(i) 20 + 44 ÷ 2 = 42
M1
or 168 – 54 – 50 – 44 ÷ 2
Accept 22 for 44 ÷ 2
42 is 25% of [total ]168 oe
A1
with no errors seen
Accept e.g. ¼ of 168 = 42, 168 ÷ 4 = 42 \(\dfrac{42}{168} = \dfrac{1}{4}\) etc oe
These two steps may be done in reverse order
(ii) Correct statement on assumption made
B1
e.g. Sample is representative oe Distribution of students in the school is the same as the sample Data is distributed uniformly across the times/ the interval \(20 \lt t \leqslant 40\) oe Half of the students in \(20 \lt t \leqslant 40\) took longer than 30 minutes 22 of the students took between 30 and 40
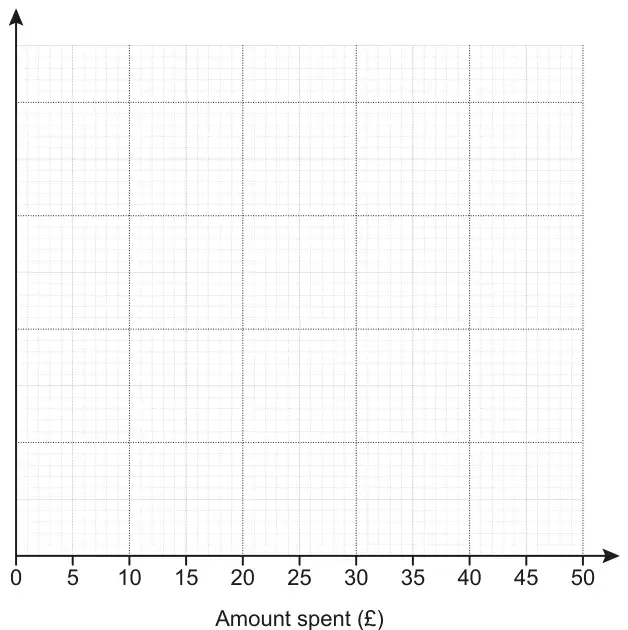
10 Ana records the amount of money spent by 140 customers in her shop on one day.
Amount spent (£\(a\))
Frequency
\(0 \lt a \leqslant 5\)
35
\(5 \lt a \leqslant 10\)
42
\(10 \lt a \leqslant 15\)
20
\(15 \lt a \leqslant 20\)
18
\(20 \lt a \leqslant 30\)
14
\(30 \lt a \leqslant 50\)
11
(a) Draw a histogram to represent this information.
[4]
(b) Ana wants to offer a discount to the customers who spend the most money in her shop.
Voucher Save 10% when you spend more than £…
She wants to give the discount to approximately 25% of her customers.
Suggest a suitable amount of money for Ana to use on her voucher. Justify your decision. [4]
Mark scheme (a)
Answer
Marks
Part marks and guidance
Fds 7, 8.4, 4, 3.6, 1.4, 0.55
1
At least 3 correct; may be implied by height of 3 bars including one of the last two
Bars all of correct height
1
Tolerance 1 mm unless on gridlines
FT their scale. Heights may be indicated by a plotted point, stick etc
Ignore polygon lines
Bars all of correct width
1
Condone missing vertical lines if tops correct width
Vertical axis with consistent linear scale starting from 0 soi and labelled ‘Frequency density’ oe
1
B0 for scale 0 to 42 etc for frequency graph even if labelled frequency density
Accept abbreviations or an area key eg 1 cm\(^2\) = 5
Notes
(corrected from the printed mark scheme: “Frequency denisity” is a spelling slip for “Frequency density”.)
Mark scheme (b)
Answer
Marks
Part marks and guidance
Answer £17 to £18 inclusive with valid working and justification
4
M1 for 25% of 140 = 35 or 75% of 140 = 105
M1dep for identification of 15 to 20 soi
eg implied by frequencies 25 and 43 or 97 and 115 or by answer in range 15 to 20
A1 for answer £17 to £18 inclusive B1dep on M1M1A1 for justification
If 0 scored, then SC1 for an answer £15 to £20
Justification can be based on a calculation eg \(\frac{10}{18}\) of 15 to 20 bar or reasoning eg 18% spent £20 and 30/31% spent £15, so 25% is just over/about halfway.