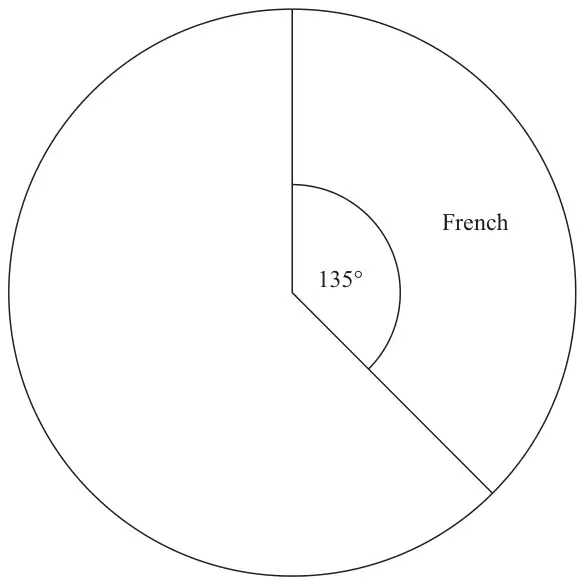
14 120 students in Year 10 each choose one language to study.
The table below shows information about their choices.
Language
Number of students
French
45
Mandarin
20
Spanish
55
(a) Complete the accurate pie chart to show this information.(3)
In another pie chart the number of students in Year 11 studying French is represented by an angle of \(150^\circ\)
Navi says,
“This means that French was chosen by more students in Year 11 than by students in Year 10”
(b) Is Navi correct? Explain why you think this. (1)
Mark scheme (a)
Answer
Mark
Mark scheme
Complete pie chart
M1
for a full method to find at least one angle, eg \(\dfrac{360}{(45 + 20 + 55)} \times 20\ (= 60)\) oe or \(\dfrac{55}{(45 + 20 + 55)} \times 360\ (= 165)\) oe or \(\dfrac{135}{45} \times 20\ (= 60)\) or \(\dfrac{135}{45} \times 55\ (= 165)\)
A1
for both angles correctly calculated or for one correct and accurately drawn angle
A1
for a fully correct labelled pie chart
Additional guidance
Award this mark even if more than 3 sectors are drawn
Do not award for drawing if the intention is to show more than 3 sectors
Each sector must be labelled with the associated language, not just angle size.
Mark scheme (b)
Answer
Mark
Mark scheme
Explanation
C1
for explanation relating to population size,
Acceptable examples No as we do not know the number of students in year 11 It would be true if the number of students in each year was the same No as pie charts show proportions not numbers (No) as the populations may not be equal No there may be more/less students in Yr10/Yr 11 Could be different number of degrees per person (on Yr 11 pie chart) Yes but only if there are the same number of students We don’t know how many students are in year 10 compared to year 11
Not acceptable examples Yes as \(150^\circ\) is bigger than \(135^\circ\) We don’t know how many students are in year 10
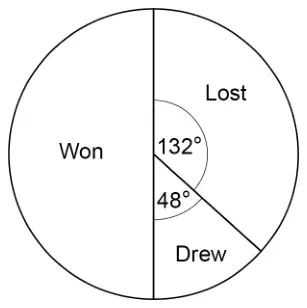
18 The pie chart represents the results of matches played by a team.
30 matches were won.
How many matches were lost? [3 marks]
Mark scheme
Answer
Mark
Comments
Alternative method 1: proportion using angles
\(\dfrac{132}{180}\) or \([0.73, 0.7\dot{3}]\) or \(\dfrac{132}{360}\) or [0.36, 0.37] or \(\dfrac{48}{180}\) or [0.26, 0.27] or \(\dfrac{48}{360}\) or \([0.13, 0.1\dot{3}]\) or 132 : 48 or 11 : 4
M1
oe fraction or percentage ratio: oe either order
or \(\dfrac{132}{180} \times 30\) or \(\dfrac{48}{180} \times 30\) or 8 or 22 : 8 or 8 : 22 (not oe)
M1dep
oe eg \([0.73, 0.7\dot{3}] \times 30\) \(\dfrac{132}{360} \times 30 \times 2\) or \(\dfrac{48}{360} \times 30 \times 2\) is M2
22
A1
SC1 11
Alternative method 2: using the number of degrees per match
\((360 - 132 - 48) \div 30\) or \(180 \div 30\) or \(360 \div (30 \times 2)\) or 6
M1
oe
\(132 \div\) their 6 or \(48 \div\) their 6 or 8
M1dep
oe \(\dfrac{132}{360 \div (30 \times 2)}\) or \(\dfrac{48}{360 \div (30 \times 2)}\) is M2
22
A1
SC1 11
Alternative method 3: using the number of matches per degree
\(\dfrac{30}{180}\) or \(\dfrac{30 \times 2}{360}\) or [0.16, 0.17]
M1
oe fraction or percentage eg \(\dfrac{1}{6}\)
or \(\dfrac{30}{180} \times 132\) or \(\dfrac{30}{180} \times 48\) or 8
M1dep
oe eg \([0.16, 0.17] \times 132\)
22
A1
SC1 11
Additional guidance
SC1 is for using 30 matches in total
\(0.17 \times 132 = 22.44\) with answer 22
M1M1A0
\(30 \div 2 = 15\) and \(15 \div 2 = 7.5\) and \(15 + 7.5 = 22.5\) with answer 22
M1M1A1
\(30 \div 2 = 15\) and \(15 \div 2 = 7.5\) and \(15 + 7.5 = 22.5\)
M0
\(30 \div 2 = 15\) and \(15 \div 2 = 7.5\) and \(7.5 \to 8\)
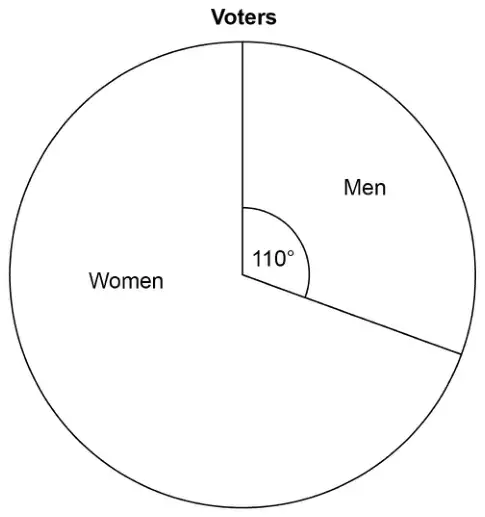
24 The pie chart shows information about voters in an election.
3360 more women voted than men.
Work out the total number of voters. [3 marks]
Mark scheme
Answer
Mark
Comments
Alternative method 1
\(360 - 110\) or 250 or \(360 - 110 - 110\) or 140
M1
May be seen on diagram oe
3360 \(\div\) their 140 or 24 or 2640 (men) or 6000 (women)
M1dep
their 140 must be from \(360 - 110 - 110\) oe
8640
A1
SC2 4838 or 4839
Alternative method 2
\(100 - \dfrac{110}{360} \times 100\) or \(100 - 30.5(\ldots)\) or \(100 - 30.6\) or 69.4(…%) or 69.5(%) or \(100 - \dfrac{110}{360} \times 100 - \dfrac{110}{360} \times 100\) or \(100 - 30.5(\ldots) - 30.5(\ldots)\) or \(100 - 30.6 - 30.6\) or 38.8(…%) or 38.9(%)
M1
May be seen on diagram oe
3360 \(\div\) (their 69.4 \(-\) their 30.5) or 3360 \(\div\) their 38.8(...) or 86.4
M1dep
their 69.4 must be from \(100 - \dfrac{110}{360} \times 100\) their 30.5 must be from \(\dfrac{110}{360} \times 100\)
8640
A1
SC2 4838 or 4839
Alternative method 3
\(\dfrac{250}{360}x - \dfrac{110}{360}x = 3360\) or \(m = \dfrac{110}{360} \times (m + 3360 + m)\) or \(w = \dfrac{250}{360} \times (w + w - 3360)\)
M1
Sets up a correct equation to work out total (\(x\)), men (\(m\)) or women (\(w\)) oe
\(x = 3360 \div \left(\dfrac{250 - 110}{360}\right)\) or \(m = 336\,000 \div 140\) or 2640 or \(w = 840\,000 \div 140\) or 6000
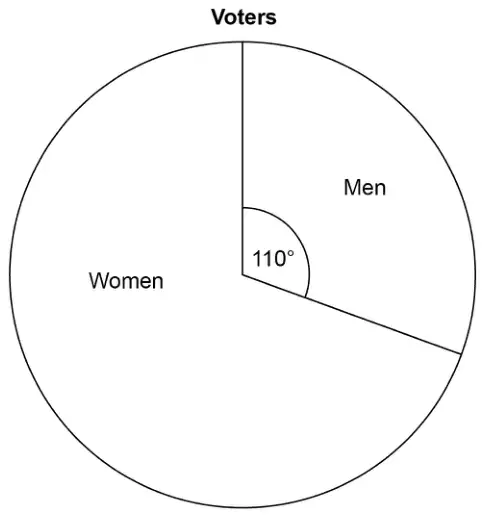
10 The pie chart shows information about voters in an election.
3360 more women voted than men.
Work out the total number of voters. [3 marks]
Mark scheme
Answer
Mark
Comments
Alternative method 1
\(360 - 110\) or 250 or \(360 - 110 - 110\) or 140
M1
May be seen on diagram oe
\(3360 \div\) their 140 or 24 or 2640 (men) or 6000 (women)
M1dep
their 140 must be from \(360 - 110 - 110\) oe
8640
A1
SC2 4838 or 4839
Alternative method 2
\(100 - \dfrac{110}{360} \times 100\) or \(100 - 30.5(\ldots)\) or \(100 - 30.6\) or 69.4(…%) or 69.5(%) or \(100 - \dfrac{110}{360} \times 100 - \dfrac{110}{360} \times 100\) or \(100 - 30.5(\ldots) - 30.5(\ldots)\) or \(100 - 30.6 - 30.6\) or 38.8(…%) or 38.9(%)
M1
May be seen on diagram oe
\(3360 \div\) (their 69.4 \(-\) their 30.5) or \(3360 \div\) their 38.8(…) or 86.4
M1dep
their 69.4 must be from \(100 - \dfrac{110}{360} \times 100\) their 30.5 must be from \(\dfrac{110}{360} \times 100\)
8640
A1
SC2 4838 or 4839
Alternative method 3
\(\dfrac{250}{360}x - \dfrac{110}{360}x = 3360\) or \(m = \dfrac{110}{360} \times (m + 3360 + m)\) or \(w = \dfrac{250}{360} \times (w + w - 3360)\)
M1
Sets up a correct equation to work out total \((x)\), men \((m)\) or women \((w)\) oe
\(x = 3360 \div \left(\dfrac{250 - 110}{360}\right)\) or \(m = 336\,000 \div 140\) or 2640 or \(w = 840\,000 \div 140\) or 6000