for finding the mean of list A, eg \((276 + 400 + 157 + 139) \div 4\ (= 243)\) OR for an expression for the mean of list B, eg \((530 + 500 + 270 + x + 440 + 320) \div 6\ \left(= \dfrac{2060 + x}{6}\right)\) oe
P1
for beginning to work with ratio, eg \(\text{``}243\text{''} \div 3\ (= 81)\) or \([\mathrm{A}] \div 3\) or \(\text{``}243\text{''} \times 5\ (= 1215)\) or \([\mathrm{A}] \times 5\) OR \(\text{``}\left(\dfrac{2060 + x}{6}\right)\text{''} \times 3\) or \([\mathrm{B}] \times 3\) or \(\text{``}\left(\dfrac{2060 + x}{6}\right)\text{''} \div 5\) or \([\mathrm{B}] \div 5\)
P1
for completing the work with ratio, eg \(\text{``}81\text{''} \times 5\ (= 405)\) or \([\mathrm{A}] \div 3 \times 5\) or \([\mathrm{B}] \times 3 \div 5\) or \(\text{``}\left(\dfrac{2060 + x}{6}\right)\text{''} \times \dfrac{3}{5}\) OR forms a suitable equation, eg \(\text{``}243\text{''} \times 5 = 3 \times \text{``}\left(\dfrac{2060 + x}{6}\right)\text{''}\) or \([\mathrm{A}] \times 5 = 3 \times \text{``}\left(\dfrac{2060 + x}{6}\right)\text{''}\)
P1
for working with mean of list B, eg \(\text{``}405\text{''} \times 6\ (= 2430)\) or \([\mathrm{A}] \div 3 \times 5 \times 6\) OR for process to remove brackets and denominator, eg \(\text{``}243\text{''} \times 5 \times 2 = 2060 + x\) or \([\mathrm{A}] \times 5 \times 2 = 2060 + x\) or \(2060 + x = \text{``}405\text{''} \times 6\)
A1
cao
Additional guidance
[A] is what they believe to be the mean for A [B] must be clearly their mean of B and be an expression including \(x\)
19 Katya counted the number of people in each of 50 cars.
The table gives information about her results.
Number of people
Frequency
1
16
2
15
3
7
4
9
5
3
(a) Find the median number of people. (1)
(b) Work out the mean number of people. (3)
Mark scheme (a)
Answer
Mark
Mark scheme
2
B1
cao
Mark scheme (b)
Answer
Mark
Mark scheme
2.36
M1
for starting method by multiplying ages by frequencies, with at least 3 correct, eg \(1 \times 16\), \(2 \times 15\), \(3 \times 7\), \(4 \times 9\), \(5 \times 3\) or at least three of 16, 30, 21, 36, 15
M1
(dep on M1) for \(\sum fx \div \sum f\), eg \(118 \div 50\) or \(118 \div (16 + 15 + 7 + 9 + 3)\) or \((1 \times 16 + 2 \times 15 + 3 \times 7 + 4 \times 9 + 5 \times 3) \div 50\)
A1
accept 2.4 from correct working
Additional guidance
Do not award this mark if the final answer comes from an alternative incorrect method, eg \(50 \div 5\) May be seen next to table 118 implies this mark
\(\sum fx\) must come from 5 products
If a correct answer is shown and then incorrectly rounded award full marks
12 The table gives some information about the ages, in years, of 32 actors.
Lowest age
21
Highest age
80
Lower quartile
31
Upper quartile
42
Median
35
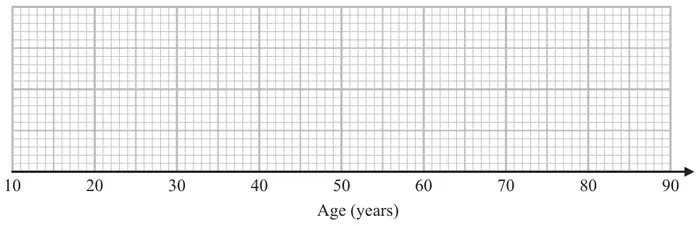
(a) Draw a box plot to represent this information.(3)
(b) Work out an estimate for the number of these actors with an age between 31 years and 42 years. (1)
Mary says,
“At least one of the actors is 35 years old because the median is 35”
(c) Is Mary correct? Give a reason for your answer. (1)
Mark scheme (a)
Answer
Mark
Mark scheme
Drawn
B3
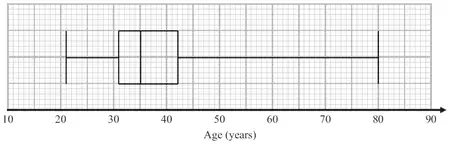
for a fully correct box plot
(B2
for 3 or 4 correctly plotted values including box and whiskers/tails
(B1
for 2 correctly plotted values including box or whiskers/tails or 5 correct values plotted or clearly identified and no box or whiskers/tails)
Additional guidance
See diagram at end of scheme Min = 21 LQ = 31 Med = 35 UQ = 42 Max = 80
Mark scheme (b)
Answer
Mark
Mark scheme
16
B1
cao
Mark scheme (c)
Answer
Mark
Mark scheme
Explanation
C1
Acceptable examples Not true as the median could be the average of two ages No, the median is not always one of the numbers in the data Because there is an even amount of numbers, there must be 2 in the middle that have a mean of 35 She could be correct if the middle two numbers are both 35
Not acceptable examples Yes… No more are between 31-35 than 35-42 No as there is an even number at least two must be 35 No the median is just the average We can’t tell from the graph Because there is an even amount of numbers Not true as we do not know the exact ages of all data.
Additional guidance
Figures need not be stated, but if they are, they must be correct
for finding the mean of list A, eg \((276 + 400 + 157 + 139) \div 4\ (= 243)\) OR an expression for the mean of list B, eg \((530 + 500 + 270 + x + 440 + 320) \div 6\ \left(= \dfrac{2060 + x}{6}\right)\) oe
P1
for beginning to work with ratio, eg \(\text{``}243\text{''} \div 3\ (= 81)\) or \([\mathrm{A}] \div 3\) or \(\text{``}243\text{''} \times 5\ (= 1215)\) or \([\mathrm{A}] \times 5\) OR \(\text{``}\left(\dfrac{2060 + x}{6}\right)\text{''} \times 3\) or \([\mathrm{B}] \times 3\) or \(\text{``}\left(\dfrac{2060 + x}{6}\right)\text{''} \div 5\) or \([\mathrm{B}] \div 5\)
P1
for completing the work with ratio, eg \(\text{``}81\text{''} \times 5\ (= 405)\) or \([\mathrm{A}] \div 3 \times 5\) or \([\mathrm{B}] \times 3 \div 5\) or \(\text{``}\left(\dfrac{2060 + x}{6}\right)\text{''} \times \dfrac{3}{5}\) OR forms a suitable equation, eg \(\text{``}243\text{''} \times 5 = 3 \times \text{``}\left(\dfrac{2060 + x}{6}\right)\text{''}\) or \([\mathrm{A}] \times 5 = 3 \times \text{``}\left(\dfrac{2060 + x}{6}\right)\text{''}\)
P1
for working with mean of list B, eg \(\text{``}405\text{''} \times 6\ (= 2430)\) or \([\mathrm{A}] \div 3 \times 5 \times 6\) OR for process to remove brackets and denominator, eg \(\text{``}243\text{''} \times 5 \times 2 = \text{``}2060 + x\text{''}\) or \([\mathrm{A}] \times 5 \times 2 = \text{``}2060 + x\text{''}\) or \(2060 + x = \text{``}405\text{''} \times 6\)
A1
cao
Additional guidance
[A] is what they believe to be the mean of A [B] must be clearly their mean of B and be an expression including \(x\)
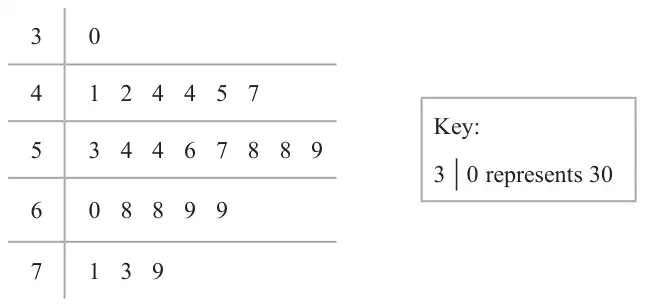
22 The stem and leaf diagram shows the test scores of 23 students from School A.
23 students from School B did the same test.
Their median score was 56 The range of their scores was 47
Compare the distribution of the test scores of the students from School A with the distribution of the test scores of the students from School B. (4)
Mark scheme
Answer
Mark
Mark scheme
Comparison
B1
for correctly identifying the median of (School) A as 57
C1
(ft, dep on value for the median being stated) for making a correct comparison of median eg ‘the median of (School) A is higher than the median of (School) B’
B1
for correctly identifying the range of (School) A as 49
C1
(ft, dep on value for the range being stated) for making a correct comparison of range eg ‘the range of (School) A is higher than the range of (School) B’
Additional guidance
If median for school B is stated in the comparison it must be correct
If range for school B is stated in the comparison it must be correct
15 The table gives information about the ages of the 41 children in Blackrod football club.
Age (years)
Frequency
8
6
9
7
10
15
11
11
12
2
(a) Work out the mean age. Give your answer correct to 1 decimal place. (3)
Rohan is working out the modal age of the children in Blackrod football club. He says,
“The highest frequency is 15, so the modal age is 15”
(b) Is Rohan’s answer correct? Give a reason for your answer. (1)
Mark scheme (a)
Answer
Mark
Mark scheme
9.9
M1
for starting process by multiplying ages by frequencies, with at least 3 correct, eg \(8 \times 6\), \(9 \times 7\), \(10 \times 15\), \(11 \times 11\), \(12 \times 2\) or at least 3 of 48, 63, 150, 121, 24
M1
(dep on M1) for \(\sum fx \div \sum f\), eg \(406 \div 41\) or \(406 \div (6 + 7 + 15 + 11 + 2)\) or \((8 \times 6 + 9 \times 7 + 10 \times 15 + 11 \times 11 + 12 \times 2) \div 41\)
A1
Answer in the range 9.9 to 9.91
Additional guidance
May be seen next to table. 406 implies this mark
\(\sum fx\) must come from 5 products
If an answer is given in the range in working and then rounded incorrectly award full marks.
Mark scheme (b)
Answer
Mark
Mark scheme
No, with explanation
C1
No, with explanation,
Acceptable examples No as the mode/modal age is 10 No it should be 10 (not 15) No because 15 is the number of children that are age 10 (not age 15) No because there are no 15 year olds No because the frequency tells us the number of children for that age No he needs to give the age of the highest frequency
Not acceptable examples No he is not, the modal is the one that occurs the most Yes / Rohan is correct .... No, the mode is 11
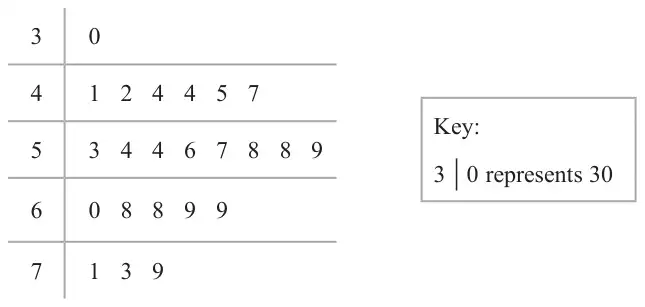
6 The stem and leaf diagram shows the test scores of 23 students from School A.
23 students from School B did the same test.
Their median score was 56 The range of their scores was 47
Compare the distribution of the test scores of the students from School A with the distribution of the test scores of the students from School B. (4)
Mark scheme
Answer
Mark
Mark scheme
Comparison
B1
for correctly identifying the median of (School) A as 57
C1
(ft, dep on value for the median being stated) for making a correct comparison of median eg ‘the median of (School) A is higher than the median of (School) B’
B1
for correctly identifying the range of (School) A as 49
C1
(ft, dep on value for the range being stated) for making a correct comparison of range eg ‘the range of (School) A is higher than the range of (School) B’
Additional guidance
If median for school B is stated in the comparison it must be correct
If range for school B is stated in the comparison it must be correct
(a) £4.56 is paid using the smallest possible number of coins.
What is the modal value of the coins used?
You must show your working. [2 marks]
(b) Here is a list of five numbers.
5 9 4 16 8
An extra number is put into the list.
The median of the numbers is now 7
Work out the extra number. [2 marks]
Mark scheme (a)
Answer
Mark
Comments
Answer £2 and £2, £2, 50p, 5p, 1p
B2
any order B1 Answer £2 or a set of coins which total £4.56 or correct modal value for their set of coins SC1 Answer 2 and 2, 2, 50, 5, 1 or Answer 2 and 2, 2, 0.50, 0.05, 0.01
Additional guidance
SC1 is for an otherwise correct response with all or some units missing eg Answer 2 and £2, 2, 50p, 5, 1
SC1
Units must be seen on answer and all coins for B2
Units must be seen for B1 on answer £2 or on all coins for a set of coins which total £4.56 or on answer and all coins for the correct modal value for their set of coins
Accept £0.50, condone £0.50p
Units of the form 0.50p are incorrect
Use of one or more coins that do not exist is max B1 for Answer £2
Answer £2 and 2, 2, 50, 5, 1
B1
2, 2, 50, 5, 1 without answer £2
B0
£1, £1, £1, £1, 50p, 5p, 1p
B1
Answer 1 and 1, 1, 1, 1, 50, 5, 1
B0
Mark scheme (b)
Answer
Mark
Comments
ordered list 4 5 8 9 16 or ordered list with an extra number (extra may be correct or incorrect) or indication of middle numbers as 6 and 8
M1
list in ascending or descending order
6
A1
Additional guidance
M1 may be awarded for correct work with no answer or incorrect answer, even if this is seen amongst multiple attempts
4 5 7 8 9 16 (ordered list with incorrect extra)
M1
4 5 8 9 16 1 (ordered list with incorrect extra)
M1
4 5 6 8 9 16 (ordered list with correct extra) and answer 7
Condone the omission of brackets Accept one error or omission in reading from diagram
4.7
A1
oe
Additional guidance
5 on answer line with 4.7 in working
M1A1
4 on answer line with 4.7 in working
M1A0
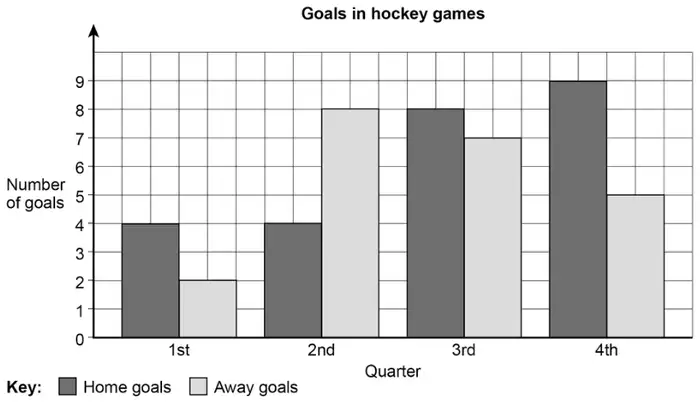
\((4 + 2 + 4 + 8 + 8 + 7 + 9) \div 10\) is one omission \((4 + 2 + 4 + 8 + 8 + 7 + 9 + 6) \div 10\) is one error \((6 + 12 + 15 + 13) \div 10\) assume one error \((25 + 23) \div 10\) assume one error \(2.5 + 2.3\) assume one error
M1
Do not accept further calculation after 4.7 seen \(47 \div 10 = 4.7\) \(4.7 \times 4 = 18.8\)
M1A0
Use of away goals only, treat as misread from the words in part (a) \((2 + 8 + 7 + 5) \div 10\) or 2.2 condone the omission of brackets
M1A0
5 on answer line without working
M0A0
\((6 + 12 + 15) \div 10\) assume two omissions
M0A0
Mark scheme (c)
Answer
Mark
Comments
Alternative method 1
\(4 + 4 + 8 + 9\) and \(2 + 8 + 7 + 5\) or 25 and 22
M1
Accept one error in reading from diagram
3
A1
Alternative method 2
\(4 - 2\) or 2 and \(4 - 8\) or \(-4\) and \(8 - 7\) or 1 and \(9 - 5\) or 4
M1
Accept one error in reading from diagram Differences may be seen on the diagram
3
A1
Additional guidance
\(25 - 22 = 3\)
M1A1
\(4 - 2 = 2\) and \(4 - 8 = -4\) and \(8 - 6 = 2\) and \(9 - 5 = 4\) is one reading error
M1
\(4 - 2 = 2\) and \(4 - 8 = 4\) and \(8 - 7 = 1\) and \(9 - 5 = 4\)
M1
\(4 + 4 + 8 + 9\) and \(2 + 7 + 7 + 5\) is one reading error \(24 - 21 = 3\)
M1 A0
1st 2 2nd 4 3rd 1 4th 4 is one error in calculation without working
M0A0
1st 2 3rd 1 4th 4 is one omission
M0A0
\(24 - 21 = 3\) with no other working
M0A0
\(4 + 4 + 8 + 8\) and \(2 + 8 + 6 + 5\) is two reading errors \(24 - 21 = 3\)
M0 A0
Mark scheme (d)
Answer
Mark
Comments
No and valid reason eg Indicates that one or more home teams might have won a game or games by a lot of goals
B1
Additional guidance
In numerical examples relating to results, the total home goals must be more than the total away goals and there cannot be more home wins than away wins eg
No, the scores could have been 2-0 6-0 0-3 0-2 2-2 3-3 3-3 4-4 4-4 1-1
B1
No, the scores could have been 2-0 6-0 0-3 0-2 and then all draws
B1
If scores are given, assume home team first
Use of ‘they’ implies the home team in a statement relating to a team eg No, because they could score more just in one game
B1
No, the home team scored 0 in 9 matches and 25 in the final game
B1
No, the home team may have scored lots in one game
B1
No, multiple goals could be scored by a home team in one game
B1
No, the away team win a lot of games by one goal and lose by a lot of goals in one game
B1
Yes with or without an explanation
B0
No, the away team win a lot of games by one goal
B0
No, multiple goals could be scored in one game
B0
No, more goals scored at home but it doesn’t mean that they won more
B0
No, we don't know how many goals were scored in each game
B0
No, the home team scored more goals in some games than others