28 The table shows information about the weights of 120 oranges.
Weight (\(w\) grams)
Frequency
\(50 \lt w \leqslant 100\)
34
\(100 \lt w \leqslant 150\)
29
\(150 \lt w \leqslant 200\)
27
\(200 \lt w \leqslant 250\)
19
\(250 \lt w \leqslant 300\)
11
(a) Find the class interval that contains the median. (1)
(b) Calculate an estimate for the mean weight of the 120 oranges. Give your answer correct to 3 significant figures. (3)
Mark scheme (a)
Answer
Mark
Mark scheme
\(100 \lt w \leqslant 150\)
B1
cao
Mark scheme (b)
Answer
Mark
Mark scheme
152
M1
for finding 5 products within the interval (including end points) with not more than one error, may be seen near table, eg \(75 \times 34\ (= 2550)\), \(125 \times 29\ (= 3625)\), \(175 \times 27\ (= 4725)\), \(225 \times 19\ (= 4275)\), \(275 \times 11\ (= 3025)\) or for 18200
M1
for \(\Sigma fx \div \Sigma f\) eg \((\text{``}2550\text{''} + \text{``}3625\text{''} + \text{``}4725\text{''} + \text{``}4275\text{''} + \text{``}3025\text{''}) \div 120\) or \(\text{``}18200\text{''} \div 120\)
A1
for answer in the range 151 to 152
Additional guidance
do not award this mark if the final answer comes from an alternative incorrect method, eg \(120 \div 5\ (= 24)\) or \(\Sigma mp \div \Sigma f\ (875 \div 120\ (= 7.29\ldots))\) or \(\Sigma mp \div 5\ (875 \div 5\ (= 175))\)
Min \(fx\)
Max \(fx\)
1700
3400
2900
4350
4050
5400
3800
4750
2750
3300
15200
21200
\(\Sigma fx\) must come from 5 products, \(fx\) within intervals (including end points)
Correct midpoints must be used for the award of the A mark
22 Seija works at a weather station. The table gives information about the temperature, \(T\) °C, at midday for each of 50 cities in the UK on Tuesday.
Temperature (\(T\) °C)
Frequency
\(10 \lt T \leqslant 15\)
2
\(15 \lt T \leqslant 20\)
8
\(20 \lt T \leqslant 25\)
13
\(25 \lt T \leqslant 30\)
21
\(30 \lt T \leqslant 35\)
6
(a) Calculate an estimate for the mean temperature. (3)
Seija says,
“The median temperature is 22.5 °C because 22.5 is the middle number in the middle group.”
(b) Is Seija correct? Give a reason for your answer. (1)
Mark scheme (a)
Answer
Mark
Mark scheme
24.6
M1
for finding 5 products within intervals (including end points) with not more than one error, may be seen near table. eg \(2 \times 12.5\ (= 25)\), \(8 \times 17.5\ (= 140)\), \(13 \times 22.5\ (= 292.5)\), \(21 \times 27.5\ (= 577.5)\), \(6 \times 32.5\ (= 195)\) or for 1230
M1
for \(\Sigma fx \div \Sigma f\) eg \((\text{``}25\text{''} + \text{``}140\text{''} + \text{``}292.5\text{''} + \text{``}577.5\text{''} + \text{``}195\text{''}) \div \text{``}50\text{''}\) or \(\text{``}1230\text{''} \div \text{``}50\text{''}\)
A1
for 24.6 oe
Additional guidance
Min \(fx\)
Max \(fx\)
20
30
120
160
260
325
525
630
180
210
\(\Sigma fx\) must come from 5 products, \(fx\) within intervals (including end points)
Mark scheme (b)
Answer
Mark
Mark scheme
No, with reason
C1
for No and reason
Acceptable No, the median is in the interval \(25 \lt T \leqslant 30\) No, the median is in the group containing the 25(.5)th temperature No, she did not take into account frequency No, the frequencies are not the same for each group.
Not acceptable No, the median is 27.5 No, the median is higher than 22.5 \(25 \lt T \leqslant 30\) Yes, …
Additional guidance
Any incorrect statement as part of a correct response can be ignored unless it contradicts the statement.
3 Seija works at a weather station. The table gives information about the temperature, \(T\) °C, at midday for each of 50 cities in the UK on Tuesday.
Temperature (\(T\) °C)
Frequency
\(10 \lt T \leqslant 15\)
2
\(15 \lt T \leqslant 20\)
8
\(20 \lt T \leqslant 25\)
13
\(25 \lt T \leqslant 30\)
21
\(30 \lt T \leqslant 35\)
6
(a) Calculate an estimate for the mean temperature. (3)
Seija says,
“The median temperature is 22.5 °C because 22.5 is the middle number in the middle group.”
(b) Is Seija correct? Give a reason for your answer. (1)
Mark scheme (a)
Answer
Mark
Mark scheme
24.6
M1
for finding 5 products within intervals (including end points) with not more than one error, may be seen near table. eg \(2 \times 12.5\ (= 25)\), \(8 \times 17.5\ (= 140)\), \(13 \times 22.5\ (= 292.5)\), \(21 \times 27.5\ (= 577.5)\), \(6 \times 32.5\ (= 195)\) or for 1230
M1
for \(\Sigma fx \div \Sigma f\) eg \((\text{``}25\text{''} + \text{``}140\text{''} + \text{``}292.5\text{''} + \text{``}577.5\text{''} + \text{``}195\text{''}) \div \text{``}50\text{''}\) or \(\text{``}1230\text{''} \div \text{``}50\text{''}\)
A1
for 24.6 oe
Additional guidance
Min \(fx\)
Max \(fx\)
20
30
120
160
260
325
525
630
180
210
\(\Sigma fx\) must come from 5 products, \(fx\) within intervals (including end points)
Mark scheme (b)
Answer
Mark
Mark scheme
No, with reason
C1
for No and reason
Acceptable examples No, the median is in the interval \(25 \lt T \leqslant 30\) No, the median is in the group containing the 25(.5)th temperature No, she did not take into account frequency No, the frequencies are not the same for each group.
Not acceptable examples No, the median is 27.5 No, the median is higher than 22.5 \(25 \lt T \leqslant 30\) Yes, …
Additional guidance
Any incorrect statement as part of a correct response can be ignored unless it contradicts the statement.
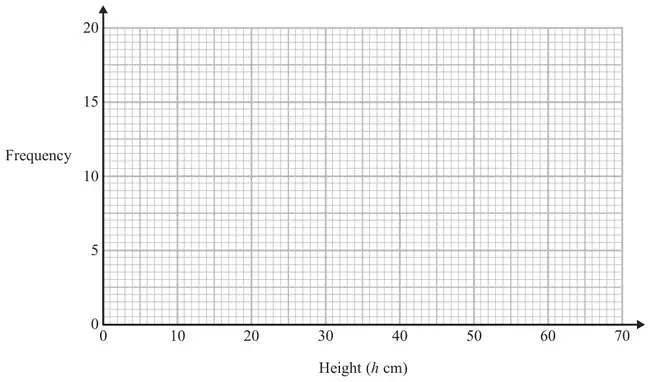
for fully correct polygon with points plotted at the midpoints
(B1
for points plotted correctly but not joined by straight lines or joining points at correct heights consistently within intervals including plotting at end values or correct frequency polygon with one point incorrect or correct frequency polygon with first and last points joined directly)
Additional guidance
For B2: Joining must be with line segments
For B1: for example, at 10, 20, 30,...or at 20, 30, 40,... Ignore any histogram drawn and any part of frequency polygon outside range of first and last points plotted
27 The table shows information about the weekly earnings of 20 people who work in a shop.
Weekly earnings (£\(x\))
Frequency
\(150 \lt x \leqslant 250\)
1
\(250 \lt x \leqslant 350\)
11
\(350 \lt x \leqslant 450\)
5
\(450 \lt x \leqslant 550\)
0
\(550 \lt x \leqslant 650\)
3
(a) Work out an estimate for the mean of the weekly earnings. (3)
Nadiya says,
“The mean may not be the best average to use to represent this information.”
(b) Do you agree with Nadiya? You must justify your answer. (1)
Mark scheme (a)
Answer
Mark
Notes
365
M1
\(fx\) with \(x\) consistent within intervals eg \(200 \times 1\), \(300 \times 11\), \(400 \times 5\), \(500 \times 0\), \(600 \times 3\), if 200, 3300, 2000, 0, 1800 are seen without working then condone 1 error
M1
(dep) \(\Sigma fx \div \Sigma f\) eg \(\text{``}7300\text{''} \div 20\)
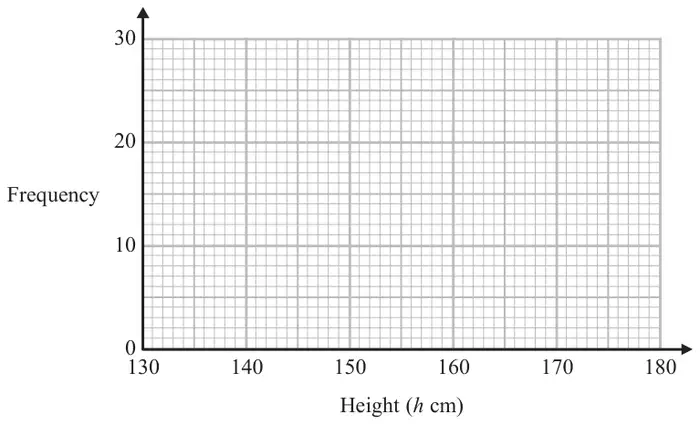
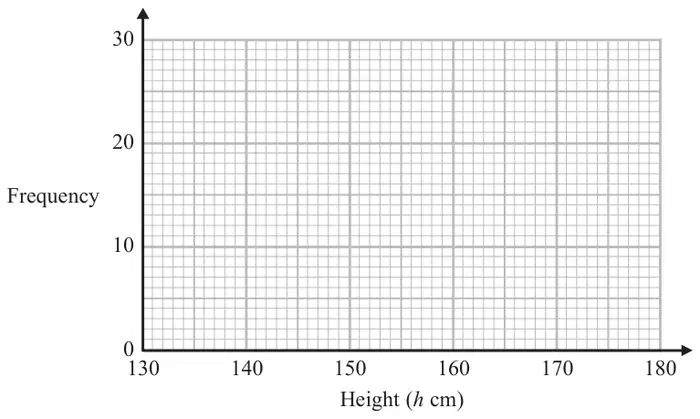
19 The table shows information about the heights of 80 children.
Height (\(h\) cm)
Frequency
\(130 \lt h \leqslant 140\)
4
\(140 \lt h \leqslant 150\)
11
\(150 \lt h \leqslant 160\)
24
\(160 \lt h \leqslant 170\)
22
\(170 \lt h \leqslant 180\)
19
(a) Find the class interval that contains the median. (1)
(b) Draw a frequency polygon for the information in the table.(2)
Mark scheme (a)
Answer
Mark
Notes
\(160 \lt h \leqslant 170\)
B1
correct class interval
Mark scheme (b)
Answer
Mark
Notes
Line segments joining the points (135, 4), (145, 11), (155, 24), (165, 22) and (175, 19)
C2
for fully correct frequency polygon
[C1
for points plotted correctly at midpoints of intervals OR joining points with line segments at the correct heights and consistent within the intervals (including end values) OR correct frequency polygon with one point incorrect OR correct frequency polygon with first and last point joined] NB: ignore any histogram drawn and any part of frequency polygon outside range of first and last points plotted
5 The table shows information about the weekly earnings of 20 people who work in a shop.
Weekly earnings (£\(x\))
Frequency
\(150 \lt x \leqslant 250\)
1
\(250 \lt x \leqslant 350\)
11
\(350 \lt x \leqslant 450\)
5
\(450 \lt x \leqslant 550\)
0
\(550 \lt x \leqslant 650\)
3
(a) Work out an estimate for the mean of the weekly earnings. (3)
Nadiya says,
“The mean may not be the best average to use to represent this information.”
(b) Do you agree with Nadiya? You must justify your answer. (1)
Mark scheme (a)
Answer
Mark
Notes
365
M1
\(fx\) with \(x\) consistent within intervals eg \(200 \times 1\), \(300 \times 11\), \(400 \times 5\), \(500 \times 0\), \(600 \times 3\), if 200, 3300, 2000, 0, 1800 are seen without working then condone 1 error
M1
(dep) \(\Sigma fx \div \Sigma f\) eg \(\text{``}7300\text{''} \div 20\)
1 The table shows information about the heights of 80 children.
Height (\(h\) cm)
Frequency
\(130 \lt h \leqslant 140\)
4
\(140 \lt h \leqslant 150\)
11
\(150 \lt h \leqslant 160\)
24
\(160 \lt h \leqslant 170\)
22
\(170 \lt h \leqslant 180\)
19
(a) Find the class interval that contains the median. (1)
(b) Draw a frequency polygon for the information in the table.(2)
Mark scheme (a)
Answer
Mark
Notes
\(160 \lt h \leqslant 170\)
B1
correct class interval
Mark scheme (b)
Answer
Mark
Notes
Line segments joining the points (135, 4), (145, 11), (155, 24), (165, 22) and (175, 19)
C2
for fully correct frequency polygon
[C1
for points plotted correctly at midpoints of intervals OR joining points with line segments at the correct heights and consistent within the intervals (including end values) OR correct frequency polygon with one point incorrect OR correct frequency polygon with first and last point joined] NB: ignore any histogram drawn and any part of frequency polygon outside range of first and last points plotted
12 Rob records the time he takes to drive to work every day for 80 days.
The table shows information about the results.
Time, \(t\) (minutes)
Frequency
\(20 \leqslant t \lt 25\)
16
\(25 \leqslant t \lt 30\)
32
\(30 \leqslant t \lt 40\)
24
\(40 \leqslant t \lt 60\)
8
Total = 80
Last year, the mean time Rob took to drive to work was 25 minutes.
Estimate the percentage increase in the mean driving time for these 80 days. [4 marks]
Mark scheme
Answer
Mark
Comments
\(22.5 \times 16\) or 360 and \(27.5 \times 32\) or 880 and \(35 \times 24\) or 840 and \(50 \times 8\) or 400 or 2480
M1
allow one incorrect midpoint
(their 360 + their 880 + their 840 + their 400) \(\div\) 80 or \(2480 \div 80\) or 31
M1
condone bracket error seen eg \(360 + 880 + 840 + 400 \div 80\) their values must come from ‘midpoints’ within or on class bounds multiplied by correct frequencies
(their \(31 - 25) \div 25\ (\times 100)\) or \(6 \div 25\ (\times 100)\) or \(0.24\ (\times 100)\) or their \(31 \div 25\ (\times 100)\) or \(1.24\ (\times 100)\) or 124
Information about their hourly rates of pay is shown in the table.
Hourly rate, £\(p\)
Number of employees
\(10 \leqslant p \lt 14\)
66
\(14 \leqslant p \lt 20\)
32
\(20 \leqslant p \lt 40\)
15
\(40 \leqslant p \lt 100\)
10
Total \(=\) 123
The owner of the company uses the data to make two statements.
Statement A “Over 30% of employees have an hourly rate that is more than £17”
Statement B “The average hourly rate of pay is more than £20”
(a) Show working that supports Statement A. [3 marks]
(b) Why might Statement A not be true? [1 mark]
(c) Work out an estimate of the mean to support Statement B. [3 marks]
(d) Why is the mean not the best average to represent the data? [1 mark]
Mark scheme (a)
Answer
Mark
Comments
Alternative method 1 Works out best estimate of the percentage of employees with hourly rate more than £17
\(32 \div 2\) or 16
M1
oe implied by 41 or 82
\((15 + 10 + \text{their } 16) \div 123\) or \(41 \div 123\) or \(\dfrac{1}{3}\) or 0.33(...) or \((66 + \text{their } 16) \div 123\) or \(82 \div 123\) or \(\dfrac{2}{3}\) or 0.66(…) or 0.67
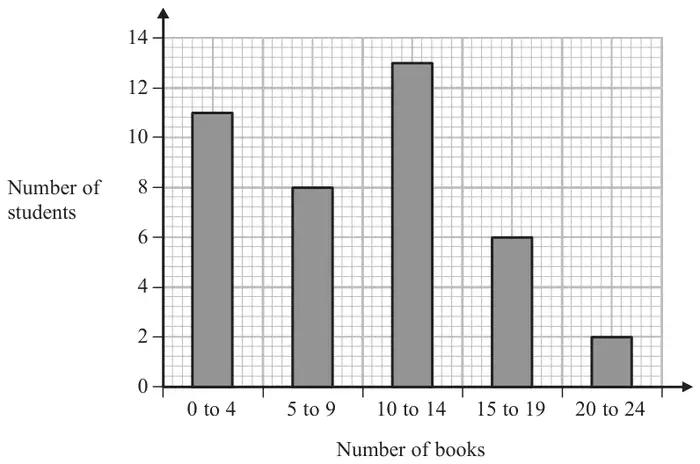
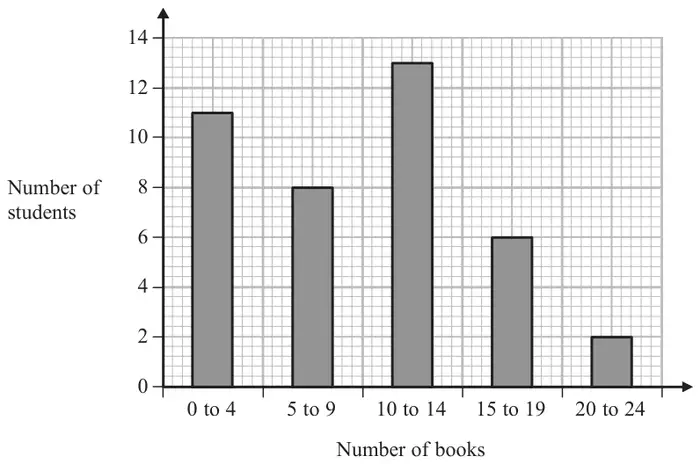
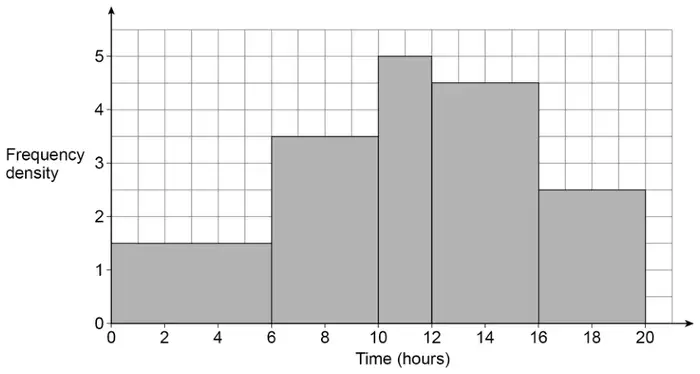
23 61 students recorded how many hours they spent revising for a test.
The histogram represents the results.
(a) Work out an estimate of the mean time the 61 students spent revising.
You may use the table to help you. [4 marks]
Time, \(x\) (hours)
Frequency
Midpoint
\(0 \leqslant x \lt 6\)
\(6 \leqslant x \lt 10\)
\(10 \leqslant x \lt 12\)
\(12 \leqslant x \lt 16\)
\(16 \leqslant x \lt 20\)
(b) Give a reason why the answer to part (a) is an estimate. [1 mark]
Mark scheme (a)
Answer
Mark
Comments
\(1.5 \times 6\) or 9 or \(3.5 \times 4\) or 14 or \(5 \times 2\) or 10 or \(4.5 \times 4\) or 18 or \(2.5 \times 4\) or 10
M1
oe values 9, 14, 10 or 18 must be in the correct row in the table or linked to the correct bar on the histogram
\(1.5 \times 6 \times 3\) or \(9 \times 3\) or 27 or \(3.5 \times 4 \times 8\) or \(14 \times 8\) or 112 or \(5 \times 2 \times 11\) or \(10 \times 11\) or 110 or \(4.5 \times 4 \times 14\) or \(18 \times 14\) or 252 or \(2.5 \times 4 \times 18\) or \(10 \times 18\) or 180 or 681
M1dep
oe values 27, 112, 110, 252 or 180 must be in the correct row in the table
(their 27 + their 112 + their 110 + their 252 + their 180) ÷ (their 9 + their 14 + their 10 + their 18 + their 10) or \(681 \div 61\)
M1dep
oe full correct method eg (their 27 + their 112 + their 110 + their 252 + their 180) \(\div\) 61
[11.16, 11.2]
A1
accept 11 with M3 scored and no errors
Additional guidance
Up to M2 may be awarded for correct work with no answer, or incorrect answer, even if this is seen amongst multiple attempts
20 Here is some information about the time spent on social media by 40 women and 40 men last week.
Time spent, \(t\) (hours)
Number of women
Number of men
\(2 \lt t \leqslant 5\)
12
10
\(5 \lt t \leqslant 8\)
11
17
\(8 \lt t \leqslant 11\)
14
9
\(11 \lt t \leqslant 14\)
2
4
\(14 \lt t \leqslant 17\)
1
0
Tick one box for each statement. [3 marks]
Definitely true
Might be true
Cannot be true
Three of the women spent more than 11 hours on social media.
The range for the men is 15 hours.
The women have a higher median than the men.
Mark scheme
Answer
Mark
Comments
Three of the women spent more than 11 hours on social media: Definitely true The range for the men is 15 hours: Cannot be true The women have a higher median than the men: Might be true
B3
B1 for each any clear indication
Additional guidance
Only a cross in a row, mark the cross
A tick and cross(es) in a row – mark the tick
More than one tick in a row scores B0 for that row
16 The number of goals scored by 20 players in a season is shown.
Number of goals
Frequency
Midpoint
0 to 4
6
5 to 9
11
10 to 14
3
Total = 20
Work out an estimate of the mean number of goals per player.
Give your answer as a decimal. [3 marks]
Mark scheme
Answer
Mark
Comments
\(2 \times 6\) or 12 and \(7 \times 11\) or 77 and \(12 \times 3\) or 36 or 125
M1
may be seen in table at least two correct products or their values
\(\dfrac{\text{their } 12 + \text{their } 77 + \text{their } 36}{20}\) or \(\dfrac{125}{20}\) or \(125 \div 20\) or \(6\dfrac{1}{4}\)
M1dep
oe condone bracket error if working seen eg condone \(12 + 77 + 36 \div 20\)
6.25
A1
Additional guidance
6.25 in working, 6 on answer line
M1M1A0
\(125 \div 3\)
M1M0A0
Correct product(s) seen in the table but a different method not using their product(s) used for the mean is choice eg 125 in table but mean calculated as \(20 \div 3 = 6.7\)
13 The amounts spent on clothes by 40 boys and 40 girls in one month were recorded.
The table shows information about the amounts spent by the boys.
Amount, \(x\) (£)
Midpoint
Number of boys
\(0 \leqslant x < 20\)
22
\(20 \leqslant x < 40\)
9
\(40 \leqslant x < 60\)
6
\(60 \leqslant x < 80\)
3
Total = 40
The mean for the girls was £35
Estimate the mean for the girls as a percentage of the mean for the boys. [5 marks]
Mark scheme
Answer
Mark
Comments
Alternative method 1
Any three of [9.5, 10.5] \(\times\) 22 or [209, 231] and [29.5, 30.5] \(\times\) 9 or [265.5, 274.5] and [49.5, 50.5] \(\times\) 6 or [297, 303] and [69.5, 70.5] \(\times\) 3 or [208.5, 211.5] or 1000
M1
(their [209, 231] + their [265.5, 274.5] + their [297, 303] + their [208.5, 211.5]) \(\div\) 40 or \(1000 \div 40\)
M1dep
oe condone bracket error if working seen eg \(220 + 270 + 300 + 210 \div 40\)
25
A1
\(\dfrac{35}{\text{their } 25}\) or \(\dfrac{7}{5}\) or 1.4
Any three of [9.5, 10.5] \(\times\) 22 or [209, 231] and [29.5, 30.5] \(\times\) 9 or [265.5, 274.5] and [49.5, 50.5] \(\times\) 6 or [297, 303] and [69.5, 70.5] \(\times\) 3 or [208.5, 211.5] or 1000
M1
\(35 \times 40\) or 1400
M1
1000 and 1400
A1
\(\dfrac{\text{their } 1400}{\text{their } 1000}\) or \(\dfrac{7}{5}\) or 1.4
M1dep
oe eg \(1 + \dfrac{\text{their } 1400 - \text{their } 1000}{\text{their } 1000}\) dep on M2
140
A1ft
ft their 1400 and their 1000 with M3 scored
Additional guidance
Alt 1 Correct products seen in the table but a different method not using their products used for the mean shown in the working lines eg \(40 \div 4 = 10\) can score a maximum of M0M0A0M1A1ft
Alt 1 \(1000 \div 4\) (= 250) is not a misread
NB The dependency of the M marks and the requirement for applying A1ft are different for the two alternative methods
Alt 1 3rd M1 Allow any number for their 25 (unless it contradicts their mean)
Alt 1 3rd M1 and A1ft If there is a mean for the boys allow the M mark to be implied by a correct ft answer eg from a mean of 250 allow M1A1ft for 14%
For A1ft allow answers to the nearest whole number or better
Further work after working out the percentage is 3rd M0 eg Mean = 25 \(\dfrac{35}{\text{their } 25} \times 100 = 140\) 140 – 100 = 40 Answer 40
accept 4.8 or 5 if full working shown using correct midpoints
Additional guidance
Two correct from 30, 52.5 and 12.5 implies the first mark and could be used to score up to M2
M1
Midpoints used in the ranges [2, 3], [7, 8] and [12, 13] must be seen eg \(2.5 \times 12\) and \(7 \times 7\) and 12 \((\times 1)\) or \(3 \times 12\) and \(7 \times 7\) and 13 \((\times 1)\) NB These could be used to score up to M2
M1
Correct products seen in the table but a different method shown in the working lines eg \(20 \div 4 = 5\)
\(t \geqslant 15\) product must be 0 if seen condone bracket error seen eg \(30 + 52.5 + 12.5 \div 20\)
4.75
A1
accept 4.8 or 5 if full working shown using correct midpoints
Additional guidance
Two correct from 30, 52.5 and 12.5 implies the first mark and could be used to score up to M2
M1
Midpoints used in the ranges [2, 3], [7, 8] and [12, 13] must be seen eg \(2.5 \times 12\) and \(7 \times 7\) and 12 \((\times 1)\) or \(3 \times 12\) and \(7 \times 7\) and 13 \((\times 1)\) NB These could be used to score up to M2
M1
Correct products seen in the table but a different method shown in the working lines eg \(20 \div 4 = 5\)