7 There are only 10p coins, 20p coins, 50p coins and £1 coins in a bag.
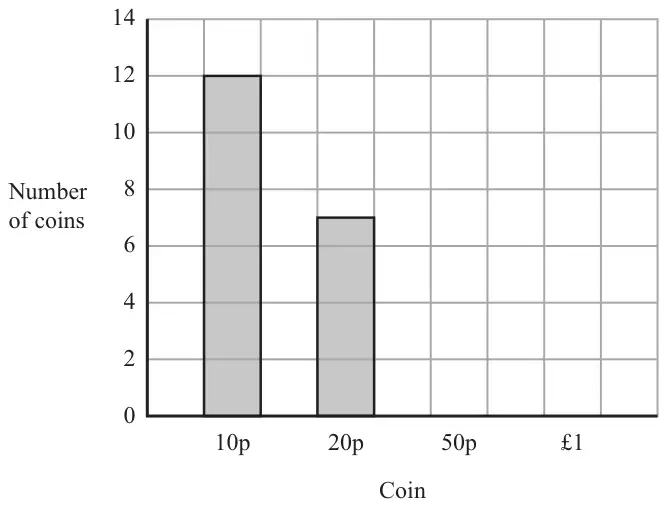
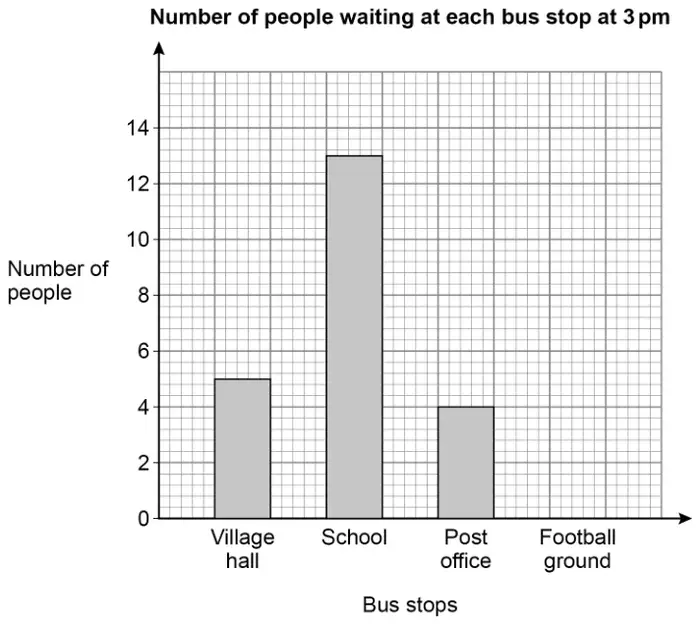
The bar chart shows information about the number of 10p coins and the number of 20p coins in the bag.
There are eight 50p coins in the bag. There are three £1 coins in the bag.
(a) Use this information to complete the bar chart. (2)
(b) Show that the total amount of money in the bag is less than £10 (3)
Mark scheme (a)
Answer
Mark
Mark scheme
Completed bar chart
B2
for a fully correct bar chart
(B1
for one bar correct, eg ‘50p’ plotted at 8 or ‘£1’ plotted at 3 or both reversed ie ‘50p’ plotted at 3 and ‘£1’ plotted at 8)
Additional guidance
Condone bars of unequal width Condone no gaps or inconsistent gaps
Mark scheme (b)
Answer
Mark
Mark scheme
Shown
M1
for method to find total amount of at least two coin types, from \(10\text{(p)} \times 12\ (= 120\text{(p)})\), \(20\text{(p)} \times 7\ (= 140\text{(p)})\), \(50\text{(p)} \times 8\ (= 400\text{(p)})\), \((\text{£})1 \times 3\ (= 300\text{(p) or (£)}3)\)
M1
for a complete method to find the total amount of money e.g. \(\text{``}120\text{''} + \text{``}140\text{''} + \text{``}400\text{''} + \text{``}300\text{''}\ (= 960)\) or \(\text{``}1.20\text{''} + \text{``}1.40\text{''} + \text{``}4\text{''} + \text{``}3\text{''}\ (= 9.60)\)
C1
(dep on method shown for totals for at least two coin types or separate correct totals for at least two coin types) showing correct comparable figures eg (£)9.6(0) or 960(p) and 1000(p) or (£)0.4(0) or 40p
Additional guidance
Accept mixed units for both method marks e.g. 10p x 12 (= 120), 20 x 7 (= 1.4), 50(p) x 8 (= 4), 1 x 3 (= 300)
Accept mixed units for both method marks e.g. 120 + 140 + 4 + 3 (= 9.60)
Answer must be in consistent units 9.60 oe alone with no working will score M1M1
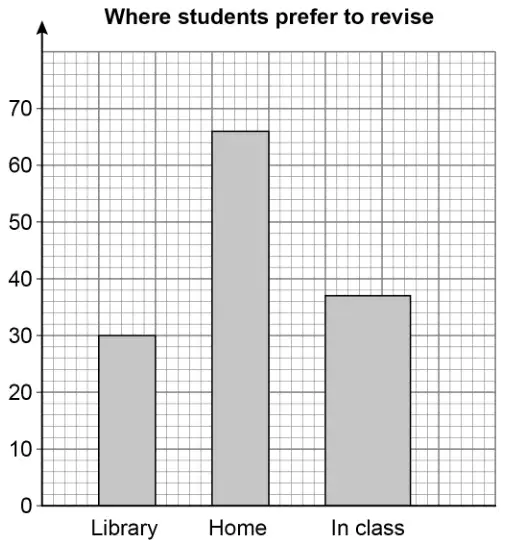
8 The table shows information about where students prefer to revise.
Library
Home
In class
30
68
37
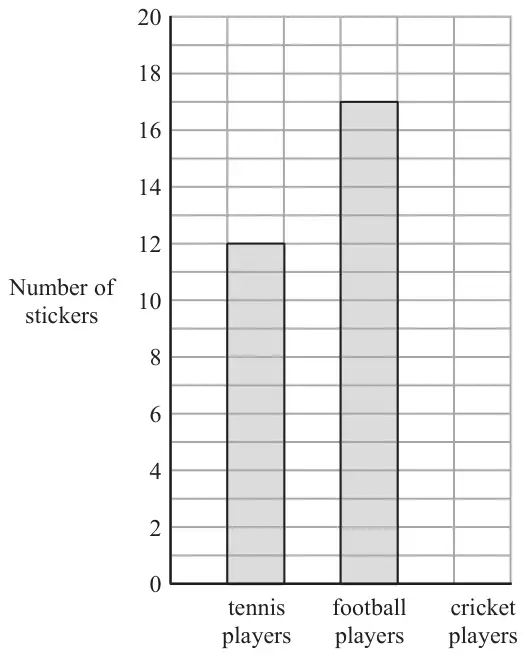
Ed draws this bar chart to represent the data.
Write down three mistakes he has made. [3 marks]
Mark scheme
Answer
Mark
Comments
Three from:
Vertical axis label missing
Horizontal axis label missing
Width of third bar too wide
Height of second bar incorrect
B3
B2 two bullets satisfied B1 one bullet satisfied
Additional guidance
Ignore irrelevant but non-contradictory statements
Check diagram for comments
First bullet Number of students label is missing / \(y\)-axis label is missing We don’t know what the 0 10 20 stand for No frequency (label) or No label on the side
B1 B1 B1
Second bullet No label for where students prefer to revise \(x\)-axis label missing or No label at the bottom
B1 B1
Third bullet Bars not equal widths or Two bars are 5 wide and one bar is 7.5 wide Third bar wrong size, it’s too wide/thick Third bar wrong or Third bar wrong size Third bar too big / double the width Bars are different sizes
B1 B1 B0 B0 B0
Fourth bullet Second bar should be (one square) higher/taller Total should be 135 but chart is 133 Second bar is 66 or Second bar should be 68 Second bar is 63 but should be 68 Data for Home is wrong
B1 B1 B1 B0 B0
Two marks may be scored in one sentence eg Home bar too short and In Class too wide
B2
No vertical label and no horizontal label No label(s) / Hasn’t labelled the chart
B2 B1
Three valid mistakes with one or more invalid mistakes
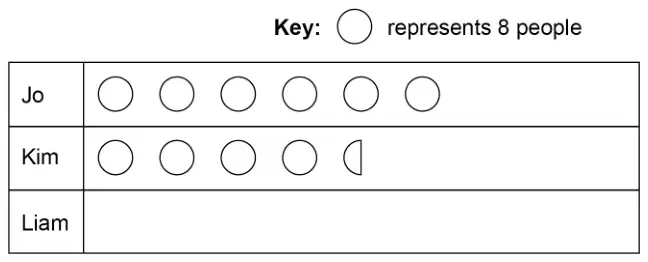
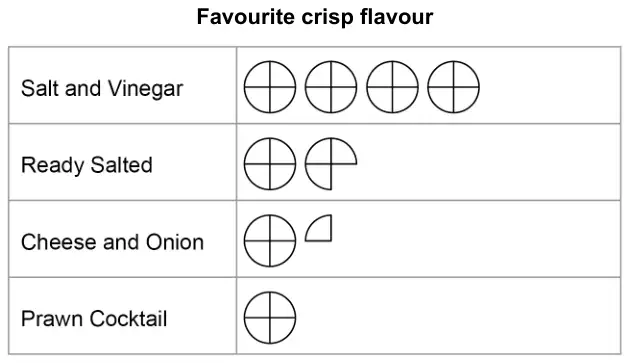
9 Nicki asked 30 people to name their favourite crisp flavour.
Here are the results.
Salt and Vinegar
16
Ready Salted
7
Cheese and Onion
5
Prawn Cocktail
2
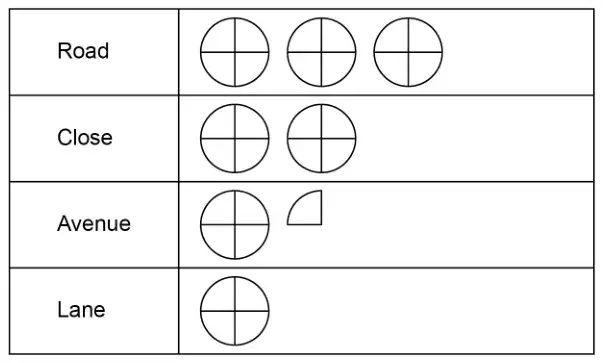
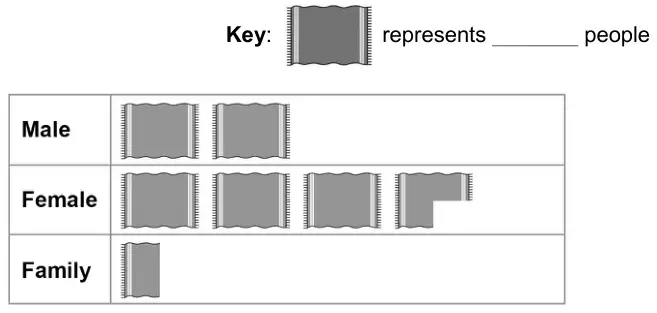
Nicki drew this pictogram to represent the results.
What two mistakes has Nicki made? [2 marks]
Mistake 1 \(\ldots\ldots\ldots\)
Mistake 2 \(\ldots\ldots\ldots\)
Mark scheme
Answer
Mark
Comments
Key is missing
B1
oe implied by correct key drawn
Symbols are inconsistent
B1
oe eg Prawn Cocktail should have half a symbol or eg if Prawn Cocktail is right the others are wrong or eg total is incorrect
Additional guidance
Ignore irrelevant or incorrect statements
Examples of ‘Key is missing’ for B1 Not labelled what each quarter represents Hasn’t said what a full circle shows Doesn’t say how many people is one piece
Examples of ‘Symbols are inconsistent’ for B1 Nicki’s total is 32 not 30 The pictogram has inconsistent values 4 for PC it should be 2 Prawn Cocktail is the wrong amount Prawn Cocktail is two, but there’s a whole circle
Condone the omission of brackets Accept one error or omission in reading from diagram
4.7
A1
oe
Additional guidance
5 on answer line with 4.7 in working
M1A1
4 on answer line with 4.7 in working
M1A0
\((4 + 2 + 4 + 8 + 8 + 7 + 9) \div 10\) is one omission \((4 + 2 + 4 + 8 + 8 + 7 + 9 + 6) \div 10\) is one error \((6 + 12 + 15 + 13) \div 10\) assume one error \((25 + 23) \div 10\) assume one error \(2.5 + 2.3\) assume one error
M1
Do not accept further calculation after 4.7 seen \(47 \div 10 = 4.7\) \(4.7 \times 4 = 18.8\)
M1A0
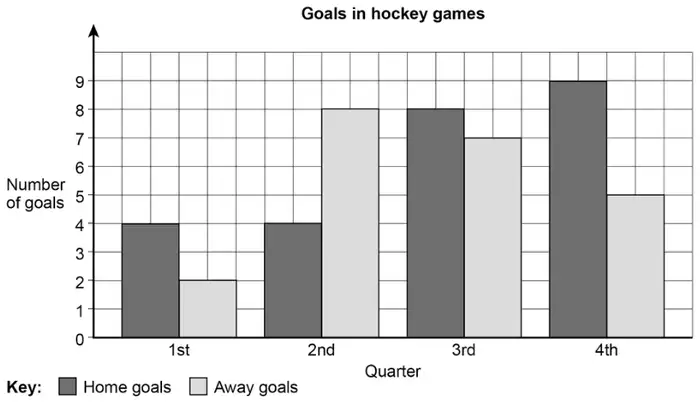
Use of away goals only, treat as misread from the words in part (a) \((2 + 8 + 7 + 5) \div 10\) or 2.2 condone the omission of brackets
M1A0
5 on answer line without working
M0A0
\((6 + 12 + 15) \div 10\) assume two omissions
M0A0
Mark scheme (c)
Answer
Mark
Comments
Alternative method 1
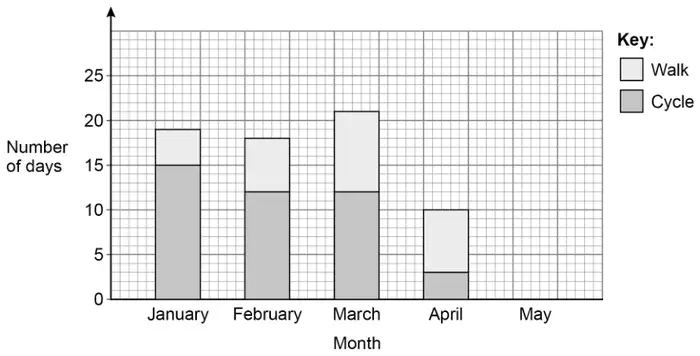
\(4 + 4 + 8 + 9\) and \(2 + 8 + 7 + 5\) or 25 and 22
M1
Accept one error in reading from diagram
3
A1
Alternative method 2
\(4 - 2\) or 2 and \(4 - 8\) or \(-4\) and \(8 - 7\) or 1 and \(9 - 5\) or 4
M1
Accept one error in reading from diagram Differences may be seen on the diagram
3
A1
Additional guidance
\(25 - 22 = 3\)
M1A1
\(4 - 2 = 2\) and \(4 - 8 = -4\) and \(8 - 6 = 2\) and \(9 - 5 = 4\) is one reading error
M1
\(4 - 2 = 2\) and \(4 - 8 = 4\) and \(8 - 7 = 1\) and \(9 - 5 = 4\)
M1
\(4 + 4 + 8 + 9\) and \(2 + 7 + 7 + 5\) is one reading error \(24 - 21 = 3\)
M1 A0
1st 2 2nd 4 3rd 1 4th 4 is one error in calculation without working
M0A0
1st 2 3rd 1 4th 4 is one omission
M0A0
\(24 - 21 = 3\) with no other working
M0A0
\(4 + 4 + 8 + 8\) and \(2 + 8 + 6 + 5\) is two reading errors \(24 - 21 = 3\)
M0 A0
Mark scheme (d)
Answer
Mark
Comments
No and valid reason eg Indicates that one or more home teams might have won a game or games by a lot of goals
B1
Additional guidance
In numerical examples relating to results, the total home goals must be more than the total away goals and there cannot be more home wins than away wins eg
No, the scores could have been 2-0 6-0 0-3 0-2 2-2 3-3 3-3 4-4 4-4 1-1
B1
No, the scores could have been 2-0 6-0 0-3 0-2 and then all draws
B1
If scores are given, assume home team first
Use of ‘they’ implies the home team in a statement relating to a team eg No, because they could score more just in one game
B1
No, the home team scored 0 in 9 matches and 25 in the final game
B1
No, the home team may have scored lots in one game
B1
No, multiple goals could be scored by a home team in one game
B1
No, the away team win a lot of games by one goal and lose by a lot of goals in one game
B1
Yes with or without an explanation
B0
No, the away team win a lot of games by one goal
B0
No, multiple goals could be scored in one game
B0
No, more goals scored at home but it doesn’t mean that they won more
B0
No, we don't know how many goals were scored in each game
B0
No, the home team scored more goals in some games than others