
Foundation June 2024 Paper 3 Q1
1 A village has four bus stops.
The bar chart shows information about the people at the bus stops at 3 pm one day.
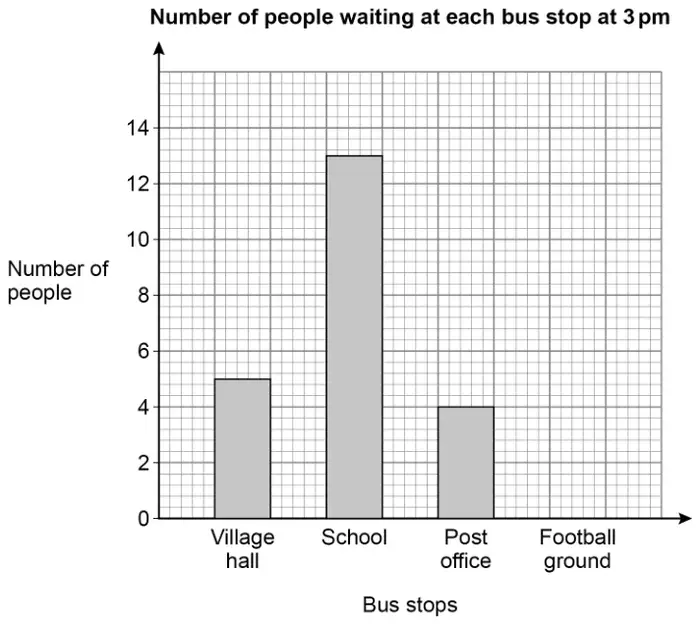
(a) Two people were at the Football ground bus stop.
Show this information on the bar chart. [1 mark]
(b) How many more people were at the School bus stop than at the Post office bus stop? [1 mark]
| Answer | Mark | Comments |
|---|---|---|
| Correct bar in correct position | B1 |
Additional guidance
Mark intention
Shading not required
| Answer | Mark | Comments |
|---|---|---|
| 9 | B1 |