
Foundation November 2023 Paper 1 Q8
8 Shamira uses a tally chart to record the vehicles passing her school.
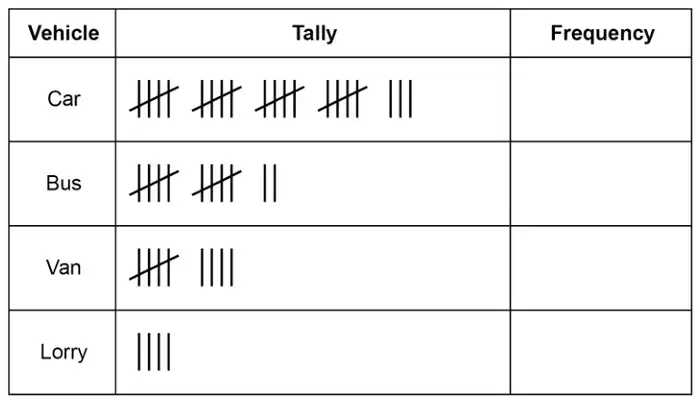
Here is her chart with the tallies.
Each 5-bar gate \(\big(\cancel{||||}\big)\) represents 5 vehicles.
(a) Shamira says,
“The number of cars is more than the total of the other vehicles
because cars have four 5-bar gates and the others only have three 5-bar gates.”
Is she correct?
Tick a box.
- Yes
- No
Show working to support your answer. [2 marks]
(b) On the grid, draw a bar chart to represent the data in the tally chart. [3 marks]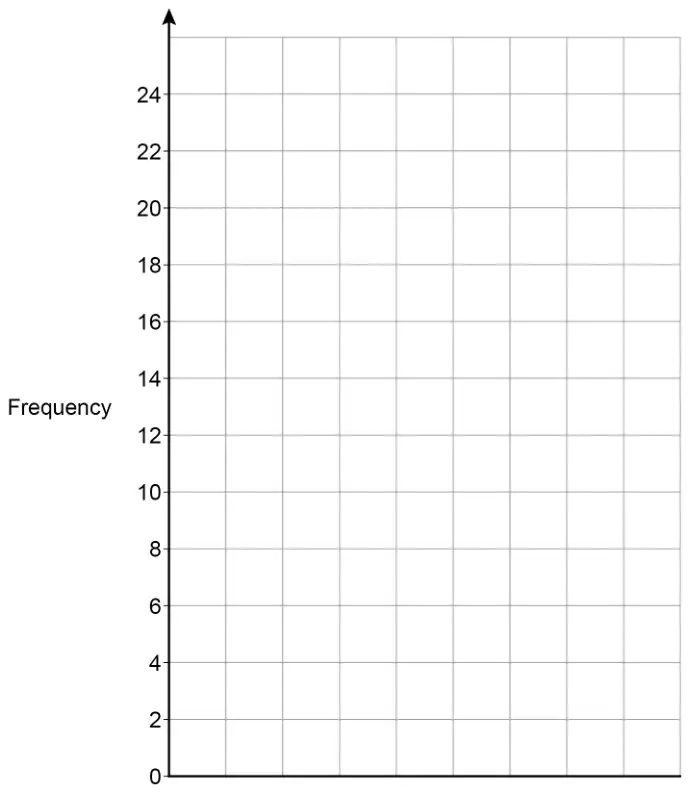
| Answer | Mark | Comments |
|---|---|---|
| No and 23 and 25 or No and 2 more | B2 | B1 23 or 25 No may be implied by wording |
Additional guidance
| Check table for working | |
| Ignore incorrect use of inequalities | |
| 23 is less than 25 so Shamira’s wrong (box not ticked) | B2 |
| Answer | Mark | Comments |
|---|---|---|
Fully correct bar chart:
| B3ft | correct or ft their frequencies from (a) but not 0 B2 3 criteria met B1 2 criteria met |
Additional guidance
Mark intention throughout
Condone a different gap between the vertical axis and the first bar, to the other (equal) gaps
Vertical lines can score a maximum of B2
Points can score a maximum of B1