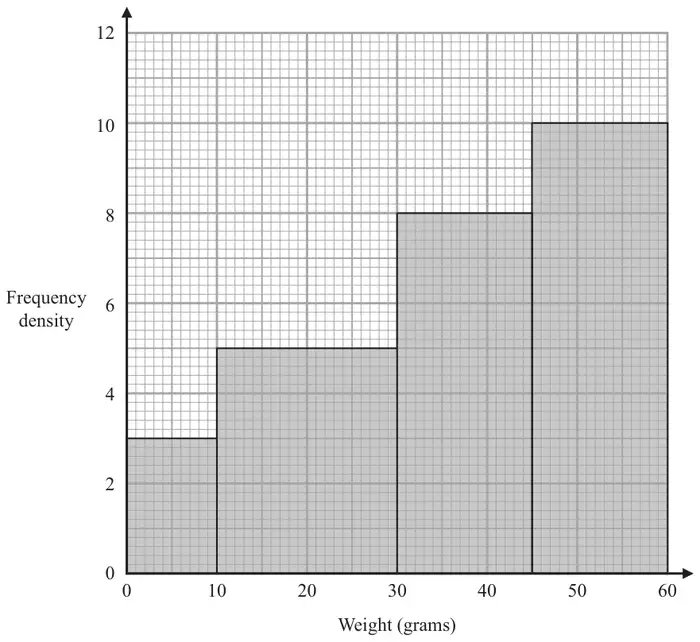
15 The histogram gives information about the weights, in grams, of some biscuits.
One of these biscuits is taken at random.
Work out an estimate for the probability that the biscuit will have a weight between 20 grams and 40 grams. (4)
Mark scheme
Answer
Mark
Mark scheme
\(\dfrac{130}{400}\) oe
M1
for a method to find the frequency (or area) of one relevant interval, eg \(3 \times 10\ (= 30)\) or \(5 \times 20\ (= 100)\) or \(8 \times 15\ (= 120)\) or \(10 \times 15\ (= 150)\) or \(5 \times 10\ (= 50)\) or \(8 \times 10\ (= 80)\)
or, using 1 cm2 = 1 unit, \(3 \times 2\ (= 6)\) or \(5 \times 4\ (= 20)\) or \(8 \times 3\ (= 24)\) or \(10 \times 3\ (= 30)\) or \(5 \times 2\ (= 10)\) or \(8 \times 2\ (= 16)\)
M1
for a method to find the total frequency (or area), eg \(\text{``}30\text{''} + \text{``}100\text{''} + \text{``}120\text{''} + \text{``}150\text{''}\ (= 400)\) or \(\text{``}6\text{''} + \text{``}20\text{''} + \text{``}24\text{''} + \text{``}30\text{''}\ (= 80)\)
M1
for a method to find the frequency (or area) between 20 g and 40 g, eg \(\text{``}50\text{''} + \text{``}80\text{''}\ (= 130)\) or \(\text{``}10\text{''} + \text{``}16\text{''}\ (= 26)\)
A1
for \(\dfrac{130}{400}\) oe
Additional guidance
Evidence for this mark may be seen on the diagram
Accept equivalent methods
For M marks condone use of 2.5 for fd of 3 and/or 4.5 for fd of 5
Accept any equivalent fraction, decimal form, 0.32(5) or 0.33 or percentage form, 32.(5)% or 33%
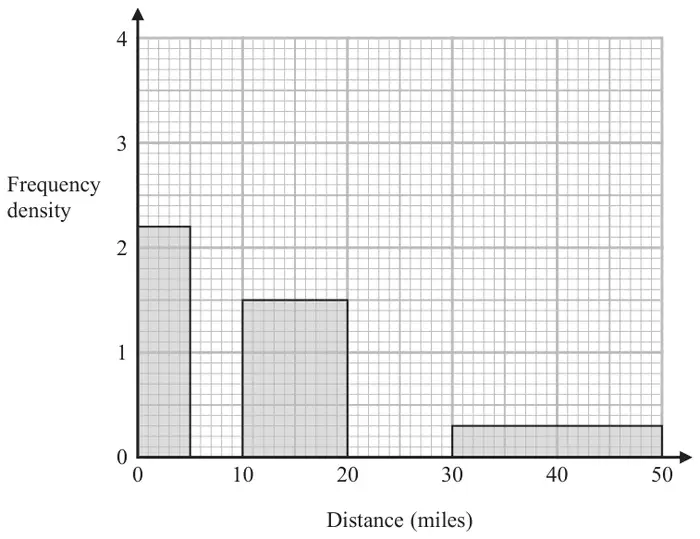
16 The histogram gives information about the distances that 60 teachers travelled to school on Monday. The histogram is incomplete.
11 of the teachers travelled between 0 miles and 5 miles. None of the teachers travelled a distance greater than 50 miles.
The number of teachers who travelled between 5 miles and 10 miles is the same as the number of teachers who travelled between 20 miles and 30 miles.
Complete the histogram. (4)
Mark scheme
Answer
Mark
Mark scheme
Histogram completed
M1
for method to use area to find at least one other frequency (not 11), eg \(10 \times 1.5\ (= 15)\) or \(20 \times 0.3\ (= 6)\)
M1
for method to find unknown frequencies, eg \((60 - 11 - \text{``}15\text{''} - \text{``}6\text{''}) \div 2\ (= 14)\)
M1
ft for method to find an unknown frequency density, eg \(\text{``}14\text{''} \div 5\ (= 2.8)\) or \(\text{``}14\text{''} \div 10\ (= 1.4)\) or one correct bar drawn