
Higher June 2017 Paper 2 Q24
24 48 students completed some homework.
This histogram shows information about the times taken.
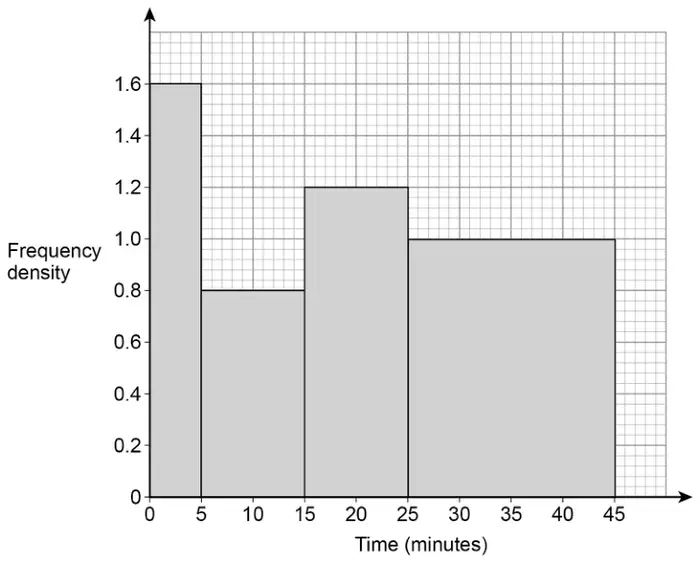
Work out an estimate of the interquartile range.
You must show your working. [4 marks]
| Answer | Mark | Comments |
|---|---|---|
| Alternative method 1 | ||
| (LQ =) 10 and (UQ =) 33 and answer 23 | B4 | B3 (LQ =) 10 and (UQ =) 33 B2 (LQ =) 10 or (UQ =) 33 B1 Any two correct frequencies from 8, 8, 12 and 20 |
| Alternative method 2 | ||
| (LQ =) 10.3125 and (UQ =) 33.75 and answer 23.4375 | B4 | B3 (LQ =) 10.3125 and (UQ =) 33.75 B2 (LQ =) 10.3125 or (UQ =) 33.75 B1 Any two correct frequencies from 8, 8, 12 and 20 |
Additional guidance
| Alt 2 is using \(\dfrac{48 + 1}{4} = 12.25\) and \(\dfrac{3(48 + 1)}{4} = 36.75\) to work out quartiles | |
| Correct frequencies must be for the correct bar | |
| 33.75 may come from \(\dfrac{3}{4} \times 45\) | B0 |
| Allow B1 for two correct frequencies even if not subsequently used | B1 |
| Frequency of 8 seen once with no other correct frequencies counts as one correct | |
| Frequency of 8 seen twice counts as two correct | B1 |
| \(36 - 12 = 24\) or \(36.75 - 12.25 = 24.5\) with \(\lt 2\) correct frequencies | B0 |
| Answer 23 with neither quartile correct and \(\lt 2\) correct frequencies | B0 |
| 10-33 and 23 | B4 |
| 10-33 | B3 |
| Do not allow dashes or vertical lines at 10 and/or 33 to imply correct quartiles |