
Higher November 2019 Paper 2 Q13
13 200 people recorded the time they spent on social media one day.
The table shows the results.
| Time, \(t\) (mins) | Frequency | Midpoint | |
|---|---|---|---|
| \(0 \leqslant t < 30\) | 24 | ||
| \(30 \leqslant t < 50\) | 76 | ||
| \(50 \leqslant t < 60\) | 52 | ||
| \(60 \leqslant t < 90\) | 48 | ||
| Total = 200 |
(a) Work out an estimate of the mean time. [3 marks]
(b) Draw a histogram to represent the results. [4 marks]
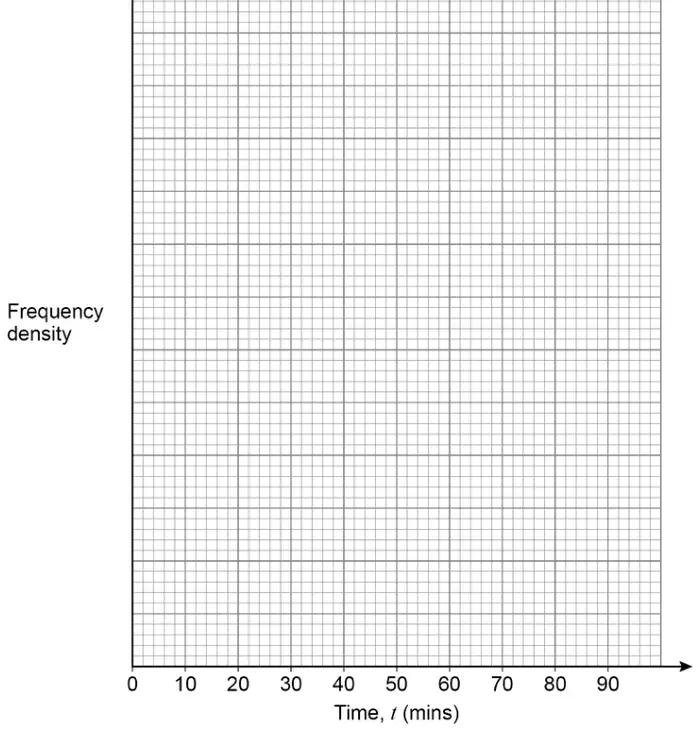
| Time, \(t\) (mins) | Frequency | Class width | |
|---|---|---|---|
| \(0 \leqslant t < 30\) | 24 | ||
| \(30 \leqslant t < 50\) | 76 | ||
| \(50 \leqslant t < 60\) | 52 | ||
| \(60 \leqslant t < 90\) | 48 |
| Answer | Mark | Comments |
|---|---|---|
| \(15 \times 24\) or 360 and \(40 \times 76\) or 3040 and \(55 \times 52\) or 2860 and \(75 \times 48\) or 3600 or 9860 | M1 | allow one incorrect midpoint |
| (their \(360 +\) their \(3040 +\) their \(2860 +\) their \(3600) \div 200\) or \(9860 \div 200\) | M1dep | condone bracket error seen eg \(360 + 3040 + 2860 + 3600 \div 200\) |
| 49.3 | A1 | accept 49 if full working shown using correct midpoints |
Additional guidance
| Four values or products with three correct from 360, 3040, 2860 and 3600 implies the first mark and could be used to score up to M2 | |
| Correct products seen in the table or working but a different method shown in the working lines eg \(200 \div 4\) | M0 |
| Ignore attempts to convert to minutes and seconds after 49.3 seen eg 49 min 18 s or 49 min 30 s | |
| 49.3 in working with answer \(30 \leqslant t < 50\) | M2A0 |
| Answer | Mark | Comments |
|---|---|---|
| \(24 \div 30\) or 0.8 or \(76 \div 20\) or 3.8 or \(52 \div 10\) or 5.2 or \(48 \div 30\) or 1.6 or four frequency densities in correct proportion | M1 | implied by a correct bar eg 8 and 38 and 52 and 16 |
| At least three of 0.8 and 3.8 and 5.2 and 1.6 | M1dep | implied by at least three bars in correct proportion |
| At least 3 bars in correct proportion with matching scale on vertical axis or at least 3 bars in correct proportion with a matching key | M1dep | |
| Fully correct histogram with scale on vertical axis or a key | A1 | \(\pm\dfrac{1}{2}\) small square ignore frequency polygon if included |
Additional guidance
Allow up to M2 even if not subsequently used
Correct bars must have correct widths