
Higher November 2022 Paper 2 Q23
23 61 students recorded how many hours they spent revising for a test.
The histogram represents the results.
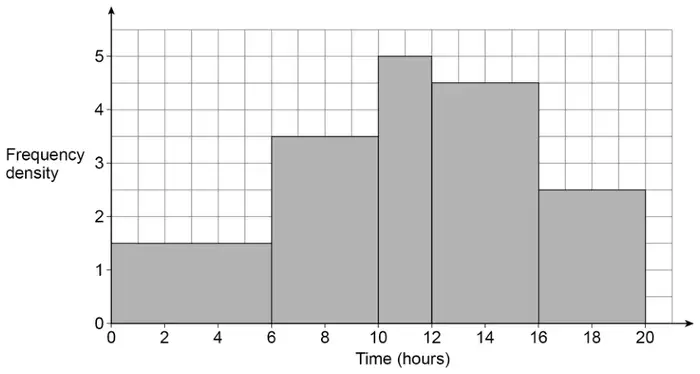
(a) Work out an estimate of the mean time the 61 students spent revising.
You may use the table to help you. [4 marks]
| Time, \(x\) (hours) | Frequency | Midpoint | |
|---|---|---|---|
| \(0 \leqslant x \lt 6\) | |||
| \(6 \leqslant x \lt 10\) | |||
| \(10 \leqslant x \lt 12\) | |||
| \(12 \leqslant x \lt 16\) | |||
| \(16 \leqslant x \lt 20\) |
(b) Give a reason why the answer to part (a) is an estimate. [1 mark]
| Answer | Mark | Comments |
|---|---|---|
| \(1.5 \times 6\) or 9 or \(3.5 \times 4\) or 14 or \(5 \times 2\) or 10 or \(4.5 \times 4\) or 18 or \(2.5 \times 4\) or 10 | M1 | oe values 9, 14, 10 or 18 must be in the correct row in the table or linked to the correct bar on the histogram |
| \(1.5 \times 6 \times 3\) or \(9 \times 3\) or 27 or \(3.5 \times 4 \times 8\) or \(14 \times 8\) or 112 or \(5 \times 2 \times 11\) or \(10 \times 11\) or 110 or \(4.5 \times 4 \times 14\) or \(18 \times 14\) or 252 or \(2.5 \times 4 \times 18\) or \(10 \times 18\) or 180 or 681 | M1dep | oe values 27, 112, 110, 252 or 180 must be in the correct row in the table |
| (their 27 + their 112 + their 110 + their 252 + their 180) ÷ (their 9 + their 14 + their 10 + their 18 + their 10) or \(681 \div 61\) | M1dep | oe full correct method eg (their 27 + their 112 + their 110 + their 252 + their 180) \(\div\) 61 |
| [11.16, 11.2] | A1 | accept 11 with M3 scored and no errors |
Additional guidance
| Up to M2 may be awarded for correct work with no answer, or incorrect answer, even if this is seen amongst multiple attempts | |||||||||||||||||||||||||
| M1M1 | ||||||||||||||||||||||||
| M1M1 | ||||||||||||||||||||||||
(4.5 + 28 + 55 + 63 + 45) ÷ (1.5 + 3.5 + 5 + 4.5 + 2.5) | M0M0 M0A0 |
| Answer | Mark | Comments |
|---|---|---|
| Valid reason | B1 | eg the data is grouped or the exact values are not used or the midpoints are estimates |
Additional guidance
| Because we are using midpoints | B1 |
| Midpoint is an average | B1 |
| There are no raw data | B1 |
| Numbers are rounded | B0 |
| There are no data to use | B0 |
| The answer is a decimal | B0 |
| Valid reason with an irrelevant statement | B1 |