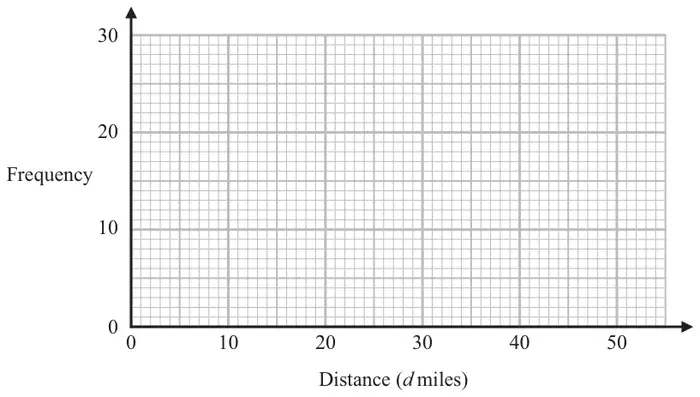
22 The table shows information about the distances that 60 people travel to work.
Distance (\(d\) miles)
Frequency
\(0 \lt d \leqslant 10\)
12
\(10 \lt d \leqslant 20\)
25
\(20 \lt d \leqslant 30\)
10
\(30 \lt d \leqslant 40\)
8
\(40 \lt d \leqslant 50\)
5
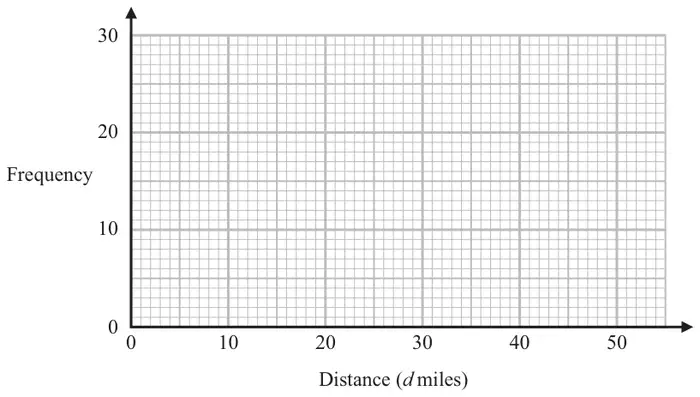
Draw a frequency polygon for the information in the table. (2)
Mark scheme
Answer
Mark
Mark scheme
Points plotted at (5, 12) (15, 25) (25, 10) (35, 8) (45, 5) and joined with line segments
B2
for correct plotting of all 5 points at midpoints and joining with line segments
(B1
for correct plotting of all 5 points at midpoints joined with a curve or missing / no line segments or for a frequency polygon with one point incorrect or for a frequency polygon with first and last point joined directly or for plotting of all 5 points at the correct heights consistent within intervals (including end points) and joining with line segments)
Additional guidance
Ignore any histogram drawn Ignore any part of the frequency polygon outside of the range of the first and last point plotted.
for example, at 0, 10, 20, 30, 40 or at 10, 20, 30, 40, 50
1 The table shows information about the distances that 60 people travel to work.
Distance (\(d\) miles)
Frequency
\(0 \lt d \leqslant 10\)
12
\(10 \lt d \leqslant 20\)
25
\(20 \lt d \leqslant 30\)
10
\(30 \lt d \leqslant 40\)
8
\(40 \lt d \leqslant 50\)
5
Draw a frequency polygon for the information in the table. (2)
Mark scheme
Answer
Mark
Mark scheme
Points plotted at (5, 12) (15, 25) (25, 10) (35, 8) (45, 5) and joined with line segments
B2
for correct plotting of all 5 points at midpoints and joining with line segments
(B1
for correct plotting of all 5 points at midpoints joined with a curve or missing / no line segments or for a frequency polygon with one point incorrect or for a frequency polygon with first and last point joined directly or for plotting of all 5 points at the correct heights consistent within intervals (including end points) and joining with line segments)
Additional guidance
Ignore any histogram drawn Ignore any part of the frequency polygon outside of the range of the first and last point plotted.
for example, at 0, 10, 20, 30, 40 or at 10, 20, 30, 40, 50