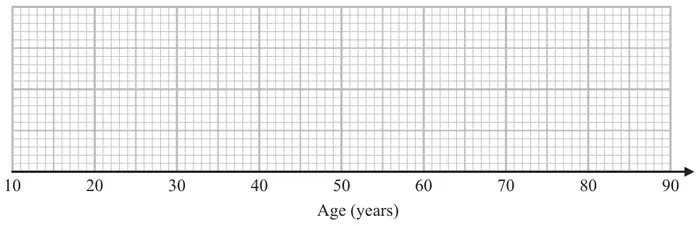
12 The table gives some information about the ages, in years, of 32 actors.
Lowest age
21
Highest age
80
Lower quartile
31
Upper quartile
42
Median
35
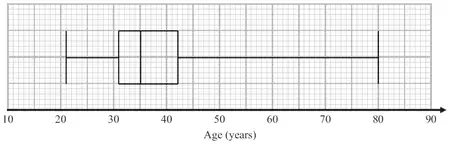
(a) Draw a box plot to represent this information.(3)
(b) Work out an estimate for the number of these actors with an age between 31 years and 42 years. (1)
Mary says,
“At least one of the actors is 35 years old because the median is 35”
(c) Is Mary correct? Give a reason for your answer. (1)
Mark scheme (a)
Answer
Mark
Mark scheme
Drawn
B3
for a fully correct box plot
(B2
for 3 or 4 correctly plotted values including box and whiskers/tails
(B1
for 2 correctly plotted values including box or whiskers/tails or 5 correct values plotted or clearly identified and no box or whiskers/tails)
Additional guidance
See diagram at end of scheme Min = 21 LQ = 31 Med = 35 UQ = 42 Max = 80
Mark scheme (b)
Answer
Mark
Mark scheme
16
B1
cao
Mark scheme (c)
Answer
Mark
Mark scheme
Explanation
C1
Acceptable examples Not true as the median could be the average of two ages No, the median is not always one of the numbers in the data Because there is an even amount of numbers, there must be 2 in the middle that have a mean of 35 She could be correct if the middle two numbers are both 35
Not acceptable examples Yes… No more are between 31-35 than 35-42 No as there is an even number at least two must be 35 No the median is just the average We can’t tell from the graph Because there is an even amount of numbers Not true as we do not know the exact ages of all data.
Additional guidance
Figures need not be stated, but if they are, they must be correct