
Foundation November 2024 Paper 3 Q22
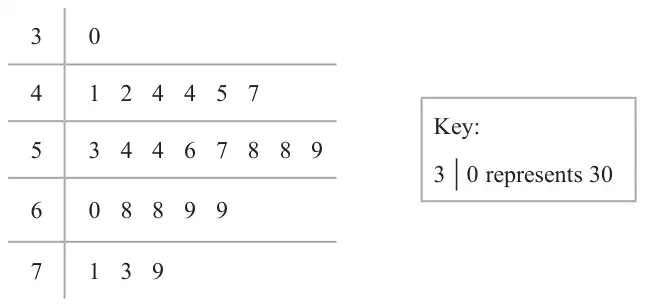
22 The stem and leaf diagram shows the test scores of 23 students from School A.
23 students from School B did the same test.
Their median score was 56
The range of their scores was 47
Compare the distribution of the test scores of the students from School A with the distribution of the test scores of the students from School B. (4)
| Answer | Mark | Mark scheme |
|---|---|---|
| Comparison | B1 | for correctly identifying the median of (School) A as 57 |
| C1 | (ft, dep on value for the median being stated) for making a correct comparison of median eg ‘the median of (School) A is higher than the median of (School) B’ | |
| B1 | for correctly identifying the range of (School) A as 49 | |
| C1 | (ft, dep on value for the range being stated) for making a correct comparison of range eg ‘the range of (School) A is higher than the range of (School) B’ |
Additional guidance
If median for school B is stated in the comparison it must be correct
If range for school B is stated in the comparison it must be correct