
Higher June 2019 Paper 2 Q25
25 A sample of 50 eggs is taken from Farm A.
The table shows information about the masses of the eggs from Farm A.
Farm A
| Mass, \(m\) (grams) | Frequency |
|---|---|
| \(53 < m \leqslant 58\) | 8 |
| \(58 < m \leqslant 63\) | 19 |
| \(63 < m \leqslant 68\) | 15 |
| \(68 < m \leqslant 73\) | 8 |
A sample of 50 eggs is taken from Farm B.
The histogram shows information about the masses of the eggs from Farm B.
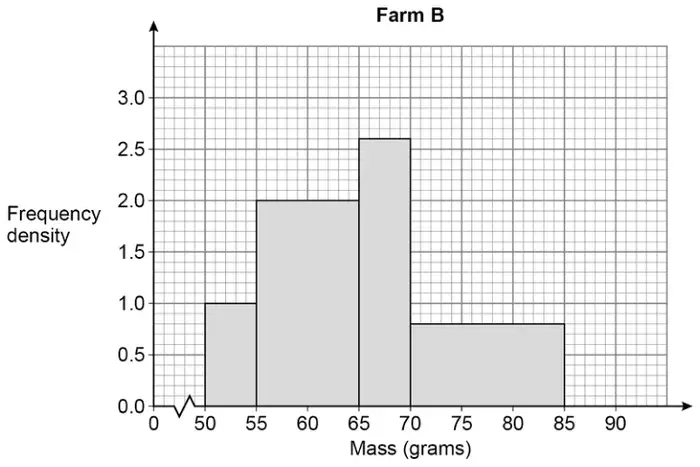
For medium eggs, \(\quad 53\text{ g} < \text{mass} \leqslant 63\text{ g}\)
The Farm A sample has more medium eggs than the Farm B sample.
Using the table and the histogram, estimate how many more.
You must show your working. [4 marks]
| Answer | Mark | Comments |
|---|---|---|
| 8 + 19 or 27 | M1 | may be seen in the table |
| \(\dfrac{2}{5} \times 5\ (\times 1)\) or 2 | M1 | oe eg \(\dfrac{55 - 53}{5} \times 5\) or \(\dfrac{50}{5 \times 10 + 10 \times 20 + 5 \times 26 + 15 \times 8} \times 2 \times 10\) or \(0.1 \times 20\) may be seen on the histogram |
| \(\dfrac{8}{10} \times 10 \times 2\) or 16 | M1 | oe eg \(\dfrac{63 - 55}{10} \times 10 \times 2\) or \(\dfrac{50}{5 \times 10 + 10 \times 20 + 5 \times 26 + 15 \times 8} \times 8 \times 20\) or \(0.1 \times 160\) may be seen on the histogram |
| 9 | A1 |
Additional guidance
| 18 (medium eggs) for Farm B with no incorrect working implies 2nd and 3rd M1 | |
| \((19 + 8 - 2 - 16 = 19 + 8 - 18)\ \ 19 - 10 = 9\) | M3A1 |
| \(\dfrac{27}{50} - \dfrac{2}{50} - \dfrac{16}{50} = \dfrac{9}{50}\) | M3A0 |
| 8 + 19 + 15 + 8 does not score the 1st M1 | |
| 8 27 42 50 is M0 unless they select 27 |