
Higher June 2018 Paper 2 Q17
17 The histogram shows information about the times taken by some students to finish a puzzle.
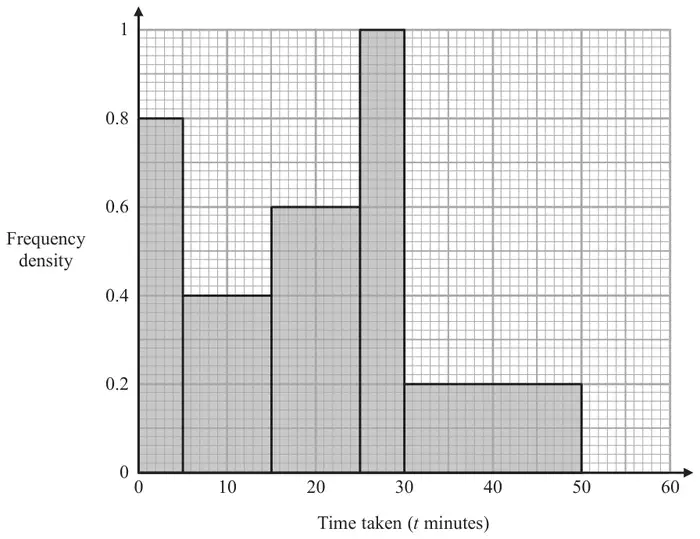
(a) Complete the frequency table for this information.
(2)
| Time taken (\(t\) minutes) | Frequency |
|---|---|
| \(0 \lt t \leqslant 5\) | 4 |
| \(5 \lt t \leqslant 15\) | |
| \(15 \lt t \leqslant 25\) | |
| \(25 \lt t \leqslant 30\) | |
| \(30 \lt t \leqslant 50\) |
(b) Find an estimate for the lower quartile of the times taken to finish the puzzle. (2)
| Answer | Mark | Mark scheme |
|---|---|---|
| 4, 6, 5, 4 | M1 | for a correct method to find at least 2 frequencies from bars of different widths, eg \(10 \times 0.4\) (=4), \(10 \times 0.6\) (=6), \(5 \times 1\) (=5), \(20 \times 0.2\) (=4) |
| A1 | cao |
| Answer | Mark | Mark scheme |
|---|---|---|
| 10 | M1 | for \(\dfrac{23 + 1}{4}\) (=6) or \(\dfrac{23}{4}\) (=5.75) could ft from their table in (a) |
| A1 | for 10 or 9.375 |
Additional guidance
Be aware of 10 coming from incorrect working
ft does not apply to the A1