
Higher November 2018 Paper 3 Q17
17 The table shows information about the distances 570 students travelled to a university open day.
| Distance (\(d\) miles) | Frequency |
|---|---|
| \(0 \lt d \leqslant 20\) | 120 |
| \(20 \lt d \leqslant 50\) | 90 |
| \(50 \lt d \leqslant 80\) | 120 |
| \(80 \lt d \leqslant 150\) | 140 |
| \(150 \lt d \leqslant 200\) | 100 |
(a) Draw a histogram for the information in the table.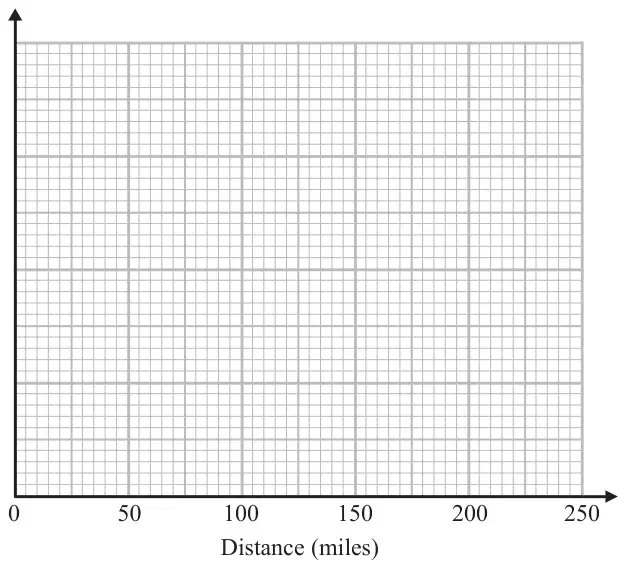
(b) Estimate the median distance. (2)
| Answer | Mark | Mark scheme |
|---|---|---|
| Histogram drawn | B3 | for fully correct histogram eg relative heights 6, 3, 4, 2, 2 |
| (B2 | for 4 correct blocks or all 5 frequency ÷ class interval and 1 correct block) | |
| (B1 | for at least 2 correct blocks of different widths or for frequency ÷ class interval for at least 3 frequencies) |
| Answer | Mark | Mark scheme |
|---|---|---|
| 66 to 71 | M1 | indication of the median in the third interval or proportional method shown |
| A1 | ft answer between 66 and 71 |
Additional guidance
Just stating the interval is sufficient for this mark
May be implied by the number on the answer line
Median is at (approx.) 68.75 by a proportional method