
Higher June 2022 Paper 3 Q25
25 A company makes tubes of toothpaste.
The masses of 80 tubes are checked.
A histogram is drawn to represent the data.
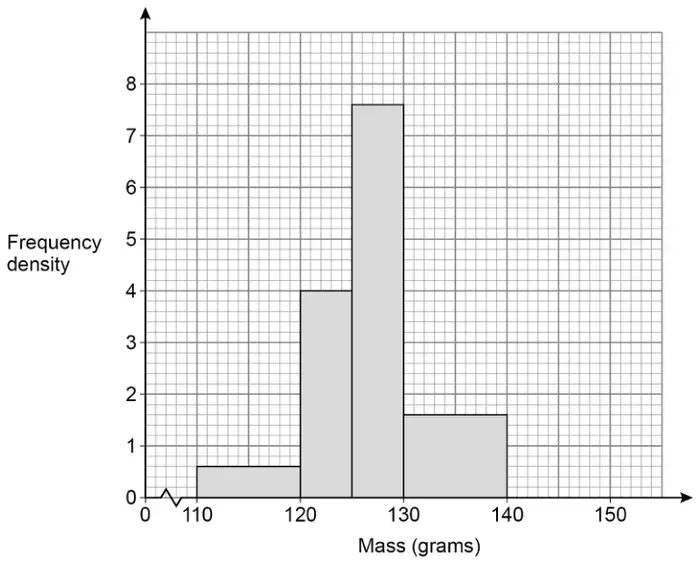
The company makes 28 000 tubes each day.
Estimate how many tubes each day have a mass less than 122 grams. [4 marks]
| Answer | Mark | Comments |
|---|---|---|
| \(0.6 \times 10\) or 6 or \(4 \times 5\) or 20 or \(7.6 \times 5\) or 38 or \(1.6 \times 10\) or 16 or \(4 \times 2\) or 8 or \(4 \times 3\) or 12 | M1 | may be seen written on correct bar correct method for any frequency |
| \(0.6 \times 10 + (122 - 120) \times 4\) or \(0.6 \times 10 + 2 \times 4\) or \(0.6 \times 10 + \dfrac{2}{5} \times 4 \times 5\) or \(6 + 8\) or 14 or \(16 + 38 + \dfrac{3}{5} \times 4 \times 5\) or 66 | M1dep | oe |
| \(14 \times\) \(\dfrac{28\,000}{80}\) or \(28\,000 - 66 \times\) \(\dfrac{28\,000}{80}\) or 23 100 | M1dep | oe eg \(14 \times 350\) \(28\,000 - 66 \times 350\) |
| 4900 | A1 | SC3 3850 or 6475 |
Additional guidance
| \(0.3 \times 10 + 2 \times 4 = 11\) and \(\dfrac{11}{80} \times 28\,000 = 3850\) | SC3 |
| \(1.3 \times 10 + 7.3 \times 5 + 4 \times 3 = 61.5\) and \(28\,000 - \dfrac{61.5}{80} \times 28\,000 = 6475\) | SC3 |
| \(\dfrac{6 + 8}{80} \times 28\,000\) or \(\dfrac{14}{80} \times 28\,000\) | M3 |