
1MA0 Higher June 2013 Paper 1 Q24
24 Bill works for a computer service centre.
The table shows some information about the length of time, \(t\) minutes, of the phone calls Bill had.
| Time (\(t\) minutes) | \(0 \lt t \leqslant 10\) | \(10 \lt t \leqslant 15\) | \(15 \lt t \leqslant 20\) | \(20 \lt t \leqslant 30\) | \(30 \lt t \leqslant 45\) |
|---|---|---|---|---|---|
| Number of calls | 12 | 15 | 13 | 18 | 3 |
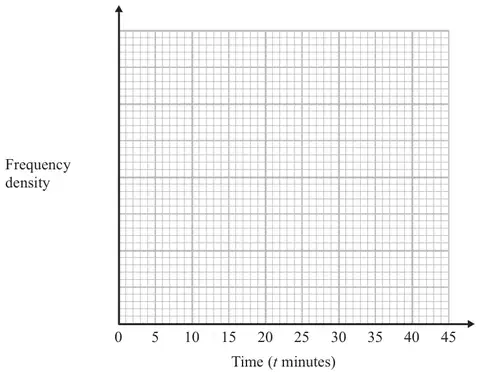
On the grid, draw a histogram to show this information. (3)
| Working | Answer | Mark | Notes |
|---|---|---|---|
| \(12 \div 10 = 1.2\) \(15 \div 5 = 3\) \(13 \div 5 = 2.6\) \(18 \div 10 = 1.8\) \(3 \div 15 = 0.2\) | Histogram | 3 | B3 for fully correct histogram (B2 for 4 correct blocks) (B1 for 3 correct blocks) (If B0, SC B1 for correct key eg 1cm² = 2 (calls) Or frequency ÷ class interval for at least 3 frequencies) NB Apply the same mark scheme if a different frequency density is used. |