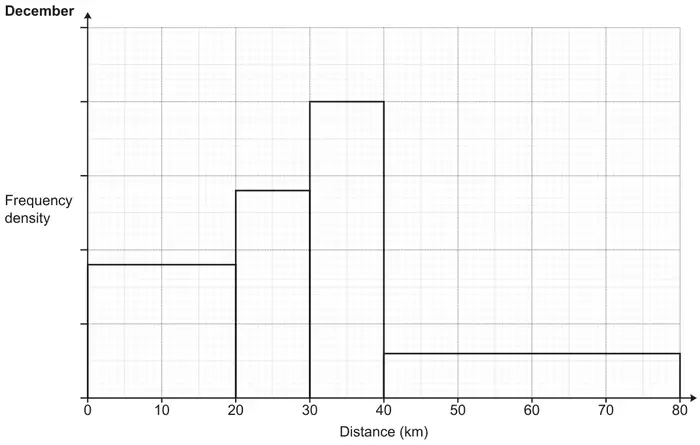
13 A running club records the distances run by each member during December. The results are shown in this histogram.
(a) 18 members run less than 20 km.
(i) Work out the number of members who run more than 30 km. [3]
(ii) Finley says
To estimate the range, I subtracted the smallest possible value from the largest possible value. So, 80 – 0 = 80 km.
Explain why Finley’s method is likely to overestimate the true value of the range. [1]
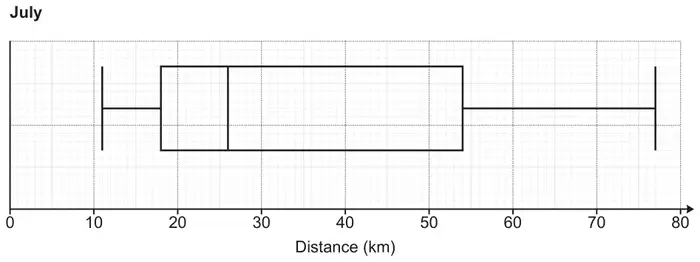
(b) This box plot shows the distribution of the distance run by each member of the running club during July.
During December,
the median distance run was 30 km
the interquartile range of the distance run was 20 km.
Make two comparisons between the distances run during December and the distances run during July. Include values to support your comparisons. [4]
Mark scheme (a)
Answer
Marks
Part marks and guidance
(a)(i)
32
3
M1 for 18 ÷ 20 soi by 0.9
M1 for \(2k \times 10\) [+] \(0.3k \times 40\) implied by 20 and 12 may be on diagram
May be soi on the vertical axis (eg. labelling the scale with [0.5,]1, [1.5, 2].
Where \(k\) is a consistent scaling of the height of the bars eg 4 × 10 [+] 0.6 × 40, 40 × 10 [+] 6 × 40 etc
Ignore extras
(a)(ii)
Unlikely the largest value will be 80 oe or The longest distance could be anywhere between 40 and 80 oe or Unlikely the smallest value will be 0 oe or The shortest distance could be anywhere between 0 and 20 oe
1
Accept: Exact distances are not known The data is in groups
Mark scheme (b)
Answer
Marks
Part marks and guidance
Median for July = 26
1
Condone mean or average for July = 26
If 0 scored overall SC1 for two correct comparisons lacking values
See appendix Condone not repeating the given values for December Need figures in comment/work space Comparison comment must be general and have context for second and fourth marks Accept for first mark “median is 4 more in Dec” oe Accept for third mark “IQR is 16 less in Dec” oe
eg SC1 for “median for July was lower” and “IQR for July was higher” oe
July distances were lower [on average] oe
1dep
IQR for July = 36
1
July distances were more varied oe
1dep
Appendix: Question 13b
Response
Comment
Marks
The median in Dec is 30 compared to July 26. This means on average people ran further in December. The IQR in Dec is 20 compared to July 36. This means the distances run were more variable in July.
Value. Compare the meaning of “on average” with “average” in the ninth example. We want a general interpretation in context. Value. Interpretation in context.
1 1 1 1
The median in Dec is 30 compared to July 26. This means the distances run in December were greater. The IQR in Dec is 20 compared to July 36. More people tended to run similar distances in December.
Value. A general interpretation in context. Value. Interpretation in context.
1 1 1 1
In July the runners on average ran shorter distances at 26km, while in December they ran further at 30km. In July the runners had a much larger IQR of distances at 36km, while in December they had a smaller IQR.
Value. Comparison in context. “on average” is a general comparison, which is what is looked for. Value. IQR not interpreted as a measure of variation.
1 1 1 0
December has a higher median distance run (26km < 30km). December has a smaller IQR compared to July (20km < 36km). This means December has a smaller spread of distances compared to July.
Value. Not an interpretation. Value. Interpretation in context.
1 0 1 1
The mean in July is 26. The range in July is 36.
Condone mean for value mark. Condone range for value mark.
1 0 1 0
The mean in July is 26. The IQR in July is 36. This means there is a bigger range of distances in July.
Condone mean for value mark. Not accepting “range” in the interpretation as it also has a technical meaning.
1 0 1 0
The median distance run in July was 26 compared to 30 in December The IQR in July is 36 compared to 20 in December
Value. Not an interpretation. Value. Not an interpretation.
1 0 1 0
The median distance in December was 4km more than in July. The IQR is 16km higher in July than in December.
Implies July is 26km. Not an interpretation. Implies July is 36km. Not an interpretation.
1 0 1 0
The median distance run in Dec is 30km compared to July 26km. This means their average is more than July. The IQR for December is less than July so it’s more consistent.
Value. ”average” being used as another word for “median” rather than as a general descriptor. No value. No context; dependent on the previous mark in any case.
1 0 0 0
There was a higher average of km in December. More spread out results in July.
No values. Comparison marks are dependent on value marks. However, they have two correct comparisons lacking values and context.
SC1
December had a higher median meaning people were running further. July had a larger average compared to December.
No value. Correct comparison in context but mark is dependent on value mark. The second statement contradicts the first and is not about IQR. Therefore, SC1 cannot be awarded.
0 0 0 0
The distance run in July was more than the distance run in December. More people run further in July than December.
No value. Incorrect and dependent on value in any case. Not about IQR.